

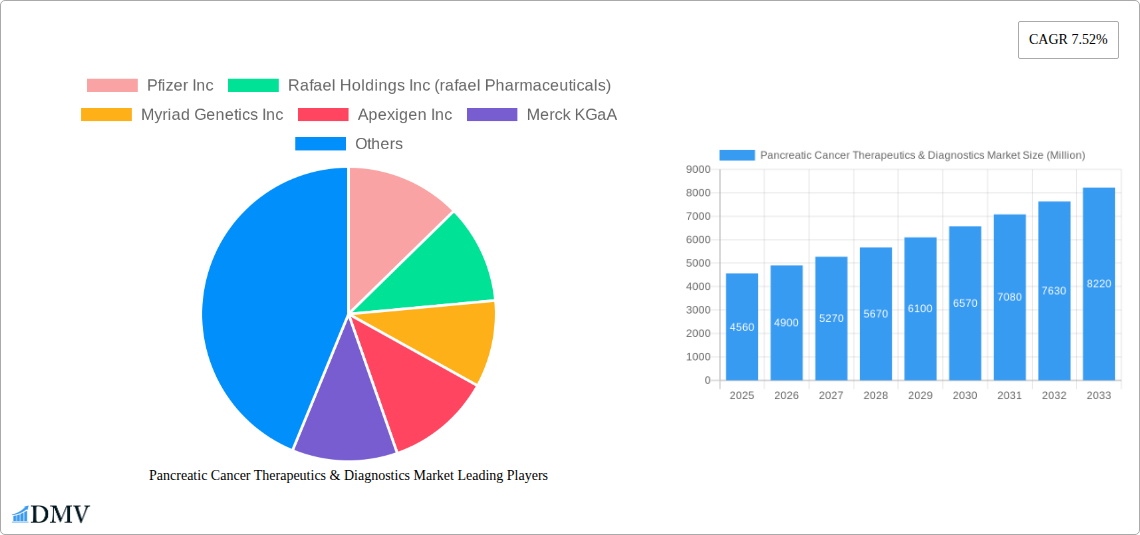
Key Insights
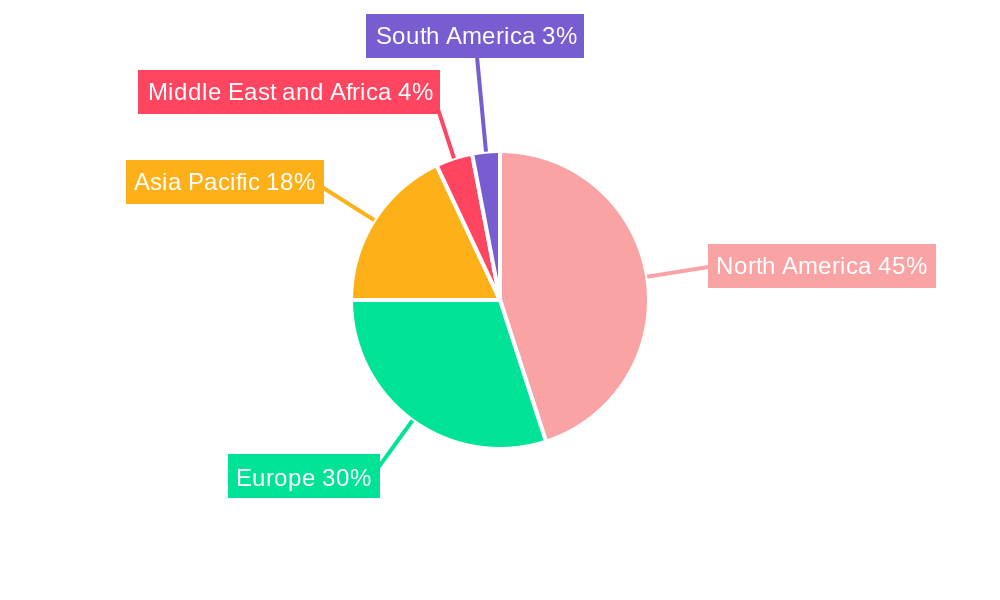
The global pancreatic cancer therapeutics and diagnostics market is experiencing robust growth, projected to reach \$4.56 billion in 2025 and maintain a Compound Annual Growth Rate (CAGR) of 7.52% from 2025 to 2033. This expansion is driven by several factors. Increasing prevalence of pancreatic cancer, coupled with advancements in targeted therapies, immunotherapies, and diagnostic technologies, are significantly contributing to market growth. The development of more effective and less toxic treatments is a key driver, improving patient outcomes and increasing demand for these solutions. Furthermore, the rising awareness about pancreatic cancer and improved early detection methods are fueling the market's expansion. The market is segmented by treatment type (e.g., chemotherapy, immunotherapy, targeted therapy) and diagnostics (e.g., imaging techniques, biomarker analysis), offering various avenues for growth. North America currently holds a significant market share due to advanced healthcare infrastructure and high healthcare expenditure. However, the Asia-Pacific region is expected to witness substantial growth in the coming years, driven by increasing awareness and rising disposable incomes. The competitive landscape includes major pharmaceutical and diagnostic companies such as Pfizer, Merck KGaA, and others, driving innovation and expanding treatment options.
Despite the positive growth trajectory, the market faces certain challenges. The high cost of treatments, limited treatment options for advanced-stage cancers, and the complex nature of the disease causing difficulties in early diagnosis, pose significant restraints on market expansion. Further research and development into novel therapeutic strategies, improved diagnostic tools for early detection and personalized medicine approaches will be crucial for addressing these limitations and further boosting market growth. The focus is shifting towards personalized medicine which takes into account an individual's unique genetic makeup to tailor treatment plans. This approach is expected to improve treatment outcomes and drive further market growth. The increasing integration of advanced technologies like artificial intelligence in diagnostics is expected to play a crucial role in improving accuracy and efficiency of diagnosis, accelerating the market expansion.
Pancreatic Cancer Therapeutics & Diagnostics Market: A Comprehensive Report (2019-2033)
This insightful report provides a detailed analysis of the global Pancreatic Cancer Therapeutics & Diagnostics market, offering a comprehensive overview of market trends, leading players, and future growth prospects. The study period spans from 2019 to 2033, with 2025 serving as the base and estimated year. The forecast period covers 2025-2033, while the historical period encompasses 2019-2024. This report is invaluable for stakeholders seeking to understand the dynamics of this crucial market segment and make informed strategic decisions. The market is projected to reach xx Million by 2033, exhibiting a CAGR of xx% during the forecast period.
Pancreatic Cancer Therapeutics & Diagnostics Market Composition & Trends
This section delves into the competitive landscape of the pancreatic cancer therapeutics and diagnostics market. We analyze market concentration, revealing that the market is moderately concentrated, with key players like Pfizer Inc, Merck KGaA, and AstraZeneca PLC holding significant market share. However, the presence of numerous smaller, innovative companies indicates a dynamic and evolving market structure. The report further investigates innovation catalysts, including advancements in targeted therapies, immunotherapy, and diagnostic imaging techniques, which are driving market growth. The regulatory landscape, characterized by stringent approvals processes and increasing focus on personalized medicine, plays a crucial role in shaping market dynamics. Substitute products, such as alternative treatment modalities and diagnostic approaches, are also examined for their potential impact. Furthermore, end-user profiles, encompassing hospitals, clinics, research institutions, and pharmaceutical companies, are detailed, along with an in-depth analysis of M&A activities within the industry. The total value of M&A deals in the past five years is estimated at xx Million, reflecting significant industry consolidation and strategic investments. Specific market share distribution among the top five players is analyzed, showing that Pfizer Inc holds approximately xx%, followed by Merck KGaA with xx%, AstraZeneca PLC with xx%, and others with xx%. The report also examines the impact of these activities on market dynamics and competition.
- Market Share Distribution: Detailed breakdown of market share held by key players.
- M&A Deal Values: Analysis of significant mergers and acquisitions in the market.
- Regulatory Landscape: Assessment of regulatory hurdles and their impact on market growth.
- Innovation Catalysts: Detailed examination of technological advancements driving market growth.
Pancreatic Cancer Therapeutics & Diagnostics Market Industry Evolution
This section provides a detailed analysis of the market's evolutionary trajectory, documenting market growth trajectories, technological advancements, and shifting consumer demands. The market exhibited a robust growth rate of xx% from 2019 to 2024, driven by increasing incidence rates of pancreatic cancer and advancements in treatment methodologies. The adoption rate of targeted therapies has shown substantial growth, increasing from xx% in 2019 to xx% in 2024, indicating a shift towards personalized medicine. Technological advancements, such as liquid biopsies and next-generation sequencing, are further accelerating market expansion by enabling earlier and more precise diagnosis. Changing consumer demands, characterized by a preference for less invasive diagnostic procedures and improved treatment outcomes, are also analyzed. The report provides a comprehensive evaluation of these key drivers and explores the evolving therapeutic landscape for pancreatic cancer, highlighting the transition towards more effective and less toxic therapies. The substantial growth in the market is driven by increased investments in research and development, a growing awareness of the disease, and technological breakthroughs in diagnostics and therapeutics. The analysis encompasses various parameters like market size, growth rate, adoption rate of new technologies, and influence of new therapeutic classes. The increasing prevalence of pancreatic cancer is the leading factor driving market growth, alongside improving diagnostic capabilities and the development of novel treatment modalities.
Leading Regions, Countries, or Segments in Pancreatic Cancer Therapeutics & Diagnostics Market
North America currently dominates the pancreatic cancer therapeutics and diagnostics market, driven by several key factors:
- High Healthcare Expenditure: Significant investments in healthcare infrastructure and research & development contribute to market growth.
- Advanced Healthcare Infrastructure: The presence of well-equipped hospitals and research institutions facilitates the adoption of new technologies and treatments.
- Stringent Regulatory Framework: While demanding, the stringent regulatory framework fosters the development and adoption of safe and effective therapies.
The dominance of North America is further underpinned by a higher prevalence of pancreatic cancer and a strong focus on advanced treatment options. However, the market in Asia-Pacific is experiencing rapid growth, fueled by increasing awareness, rising healthcare expenditure, and a growing population. Europe also holds a substantial market share, driven by investments in research and development and the adoption of novel therapeutic approaches. The detailed analysis also investigates the performance of various segments, including by treatment type (chemotherapy, targeted therapy, immunotherapy, and others) and by diagnostics (imaging, biomarkers, and others).
Pancreatic Cancer Therapeutics & Diagnostics Market Product Innovations
Recent years have witnessed significant breakthroughs in pancreatic cancer therapeutics and diagnostics. Novel targeted therapies, such as PARP inhibitors and immune checkpoint inhibitors, are exhibiting improved efficacy and reduced toxicity compared to traditional chemotherapy regimens. In diagnostics, advancements in liquid biopsy technologies, enabling minimally invasive detection of circulating tumor DNA (ctDNA), are transforming early detection and personalized treatment strategies. These innovations are characterized by unique selling propositions such as improved accuracy, earlier detection, and personalized medicine approaches, leading to better patient outcomes. The report delves into the specific performance metrics of these innovations, assessing their impact on treatment effectiveness and patient survival rates.
Propelling Factors for Pancreatic Cancer Therapeutics & Diagnostics Market Growth
Several factors are driving substantial growth in this market. Firstly, the rising prevalence of pancreatic cancer globally is a primary catalyst. Secondly, significant investments in research and development are leading to breakthroughs in innovative treatment modalities and diagnostics, thus improving patient outcomes. Thirdly, increasing awareness and earlier detection through improved screening methods contribute to early intervention and better treatment efficacy. Finally, favorable regulatory support and reimbursement policies encourage the adoption of advanced therapies.
Obstacles in the Pancreatic Cancer Therapeutics & Diagnostics Market
The market faces challenges such as the high cost of novel therapies, limiting accessibility for many patients. The complex and often late diagnosis of pancreatic cancer poses a significant hurdle. Furthermore, drug resistance and treatment-related toxicities remain major obstacles to effective treatment. Finally, the stringent regulatory approvals process for new therapeutics can create delays in market entry.
Future Opportunities in Pancreatic Cancer Therapeutics & Diagnostics Market
Future opportunities lie in personalized medicine approaches, leveraging genomic profiling to tailor treatments to individual patients. The development of novel therapeutic targets and improved drug delivery systems offers significant potential for enhancing treatment efficacy. Expansion into emerging markets, particularly in Asia and Africa, presents substantial growth opportunities.
Major Players in the Pancreatic Cancer Therapeutics & Diagnostics Market Ecosystem
- Pfizer Inc
- Rafael Holdings Inc (rafael Pharmaceuticals)
- Myriad Genetics Inc
- Apexigen Inc
- Merck KGaA
- Immunovia AB
- Novartis AG
- Amgen Inc
- Viatris Inc
- AstraZeneca PLC
- Canon Inc (canon Medical Systems Corporation)
- FUJIFILM Holdings Corporation
- F Hoffmann-La Roche AG
- Boston Scientific Corporation
- Bristol-Myers Squibb Company
Key Developments in Pancreatic Cancer Therapeutics & Diagnostics Market Industry
- Jan 2023: Pfizer announces positive Phase III trial results for a new pancreatic cancer drug.
- May 2022: Merck KGaA and a biotech firm partner to develop a novel immunotherapy for pancreatic cancer.
- Oct 2021: Acquisition of a diagnostics company by a major player enhances market consolidation. (Further details on specific acquisitions and partnerships throughout the period would be included in the full report.)
Strategic Pancreatic Cancer Therapeutics & Diagnostics Market Forecast
The pancreatic cancer therapeutics and diagnostics market is poised for significant growth, driven by continuous innovation in targeted therapies and diagnostics. The increasing prevalence of the disease, coupled with expanding healthcare infrastructure in emerging markets, will further fuel market expansion. Personalized medicine approaches, leveraging genomic information to tailor treatments, are expected to become increasingly prevalent, shaping the future of pancreatic cancer management and treatment. This combined with advancements in early detection methods promise to significantly improve patient outcomes and contribute to market expansion over the forecast period.
Pancreatic Cancer Therapeutics & Diagnostics Market Segmentation
-
1. Type
- 1.1. Targeted Therapies
- 1.2. Chemotherapy
- 1.3. Surgery
- 1.4. Other Treatments
-
2. Diagnostics
- 2.1. Imaging
- 2.2. Biopsy
- 2.3. Endoscopic Ultrasound
- 2.4. Other Diagnostics
Pancreatic Cancer Therapeutics & Diagnostics Market Segmentation By Geography
-
1. North America
- 1.1. United States
- 1.2. Canada
- 1.3. Mexico
-
2. Europe
- 2.1. United Kingdom
- 2.2. Germany
- 2.3. France
- 2.4. Italy
- 2.5. Spain
- 2.6. Rest of Europe
-
3. Asia Pacific
- 3.1. China
- 3.2. Japan
- 3.3. India
- 3.4. Australia
- 3.5. South Korea
- 3.6. Rest of Asia Pacific
-
4. Middle East and Africa
- 4.1. GCC
- 4.2. South Africa
- 4.3. Rest of Middle East and Africa
-
5. South America
- 5.1. Brazil
- 5.2. Argentina
- 5.3. Rest of South America
Pancreatic Cancer Therapeutics & Diagnostics Market REPORT HIGHLIGHTS
| Aspects | Details |
|---|---|
| Study Period | 2019-2033 |
| Base Year | 2024 |
| Estimated Year | 2025 |
| Forecast Period | 2025-2033 |
| Historical Period | 2019-2024 |
| Growth Rate | CAGR of 7.52% from 2019-2033 |
| Segmentation |
|
Table of Contents
- 1. Introduction
- 1.1. Research Scope
- 1.2. Market Segmentation
- 1.3. Research Methodology
- 1.4. Definitions and Assumptions
- 2. Executive Summary
- 2.1. Introduction
- 3. Market Dynamics
- 3.1. Introduction
- 3.2. Market Drivers
- 3.2.1 Increasing Incidence and Prevalence of Pancreatic Cancer; Advancements in Molecular Biology
- 3.2.2 Development of Drugs
- 3.2.3 and Diagnostic Technology
- 3.3. Market Restrains
- 3.3.1. High Costs Associated with Diagnosis and Treatments; Stringent Regularity Guidelines
- 3.4. Market Trends
- 3.4.1. The Chemotherapy Segment is Expected to Witness a Major Share in the Studied Market Over the Forecast Period
- 4. Market Factor Analysis
- 4.1. Porters Five Forces
- 4.2. Supply/Value Chain
- 4.3. PESTEL analysis
- 4.4. Market Entropy
- 4.5. Patent/Trademark Analysis
- 5. Global Pancreatic Cancer Therapeutics & Diagnostics Market Analysis, Insights and Forecast, 2019-2031
- 5.1. Market Analysis, Insights and Forecast - by Type
- 5.1.1. Targeted Therapies
- 5.1.2. Chemotherapy
- 5.1.3. Surgery
- 5.1.4. Other Treatments
- 5.2. Market Analysis, Insights and Forecast - by Diagnostics
- 5.2.1. Imaging
- 5.2.2. Biopsy
- 5.2.3. Endoscopic Ultrasound
- 5.2.4. Other Diagnostics
- 5.3. Market Analysis, Insights and Forecast - by Region
- 5.3.1. North America
- 5.3.2. Europe
- 5.3.3. Asia Pacific
- 5.3.4. Middle East and Africa
- 5.3.5. South America
- 5.1. Market Analysis, Insights and Forecast - by Type
- 6. North America Pancreatic Cancer Therapeutics & Diagnostics Market Analysis, Insights and Forecast, 2019-2031
- 6.1. Market Analysis, Insights and Forecast - by Type
- 6.1.1. Targeted Therapies
- 6.1.2. Chemotherapy
- 6.1.3. Surgery
- 6.1.4. Other Treatments
- 6.2. Market Analysis, Insights and Forecast - by Diagnostics
- 6.2.1. Imaging
- 6.2.2. Biopsy
- 6.2.3. Endoscopic Ultrasound
- 6.2.4. Other Diagnostics
- 6.1. Market Analysis, Insights and Forecast - by Type
- 7. Europe Pancreatic Cancer Therapeutics & Diagnostics Market Analysis, Insights and Forecast, 2019-2031
- 7.1. Market Analysis, Insights and Forecast - by Type
- 7.1.1. Targeted Therapies
- 7.1.2. Chemotherapy
- 7.1.3. Surgery
- 7.1.4. Other Treatments
- 7.2. Market Analysis, Insights and Forecast - by Diagnostics
- 7.2.1. Imaging
- 7.2.2. Biopsy
- 7.2.3. Endoscopic Ultrasound
- 7.2.4. Other Diagnostics
- 7.1. Market Analysis, Insights and Forecast - by Type
- 8. Asia Pacific Pancreatic Cancer Therapeutics & Diagnostics Market Analysis, Insights and Forecast, 2019-2031
- 8.1. Market Analysis, Insights and Forecast - by Type
- 8.1.1. Targeted Therapies
- 8.1.2. Chemotherapy
- 8.1.3. Surgery
- 8.1.4. Other Treatments
- 8.2. Market Analysis, Insights and Forecast - by Diagnostics
- 8.2.1. Imaging
- 8.2.2. Biopsy
- 8.2.3. Endoscopic Ultrasound
- 8.2.4. Other Diagnostics
- 8.1. Market Analysis, Insights and Forecast - by Type
- 9. Middle East and Africa Pancreatic Cancer Therapeutics & Diagnostics Market Analysis, Insights and Forecast, 2019-2031
- 9.1. Market Analysis, Insights and Forecast - by Type
- 9.1.1. Targeted Therapies
- 9.1.2. Chemotherapy
- 9.1.3. Surgery
- 9.1.4. Other Treatments
- 9.2. Market Analysis, Insights and Forecast - by Diagnostics
- 9.2.1. Imaging
- 9.2.2. Biopsy
- 9.2.3. Endoscopic Ultrasound
- 9.2.4. Other Diagnostics
- 9.1. Market Analysis, Insights and Forecast - by Type
- 10. South America Pancreatic Cancer Therapeutics & Diagnostics Market Analysis, Insights and Forecast, 2019-2031
- 10.1. Market Analysis, Insights and Forecast - by Type
- 10.1.1. Targeted Therapies
- 10.1.2. Chemotherapy
- 10.1.3. Surgery
- 10.1.4. Other Treatments
- 10.2. Market Analysis, Insights and Forecast - by Diagnostics
- 10.2.1. Imaging
- 10.2.2. Biopsy
- 10.2.3. Endoscopic Ultrasound
- 10.2.4. Other Diagnostics
- 10.1. Market Analysis, Insights and Forecast - by Type
- 11. North America Pancreatic Cancer Therapeutics & Diagnostics Market Analysis, Insights and Forecast, 2019-2031
- 11.1. Market Analysis, Insights and Forecast - By Country/Sub-region
- 11.1.1 United States
- 11.1.2 Canada
- 11.1.3 Mexico
- 12. Europe Pancreatic Cancer Therapeutics & Diagnostics Market Analysis, Insights and Forecast, 2019-2031
- 12.1. Market Analysis, Insights and Forecast - By Country/Sub-region
- 12.1.1 United Kingdom
- 12.1.2 Germany
- 12.1.3 France
- 12.1.4 Italy
- 12.1.5 Spain
- 12.1.6 Rest of Europe
- 13. Asia Pacific Pancreatic Cancer Therapeutics & Diagnostics Market Analysis, Insights and Forecast, 2019-2031
- 13.1. Market Analysis, Insights and Forecast - By Country/Sub-region
- 13.1.1 China
- 13.1.2 Japan
- 13.1.3 India
- 13.1.4 Australia
- 13.1.5 South Korea
- 13.1.6 Rest of Asia Pacific
- 14. Middle East and Africa Pancreatic Cancer Therapeutics & Diagnostics Market Analysis, Insights and Forecast, 2019-2031
- 14.1. Market Analysis, Insights and Forecast - By Country/Sub-region
- 14.1.1 GCC
- 14.1.2 South Africa
- 14.1.3 Rest of Middle East and Africa
- 15. South America Pancreatic Cancer Therapeutics & Diagnostics Market Analysis, Insights and Forecast, 2019-2031
- 15.1. Market Analysis, Insights and Forecast - By Country/Sub-region
- 15.1.1 Brazil
- 15.1.2 Argentina
- 15.1.3 Rest of South America
- 16. Competitive Analysis
- 16.1. Global Market Share Analysis 2024
- 16.2. Company Profiles
- 16.2.1 Pfizer Inc
- 16.2.1.1. Overview
- 16.2.1.2. Products
- 16.2.1.3. SWOT Analysis
- 16.2.1.4. Recent Developments
- 16.2.1.5. Financials (Based on Availability)
- 16.2.2 Rafael Holdings Inc (rafael Pharmaceuticals)
- 16.2.2.1. Overview
- 16.2.2.2. Products
- 16.2.2.3. SWOT Analysis
- 16.2.2.4. Recent Developments
- 16.2.2.5. Financials (Based on Availability)
- 16.2.3 Myriad Genetics Inc
- 16.2.3.1. Overview
- 16.2.3.2. Products
- 16.2.3.3. SWOT Analysis
- 16.2.3.4. Recent Developments
- 16.2.3.5. Financials (Based on Availability)
- 16.2.4 Apexigen Inc
- 16.2.4.1. Overview
- 16.2.4.2. Products
- 16.2.4.3. SWOT Analysis
- 16.2.4.4. Recent Developments
- 16.2.4.5. Financials (Based on Availability)
- 16.2.5 Merck KGaA
- 16.2.5.1. Overview
- 16.2.5.2. Products
- 16.2.5.3. SWOT Analysis
- 16.2.5.4. Recent Developments
- 16.2.5.5. Financials (Based on Availability)
- 16.2.6 Immunovia AB
- 16.2.6.1. Overview
- 16.2.6.2. Products
- 16.2.6.3. SWOT Analysis
- 16.2.6.4. Recent Developments
- 16.2.6.5. Financials (Based on Availability)
- 16.2.7 Novartis AG
- 16.2.7.1. Overview
- 16.2.7.2. Products
- 16.2.7.3. SWOT Analysis
- 16.2.7.4. Recent Developments
- 16.2.7.5. Financials (Based on Availability)
- 16.2.8 Amgen Inc
- 16.2.8.1. Overview
- 16.2.8.2. Products
- 16.2.8.3. SWOT Analysis
- 16.2.8.4. Recent Developments
- 16.2.8.5. Financials (Based on Availability)
- 16.2.9 Viatris Inc
- 16.2.9.1. Overview
- 16.2.9.2. Products
- 16.2.9.3. SWOT Analysis
- 16.2.9.4. Recent Developments
- 16.2.9.5. Financials (Based on Availability)
- 16.2.10 AstraZeneca PLC
- 16.2.10.1. Overview
- 16.2.10.2. Products
- 16.2.10.3. SWOT Analysis
- 16.2.10.4. Recent Developments
- 16.2.10.5. Financials (Based on Availability)
- 16.2.11 Canon Inc (canon Medical Systems Corporation)
- 16.2.11.1. Overview
- 16.2.11.2. Products
- 16.2.11.3. SWOT Analysis
- 16.2.11.4. Recent Developments
- 16.2.11.5. Financials (Based on Availability)
- 16.2.12 FUJIFILM Holdings Corporation
- 16.2.12.1. Overview
- 16.2.12.2. Products
- 16.2.12.3. SWOT Analysis
- 16.2.12.4. Recent Developments
- 16.2.12.5. Financials (Based on Availability)
- 16.2.13 F Hoffmann-La Roche AG
- 16.2.13.1. Overview
- 16.2.13.2. Products
- 16.2.13.3. SWOT Analysis
- 16.2.13.4. Recent Developments
- 16.2.13.5. Financials (Based on Availability)
- 16.2.14 Boston Scientific Corporation
- 16.2.14.1. Overview
- 16.2.14.2. Products
- 16.2.14.3. SWOT Analysis
- 16.2.14.4. Recent Developments
- 16.2.14.5. Financials (Based on Availability)
- 16.2.15 Bristol-Myers Squibb Company
- 16.2.15.1. Overview
- 16.2.15.2. Products
- 16.2.15.3. SWOT Analysis
- 16.2.15.4. Recent Developments
- 16.2.15.5. Financials (Based on Availability)
- 16.2.1 Pfizer Inc
List of Figures
- Figure 1: Global Pancreatic Cancer Therapeutics & Diagnostics Market Revenue Breakdown (Million, %) by Region 2024 & 2032
- Figure 2: Global Pancreatic Cancer Therapeutics & Diagnostics Market Volume Breakdown (K Unit, %) by Region 2024 & 2032
- Figure 3: North America Pancreatic Cancer Therapeutics & Diagnostics Market Revenue (Million), by Country 2024 & 2032
- Figure 4: North America Pancreatic Cancer Therapeutics & Diagnostics Market Volume (K Unit), by Country 2024 & 2032
- Figure 5: North America Pancreatic Cancer Therapeutics & Diagnostics Market Revenue Share (%), by Country 2024 & 2032
- Figure 6: North America Pancreatic Cancer Therapeutics & Diagnostics Market Volume Share (%), by Country 2024 & 2032
- Figure 7: Europe Pancreatic Cancer Therapeutics & Diagnostics Market Revenue (Million), by Country 2024 & 2032
- Figure 8: Europe Pancreatic Cancer Therapeutics & Diagnostics Market Volume (K Unit), by Country 2024 & 2032
- Figure 9: Europe Pancreatic Cancer Therapeutics & Diagnostics Market Revenue Share (%), by Country 2024 & 2032
- Figure 10: Europe Pancreatic Cancer Therapeutics & Diagnostics Market Volume Share (%), by Country 2024 & 2032
- Figure 11: Asia Pacific Pancreatic Cancer Therapeutics & Diagnostics Market Revenue (Million), by Country 2024 & 2032
- Figure 12: Asia Pacific Pancreatic Cancer Therapeutics & Diagnostics Market Volume (K Unit), by Country 2024 & 2032
- Figure 13: Asia Pacific Pancreatic Cancer Therapeutics & Diagnostics Market Revenue Share (%), by Country 2024 & 2032
- Figure 14: Asia Pacific Pancreatic Cancer Therapeutics & Diagnostics Market Volume Share (%), by Country 2024 & 2032
- Figure 15: Middle East and Africa Pancreatic Cancer Therapeutics & Diagnostics Market Revenue (Million), by Country 2024 & 2032
- Figure 16: Middle East and Africa Pancreatic Cancer Therapeutics & Diagnostics Market Volume (K Unit), by Country 2024 & 2032
- Figure 17: Middle East and Africa Pancreatic Cancer Therapeutics & Diagnostics Market Revenue Share (%), by Country 2024 & 2032
- Figure 18: Middle East and Africa Pancreatic Cancer Therapeutics & Diagnostics Market Volume Share (%), by Country 2024 & 2032
- Figure 19: South America Pancreatic Cancer Therapeutics & Diagnostics Market Revenue (Million), by Country 2024 & 2032
- Figure 20: South America Pancreatic Cancer Therapeutics & Diagnostics Market Volume (K Unit), by Country 2024 & 2032
- Figure 21: South America Pancreatic Cancer Therapeutics & Diagnostics Market Revenue Share (%), by Country 2024 & 2032
- Figure 22: South America Pancreatic Cancer Therapeutics & Diagnostics Market Volume Share (%), by Country 2024 & 2032
- Figure 23: North America Pancreatic Cancer Therapeutics & Diagnostics Market Revenue (Million), by Type 2024 & 2032
- Figure 24: North America Pancreatic Cancer Therapeutics & Diagnostics Market Volume (K Unit), by Type 2024 & 2032
- Figure 25: North America Pancreatic Cancer Therapeutics & Diagnostics Market Revenue Share (%), by Type 2024 & 2032
- Figure 26: North America Pancreatic Cancer Therapeutics & Diagnostics Market Volume Share (%), by Type 2024 & 2032
- Figure 27: North America Pancreatic Cancer Therapeutics & Diagnostics Market Revenue (Million), by Diagnostics 2024 & 2032
- Figure 28: North America Pancreatic Cancer Therapeutics & Diagnostics Market Volume (K Unit), by Diagnostics 2024 & 2032
- Figure 29: North America Pancreatic Cancer Therapeutics & Diagnostics Market Revenue Share (%), by Diagnostics 2024 & 2032
- Figure 30: North America Pancreatic Cancer Therapeutics & Diagnostics Market Volume Share (%), by Diagnostics 2024 & 2032
- Figure 31: North America Pancreatic Cancer Therapeutics & Diagnostics Market Revenue (Million), by Country 2024 & 2032
- Figure 32: North America Pancreatic Cancer Therapeutics & Diagnostics Market Volume (K Unit), by Country 2024 & 2032
- Figure 33: North America Pancreatic Cancer Therapeutics & Diagnostics Market Revenue Share (%), by Country 2024 & 2032
- Figure 34: North America Pancreatic Cancer Therapeutics & Diagnostics Market Volume Share (%), by Country 2024 & 2032
- Figure 35: Europe Pancreatic Cancer Therapeutics & Diagnostics Market Revenue (Million), by Type 2024 & 2032
- Figure 36: Europe Pancreatic Cancer Therapeutics & Diagnostics Market Volume (K Unit), by Type 2024 & 2032
- Figure 37: Europe Pancreatic Cancer Therapeutics & Diagnostics Market Revenue Share (%), by Type 2024 & 2032
- Figure 38: Europe Pancreatic Cancer Therapeutics & Diagnostics Market Volume Share (%), by Type 2024 & 2032
- Figure 39: Europe Pancreatic Cancer Therapeutics & Diagnostics Market Revenue (Million), by Diagnostics 2024 & 2032
- Figure 40: Europe Pancreatic Cancer Therapeutics & Diagnostics Market Volume (K Unit), by Diagnostics 2024 & 2032
- Figure 41: Europe Pancreatic Cancer Therapeutics & Diagnostics Market Revenue Share (%), by Diagnostics 2024 & 2032
- Figure 42: Europe Pancreatic Cancer Therapeutics & Diagnostics Market Volume Share (%), by Diagnostics 2024 & 2032
- Figure 43: Europe Pancreatic Cancer Therapeutics & Diagnostics Market Revenue (Million), by Country 2024 & 2032
- Figure 44: Europe Pancreatic Cancer Therapeutics & Diagnostics Market Volume (K Unit), by Country 2024 & 2032
- Figure 45: Europe Pancreatic Cancer Therapeutics & Diagnostics Market Revenue Share (%), by Country 2024 & 2032
- Figure 46: Europe Pancreatic Cancer Therapeutics & Diagnostics Market Volume Share (%), by Country 2024 & 2032
- Figure 47: Asia Pacific Pancreatic Cancer Therapeutics & Diagnostics Market Revenue (Million), by Type 2024 & 2032
- Figure 48: Asia Pacific Pancreatic Cancer Therapeutics & Diagnostics Market Volume (K Unit), by Type 2024 & 2032
- Figure 49: Asia Pacific Pancreatic Cancer Therapeutics & Diagnostics Market Revenue Share (%), by Type 2024 & 2032
- Figure 50: Asia Pacific Pancreatic Cancer Therapeutics & Diagnostics Market Volume Share (%), by Type 2024 & 2032
- Figure 51: Asia Pacific Pancreatic Cancer Therapeutics & Diagnostics Market Revenue (Million), by Diagnostics 2024 & 2032
- Figure 52: Asia Pacific Pancreatic Cancer Therapeutics & Diagnostics Market Volume (K Unit), by Diagnostics 2024 & 2032
- Figure 53: Asia Pacific Pancreatic Cancer Therapeutics & Diagnostics Market Revenue Share (%), by Diagnostics 2024 & 2032
- Figure 54: Asia Pacific Pancreatic Cancer Therapeutics & Diagnostics Market Volume Share (%), by Diagnostics 2024 & 2032
- Figure 55: Asia Pacific Pancreatic Cancer Therapeutics & Diagnostics Market Revenue (Million), by Country 2024 & 2032
- Figure 56: Asia Pacific Pancreatic Cancer Therapeutics & Diagnostics Market Volume (K Unit), by Country 2024 & 2032
- Figure 57: Asia Pacific Pancreatic Cancer Therapeutics & Diagnostics Market Revenue Share (%), by Country 2024 & 2032
- Figure 58: Asia Pacific Pancreatic Cancer Therapeutics & Diagnostics Market Volume Share (%), by Country 2024 & 2032
- Figure 59: Middle East and Africa Pancreatic Cancer Therapeutics & Diagnostics Market Revenue (Million), by Type 2024 & 2032
- Figure 60: Middle East and Africa Pancreatic Cancer Therapeutics & Diagnostics Market Volume (K Unit), by Type 2024 & 2032
- Figure 61: Middle East and Africa Pancreatic Cancer Therapeutics & Diagnostics Market Revenue Share (%), by Type 2024 & 2032
- Figure 62: Middle East and Africa Pancreatic Cancer Therapeutics & Diagnostics Market Volume Share (%), by Type 2024 & 2032
- Figure 63: Middle East and Africa Pancreatic Cancer Therapeutics & Diagnostics Market Revenue (Million), by Diagnostics 2024 & 2032
- Figure 64: Middle East and Africa Pancreatic Cancer Therapeutics & Diagnostics Market Volume (K Unit), by Diagnostics 2024 & 2032
- Figure 65: Middle East and Africa Pancreatic Cancer Therapeutics & Diagnostics Market Revenue Share (%), by Diagnostics 2024 & 2032
- Figure 66: Middle East and Africa Pancreatic Cancer Therapeutics & Diagnostics Market Volume Share (%), by Diagnostics 2024 & 2032
- Figure 67: Middle East and Africa Pancreatic Cancer Therapeutics & Diagnostics Market Revenue (Million), by Country 2024 & 2032
- Figure 68: Middle East and Africa Pancreatic Cancer Therapeutics & Diagnostics Market Volume (K Unit), by Country 2024 & 2032
- Figure 69: Middle East and Africa Pancreatic Cancer Therapeutics & Diagnostics Market Revenue Share (%), by Country 2024 & 2032
- Figure 70: Middle East and Africa Pancreatic Cancer Therapeutics & Diagnostics Market Volume Share (%), by Country 2024 & 2032
- Figure 71: South America Pancreatic Cancer Therapeutics & Diagnostics Market Revenue (Million), by Type 2024 & 2032
- Figure 72: South America Pancreatic Cancer Therapeutics & Diagnostics Market Volume (K Unit), by Type 2024 & 2032
- Figure 73: South America Pancreatic Cancer Therapeutics & Diagnostics Market Revenue Share (%), by Type 2024 & 2032
- Figure 74: South America Pancreatic Cancer Therapeutics & Diagnostics Market Volume Share (%), by Type 2024 & 2032
- Figure 75: South America Pancreatic Cancer Therapeutics & Diagnostics Market Revenue (Million), by Diagnostics 2024 & 2032
- Figure 76: South America Pancreatic Cancer Therapeutics & Diagnostics Market Volume (K Unit), by Diagnostics 2024 & 2032
- Figure 77: South America Pancreatic Cancer Therapeutics & Diagnostics Market Revenue Share (%), by Diagnostics 2024 & 2032
- Figure 78: South America Pancreatic Cancer Therapeutics & Diagnostics Market Volume Share (%), by Diagnostics 2024 & 2032
- Figure 79: South America Pancreatic Cancer Therapeutics & Diagnostics Market Revenue (Million), by Country 2024 & 2032
- Figure 80: South America Pancreatic Cancer Therapeutics & Diagnostics Market Volume (K Unit), by Country 2024 & 2032
- Figure 81: South America Pancreatic Cancer Therapeutics & Diagnostics Market Revenue Share (%), by Country 2024 & 2032
- Figure 82: South America Pancreatic Cancer Therapeutics & Diagnostics Market Volume Share (%), by Country 2024 & 2032
List of Tables
- Table 1: Global Pancreatic Cancer Therapeutics & Diagnostics Market Revenue Million Forecast, by Region 2019 & 2032
- Table 2: Global Pancreatic Cancer Therapeutics & Diagnostics Market Volume K Unit Forecast, by Region 2019 & 2032
- Table 3: Global Pancreatic Cancer Therapeutics & Diagnostics Market Revenue Million Forecast, by Type 2019 & 2032
- Table 4: Global Pancreatic Cancer Therapeutics & Diagnostics Market Volume K Unit Forecast, by Type 2019 & 2032
- Table 5: Global Pancreatic Cancer Therapeutics & Diagnostics Market Revenue Million Forecast, by Diagnostics 2019 & 2032
- Table 6: Global Pancreatic Cancer Therapeutics & Diagnostics Market Volume K Unit Forecast, by Diagnostics 2019 & 2032
- Table 7: Global Pancreatic Cancer Therapeutics & Diagnostics Market Revenue Million Forecast, by Region 2019 & 2032
- Table 8: Global Pancreatic Cancer Therapeutics & Diagnostics Market Volume K Unit Forecast, by Region 2019 & 2032
- Table 9: Global Pancreatic Cancer Therapeutics & Diagnostics Market Revenue Million Forecast, by Country 2019 & 2032
- Table 10: Global Pancreatic Cancer Therapeutics & Diagnostics Market Volume K Unit Forecast, by Country 2019 & 2032
- Table 11: United States Pancreatic Cancer Therapeutics & Diagnostics Market Revenue (Million) Forecast, by Application 2019 & 2032
- Table 12: United States Pancreatic Cancer Therapeutics & Diagnostics Market Volume (K Unit) Forecast, by Application 2019 & 2032
- Table 13: Canada Pancreatic Cancer Therapeutics & Diagnostics Market Revenue (Million) Forecast, by Application 2019 & 2032
- Table 14: Canada Pancreatic Cancer Therapeutics & Diagnostics Market Volume (K Unit) Forecast, by Application 2019 & 2032
- Table 15: Mexico Pancreatic Cancer Therapeutics & Diagnostics Market Revenue (Million) Forecast, by Application 2019 & 2032
- Table 16: Mexico Pancreatic Cancer Therapeutics & Diagnostics Market Volume (K Unit) Forecast, by Application 2019 & 2032
- Table 17: Global Pancreatic Cancer Therapeutics & Diagnostics Market Revenue Million Forecast, by Country 2019 & 2032
- Table 18: Global Pancreatic Cancer Therapeutics & Diagnostics Market Volume K Unit Forecast, by Country 2019 & 2032
- Table 19: United Kingdom Pancreatic Cancer Therapeutics & Diagnostics Market Revenue (Million) Forecast, by Application 2019 & 2032
- Table 20: United Kingdom Pancreatic Cancer Therapeutics & Diagnostics Market Volume (K Unit) Forecast, by Application 2019 & 2032
- Table 21: Germany Pancreatic Cancer Therapeutics & Diagnostics Market Revenue (Million) Forecast, by Application 2019 & 2032
- Table 22: Germany Pancreatic Cancer Therapeutics & Diagnostics Market Volume (K Unit) Forecast, by Application 2019 & 2032
- Table 23: France Pancreatic Cancer Therapeutics & Diagnostics Market Revenue (Million) Forecast, by Application 2019 & 2032
- Table 24: France Pancreatic Cancer Therapeutics & Diagnostics Market Volume (K Unit) Forecast, by Application 2019 & 2032
- Table 25: Italy Pancreatic Cancer Therapeutics & Diagnostics Market Revenue (Million) Forecast, by Application 2019 & 2032
- Table 26: Italy Pancreatic Cancer Therapeutics & Diagnostics Market Volume (K Unit) Forecast, by Application 2019 & 2032
- Table 27: Spain Pancreatic Cancer Therapeutics & Diagnostics Market Revenue (Million) Forecast, by Application 2019 & 2032
- Table 28: Spain Pancreatic Cancer Therapeutics & Diagnostics Market Volume (K Unit) Forecast, by Application 2019 & 2032
- Table 29: Rest of Europe Pancreatic Cancer Therapeutics & Diagnostics Market Revenue (Million) Forecast, by Application 2019 & 2032
- Table 30: Rest of Europe Pancreatic Cancer Therapeutics & Diagnostics Market Volume (K Unit) Forecast, by Application 2019 & 2032
- Table 31: Global Pancreatic Cancer Therapeutics & Diagnostics Market Revenue Million Forecast, by Country 2019 & 2032
- Table 32: Global Pancreatic Cancer Therapeutics & Diagnostics Market Volume K Unit Forecast, by Country 2019 & 2032
- Table 33: China Pancreatic Cancer Therapeutics & Diagnostics Market Revenue (Million) Forecast, by Application 2019 & 2032
- Table 34: China Pancreatic Cancer Therapeutics & Diagnostics Market Volume (K Unit) Forecast, by Application 2019 & 2032
- Table 35: Japan Pancreatic Cancer Therapeutics & Diagnostics Market Revenue (Million) Forecast, by Application 2019 & 2032
- Table 36: Japan Pancreatic Cancer Therapeutics & Diagnostics Market Volume (K Unit) Forecast, by Application 2019 & 2032
- Table 37: India Pancreatic Cancer Therapeutics & Diagnostics Market Revenue (Million) Forecast, by Application 2019 & 2032
- Table 38: India Pancreatic Cancer Therapeutics & Diagnostics Market Volume (K Unit) Forecast, by Application 2019 & 2032
- Table 39: Australia Pancreatic Cancer Therapeutics & Diagnostics Market Revenue (Million) Forecast, by Application 2019 & 2032
- Table 40: Australia Pancreatic Cancer Therapeutics & Diagnostics Market Volume (K Unit) Forecast, by Application 2019 & 2032
- Table 41: South Korea Pancreatic Cancer Therapeutics & Diagnostics Market Revenue (Million) Forecast, by Application 2019 & 2032
- Table 42: South Korea Pancreatic Cancer Therapeutics & Diagnostics Market Volume (K Unit) Forecast, by Application 2019 & 2032
- Table 43: Rest of Asia Pacific Pancreatic Cancer Therapeutics & Diagnostics Market Revenue (Million) Forecast, by Application 2019 & 2032
- Table 44: Rest of Asia Pacific Pancreatic Cancer Therapeutics & Diagnostics Market Volume (K Unit) Forecast, by Application 2019 & 2032
- Table 45: Global Pancreatic Cancer Therapeutics & Diagnostics Market Revenue Million Forecast, by Country 2019 & 2032
- Table 46: Global Pancreatic Cancer Therapeutics & Diagnostics Market Volume K Unit Forecast, by Country 2019 & 2032
- Table 47: GCC Pancreatic Cancer Therapeutics & Diagnostics Market Revenue (Million) Forecast, by Application 2019 & 2032
- Table 48: GCC Pancreatic Cancer Therapeutics & Diagnostics Market Volume (K Unit) Forecast, by Application 2019 & 2032
- Table 49: South Africa Pancreatic Cancer Therapeutics & Diagnostics Market Revenue (Million) Forecast, by Application 2019 & 2032
- Table 50: South Africa Pancreatic Cancer Therapeutics & Diagnostics Market Volume (K Unit) Forecast, by Application 2019 & 2032
- Table 51: Rest of Middle East and Africa Pancreatic Cancer Therapeutics & Diagnostics Market Revenue (Million) Forecast, by Application 2019 & 2032
- Table 52: Rest of Middle East and Africa Pancreatic Cancer Therapeutics & Diagnostics Market Volume (K Unit) Forecast, by Application 2019 & 2032
- Table 53: Global Pancreatic Cancer Therapeutics & Diagnostics Market Revenue Million Forecast, by Country 2019 & 2032
- Table 54: Global Pancreatic Cancer Therapeutics & Diagnostics Market Volume K Unit Forecast, by Country 2019 & 2032
- Table 55: Brazil Pancreatic Cancer Therapeutics & Diagnostics Market Revenue (Million) Forecast, by Application 2019 & 2032
- Table 56: Brazil Pancreatic Cancer Therapeutics & Diagnostics Market Volume (K Unit) Forecast, by Application 2019 & 2032
- Table 57: Argentina Pancreatic Cancer Therapeutics & Diagnostics Market Revenue (Million) Forecast, by Application 2019 & 2032
- Table 58: Argentina Pancreatic Cancer Therapeutics & Diagnostics Market Volume (K Unit) Forecast, by Application 2019 & 2032
- Table 59: Rest of South America Pancreatic Cancer Therapeutics & Diagnostics Market Revenue (Million) Forecast, by Application 2019 & 2032
- Table 60: Rest of South America Pancreatic Cancer Therapeutics & Diagnostics Market Volume (K Unit) Forecast, by Application 2019 & 2032
- Table 61: Global Pancreatic Cancer Therapeutics & Diagnostics Market Revenue Million Forecast, by Type 2019 & 2032
- Table 62: Global Pancreatic Cancer Therapeutics & Diagnostics Market Volume K Unit Forecast, by Type 2019 & 2032
- Table 63: Global Pancreatic Cancer Therapeutics & Diagnostics Market Revenue Million Forecast, by Diagnostics 2019 & 2032
- Table 64: Global Pancreatic Cancer Therapeutics & Diagnostics Market Volume K Unit Forecast, by Diagnostics 2019 & 2032
- Table 65: Global Pancreatic Cancer Therapeutics & Diagnostics Market Revenue Million Forecast, by Country 2019 & 2032
- Table 66: Global Pancreatic Cancer Therapeutics & Diagnostics Market Volume K Unit Forecast, by Country 2019 & 2032
- Table 67: United States Pancreatic Cancer Therapeutics & Diagnostics Market Revenue (Million) Forecast, by Application 2019 & 2032
- Table 68: United States Pancreatic Cancer Therapeutics & Diagnostics Market Volume (K Unit) Forecast, by Application 2019 & 2032
- Table 69: Canada Pancreatic Cancer Therapeutics & Diagnostics Market Revenue (Million) Forecast, by Application 2019 & 2032
- Table 70: Canada Pancreatic Cancer Therapeutics & Diagnostics Market Volume (K Unit) Forecast, by Application 2019 & 2032
- Table 71: Mexico Pancreatic Cancer Therapeutics & Diagnostics Market Revenue (Million) Forecast, by Application 2019 & 2032
- Table 72: Mexico Pancreatic Cancer Therapeutics & Diagnostics Market Volume (K Unit) Forecast, by Application 2019 & 2032
- Table 73: Global Pancreatic Cancer Therapeutics & Diagnostics Market Revenue Million Forecast, by Type 2019 & 2032
- Table 74: Global Pancreatic Cancer Therapeutics & Diagnostics Market Volume K Unit Forecast, by Type 2019 & 2032
- Table 75: Global Pancreatic Cancer Therapeutics & Diagnostics Market Revenue Million Forecast, by Diagnostics 2019 & 2032
- Table 76: Global Pancreatic Cancer Therapeutics & Diagnostics Market Volume K Unit Forecast, by Diagnostics 2019 & 2032
- Table 77: Global Pancreatic Cancer Therapeutics & Diagnostics Market Revenue Million Forecast, by Country 2019 & 2032
- Table 78: Global Pancreatic Cancer Therapeutics & Diagnostics Market Volume K Unit Forecast, by Country 2019 & 2032
- Table 79: United Kingdom Pancreatic Cancer Therapeutics & Diagnostics Market Revenue (Million) Forecast, by Application 2019 & 2032
- Table 80: United Kingdom Pancreatic Cancer Therapeutics & Diagnostics Market Volume (K Unit) Forecast, by Application 2019 & 2032
- Table 81: Germany Pancreatic Cancer Therapeutics & Diagnostics Market Revenue (Million) Forecast, by Application 2019 & 2032
- Table 82: Germany Pancreatic Cancer Therapeutics & Diagnostics Market Volume (K Unit) Forecast, by Application 2019 & 2032
- Table 83: France Pancreatic Cancer Therapeutics & Diagnostics Market Revenue (Million) Forecast, by Application 2019 & 2032
- Table 84: France Pancreatic Cancer Therapeutics & Diagnostics Market Volume (K Unit) Forecast, by Application 2019 & 2032
- Table 85: Italy Pancreatic Cancer Therapeutics & Diagnostics Market Revenue (Million) Forecast, by Application 2019 & 2032
- Table 86: Italy Pancreatic Cancer Therapeutics & Diagnostics Market Volume (K Unit) Forecast, by Application 2019 & 2032
- Table 87: Spain Pancreatic Cancer Therapeutics & Diagnostics Market Revenue (Million) Forecast, by Application 2019 & 2032
- Table 88: Spain Pancreatic Cancer Therapeutics & Diagnostics Market Volume (K Unit) Forecast, by Application 2019 & 2032
- Table 89: Rest of Europe Pancreatic Cancer Therapeutics & Diagnostics Market Revenue (Million) Forecast, by Application 2019 & 2032
- Table 90: Rest of Europe Pancreatic Cancer Therapeutics & Diagnostics Market Volume (K Unit) Forecast, by Application 2019 & 2032
- Table 91: Global Pancreatic Cancer Therapeutics & Diagnostics Market Revenue Million Forecast, by Type 2019 & 2032
- Table 92: Global Pancreatic Cancer Therapeutics & Diagnostics Market Volume K Unit Forecast, by Type 2019 & 2032
- Table 93: Global Pancreatic Cancer Therapeutics & Diagnostics Market Revenue Million Forecast, by Diagnostics 2019 & 2032
- Table 94: Global Pancreatic Cancer Therapeutics & Diagnostics Market Volume K Unit Forecast, by Diagnostics 2019 & 2032
- Table 95: Global Pancreatic Cancer Therapeutics & Diagnostics Market Revenue Million Forecast, by Country 2019 & 2032
- Table 96: Global Pancreatic Cancer Therapeutics & Diagnostics Market Volume K Unit Forecast, by Country 2019 & 2032
- Table 97: China Pancreatic Cancer Therapeutics & Diagnostics Market Revenue (Million) Forecast, by Application 2019 & 2032
- Table 98: China Pancreatic Cancer Therapeutics & Diagnostics Market Volume (K Unit) Forecast, by Application 2019 & 2032
- Table 99: Japan Pancreatic Cancer Therapeutics & Diagnostics Market Revenue (Million) Forecast, by Application 2019 & 2032
- Table 100: Japan Pancreatic Cancer Therapeutics & Diagnostics Market Volume (K Unit) Forecast, by Application 2019 & 2032
- Table 101: India Pancreatic Cancer Therapeutics & Diagnostics Market Revenue (Million) Forecast, by Application 2019 & 2032
- Table 102: India Pancreatic Cancer Therapeutics & Diagnostics Market Volume (K Unit) Forecast, by Application 2019 & 2032
- Table 103: Australia Pancreatic Cancer Therapeutics & Diagnostics Market Revenue (Million) Forecast, by Application 2019 & 2032
- Table 104: Australia Pancreatic Cancer Therapeutics & Diagnostics Market Volume (K Unit) Forecast, by Application 2019 & 2032
- Table 105: South Korea Pancreatic Cancer Therapeutics & Diagnostics Market Revenue (Million) Forecast, by Application 2019 & 2032
- Table 106: South Korea Pancreatic Cancer Therapeutics & Diagnostics Market Volume (K Unit) Forecast, by Application 2019 & 2032
- Table 107: Rest of Asia Pacific Pancreatic Cancer Therapeutics & Diagnostics Market Revenue (Million) Forecast, by Application 2019 & 2032
- Table 108: Rest of Asia Pacific Pancreatic Cancer Therapeutics & Diagnostics Market Volume (K Unit) Forecast, by Application 2019 & 2032
- Table 109: Global Pancreatic Cancer Therapeutics & Diagnostics Market Revenue Million Forecast, by Type 2019 & 2032
- Table 110: Global Pancreatic Cancer Therapeutics & Diagnostics Market Volume K Unit Forecast, by Type 2019 & 2032
- Table 111: Global Pancreatic Cancer Therapeutics & Diagnostics Market Revenue Million Forecast, by Diagnostics 2019 & 2032
- Table 112: Global Pancreatic Cancer Therapeutics & Diagnostics Market Volume K Unit Forecast, by Diagnostics 2019 & 2032
- Table 113: Global Pancreatic Cancer Therapeutics & Diagnostics Market Revenue Million Forecast, by Country 2019 & 2032
- Table 114: Global Pancreatic Cancer Therapeutics & Diagnostics Market Volume K Unit Forecast, by Country 2019 & 2032
- Table 115: GCC Pancreatic Cancer Therapeutics & Diagnostics Market Revenue (Million) Forecast, by Application 2019 & 2032
- Table 116: GCC Pancreatic Cancer Therapeutics & Diagnostics Market Volume (K Unit) Forecast, by Application 2019 & 2032
- Table 117: South Africa Pancreatic Cancer Therapeutics & Diagnostics Market Revenue (Million) Forecast, by Application 2019 & 2032
- Table 118: South Africa Pancreatic Cancer Therapeutics & Diagnostics Market Volume (K Unit) Forecast, by Application 2019 & 2032
- Table 119: Rest of Middle East and Africa Pancreatic Cancer Therapeutics & Diagnostics Market Revenue (Million) Forecast, by Application 2019 & 2032
- Table 120: Rest of Middle East and Africa Pancreatic Cancer Therapeutics & Diagnostics Market Volume (K Unit) Forecast, by Application 2019 & 2032
- Table 121: Global Pancreatic Cancer Therapeutics & Diagnostics Market Revenue Million Forecast, by Type 2019 & 2032
- Table 122: Global Pancreatic Cancer Therapeutics & Diagnostics Market Volume K Unit Forecast, by Type 2019 & 2032
- Table 123: Global Pancreatic Cancer Therapeutics & Diagnostics Market Revenue Million Forecast, by Diagnostics 2019 & 2032
- Table 124: Global Pancreatic Cancer Therapeutics & Diagnostics Market Volume K Unit Forecast, by Diagnostics 2019 & 2032
- Table 125: Global Pancreatic Cancer Therapeutics & Diagnostics Market Revenue Million Forecast, by Country 2019 & 2032
- Table 126: Global Pancreatic Cancer Therapeutics & Diagnostics Market Volume K Unit Forecast, by Country 2019 & 2032
- Table 127: Brazil Pancreatic Cancer Therapeutics & Diagnostics Market Revenue (Million) Forecast, by Application 2019 & 2032
- Table 128: Brazil Pancreatic Cancer Therapeutics & Diagnostics Market Volume (K Unit) Forecast, by Application 2019 & 2032
- Table 129: Argentina Pancreatic Cancer Therapeutics & Diagnostics Market Revenue (Million) Forecast, by Application 2019 & 2032
- Table 130: Argentina Pancreatic Cancer Therapeutics & Diagnostics Market Volume (K Unit) Forecast, by Application 2019 & 2032
- Table 131: Rest of South America Pancreatic Cancer Therapeutics & Diagnostics Market Revenue (Million) Forecast, by Application 2019 & 2032
- Table 132: Rest of South America Pancreatic Cancer Therapeutics & Diagnostics Market Volume (K Unit) Forecast, by Application 2019 & 2032
Frequently Asked Questions
1. What is the projected Compound Annual Growth Rate (CAGR) of the Pancreatic Cancer Therapeutics & Diagnostics Market?
The projected CAGR is approximately 7.52%.
2. Which companies are prominent players in the Pancreatic Cancer Therapeutics & Diagnostics Market?
Key companies in the market include Pfizer Inc, Rafael Holdings Inc (rafael Pharmaceuticals), Myriad Genetics Inc, Apexigen Inc, Merck KGaA, Immunovia AB, Novartis AG, Amgen Inc, Viatris Inc, AstraZeneca PLC, Canon Inc (canon Medical Systems Corporation), FUJIFILM Holdings Corporation, F Hoffmann-La Roche AG, Boston Scientific Corporation, Bristol-Myers Squibb Company.
3. What are the main segments of the Pancreatic Cancer Therapeutics & Diagnostics Market?
The market segments include Type, Diagnostics .
4. Can you provide details about the market size?
The market size is estimated to be USD 4.56 Million as of 2022.
5. What are some drivers contributing to market growth?
Increasing Incidence and Prevalence of Pancreatic Cancer; Advancements in Molecular Biology. Development of Drugs. and Diagnostic Technology.
6. What are the notable trends driving market growth?
The Chemotherapy Segment is Expected to Witness a Major Share in the Studied Market Over the Forecast Period.
7. Are there any restraints impacting market growth?
High Costs Associated with Diagnosis and Treatments; Stringent Regularity Guidelines.
8. Can you provide examples of recent developments in the market?
N/A
9. What pricing options are available for accessing the report?
Pricing options include single-user, multi-user, and enterprise licenses priced at USD 4750, USD 5250, and USD 8750 respectively.
10. Is the market size provided in terms of value or volume?
The market size is provided in terms of value, measured in Million and volume, measured in K Unit.
11. Are there any specific market keywords associated with the report?
Yes, the market keyword associated with the report is "Pancreatic Cancer Therapeutics & Diagnostics Market," which aids in identifying and referencing the specific market segment covered.
12. How do I determine which pricing option suits my needs best?
The pricing options vary based on user requirements and access needs. Individual users may opt for single-user licenses, while businesses requiring broader access may choose multi-user or enterprise licenses for cost-effective access to the report.
13. Are there any additional resources or data provided in the Pancreatic Cancer Therapeutics & Diagnostics Market report?
While the report offers comprehensive insights, it's advisable to review the specific contents or supplementary materials provided to ascertain if additional resources or data are available.
14. How can I stay updated on further developments or reports in the Pancreatic Cancer Therapeutics & Diagnostics Market?
To stay informed about further developments, trends, and reports in the Pancreatic Cancer Therapeutics & Diagnostics Market, consider subscribing to industry newsletters, following relevant companies and organizations, or regularly checking reputable industry news sources and publications.
Methodology
Step 1 - Identification of Relevant Samples Size from Population Database


Step 2 - Approaches for Defining Global Market Size (Value, Volume* & Price*)

Note*: In applicable scenarios
Step 3 - Data Sources
Primary Research
- Web Analytics
- Survey Reports
- Research Institute
- Latest Research Reports
- Opinion Leaders
Secondary Research
- Annual Reports
- White Paper
- Latest Press Release
- Industry Association
- Paid Database
- Investor Presentations

Step 4 - Data Triangulation
Involves using different sources of information in order to increase the validity of a study
These sources are likely to be stakeholders in a program - participants, other researchers, program staff, other community members, and so on.
Then we put all data in single framework & apply various statistical tools to find out the dynamic on the market.
During the analysis stage, feedback from the stakeholder groups would be compared to determine areas of agreement as well as areas of divergence
