

Key Insights
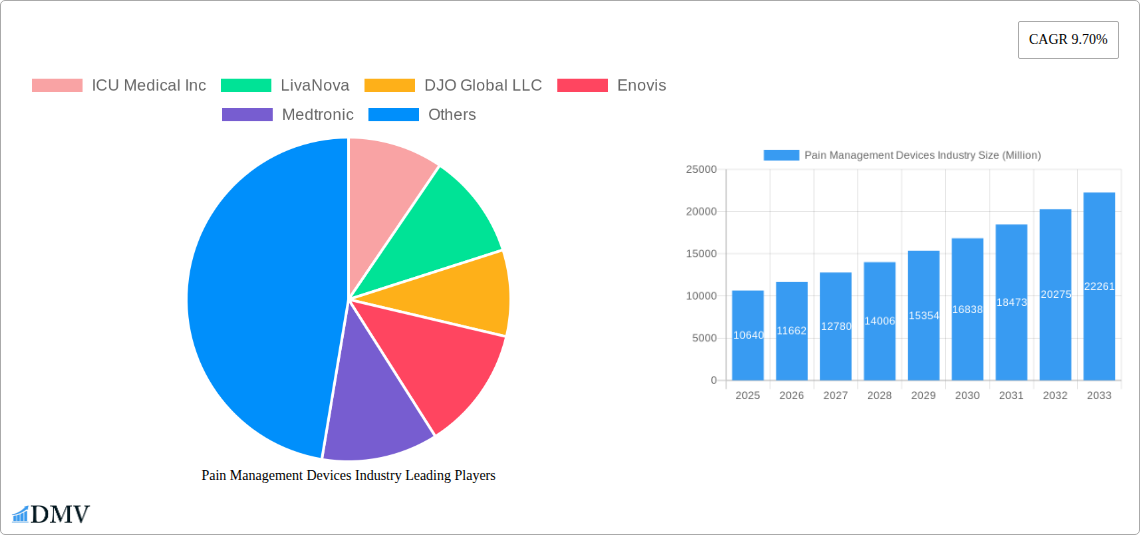
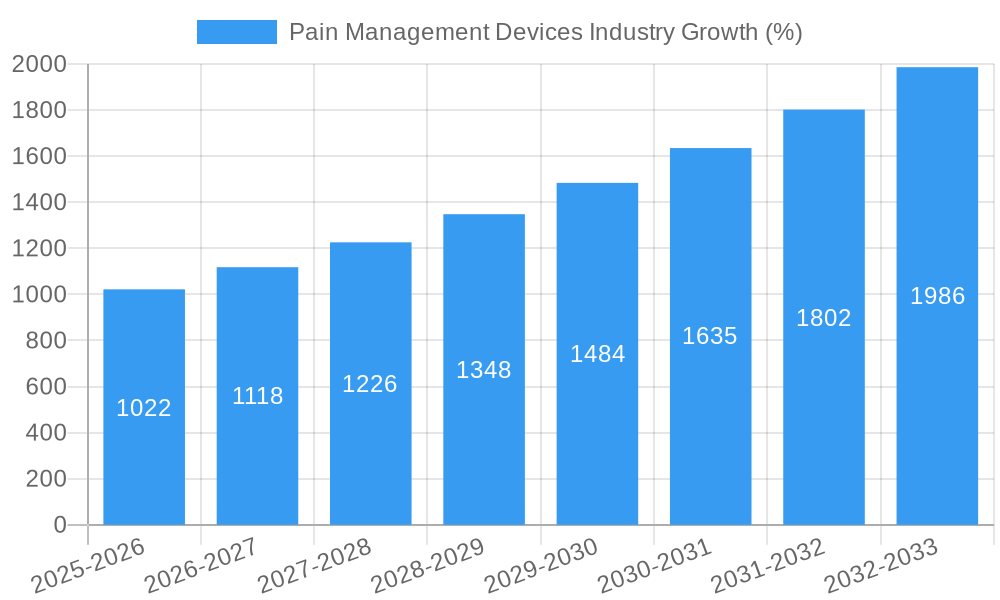
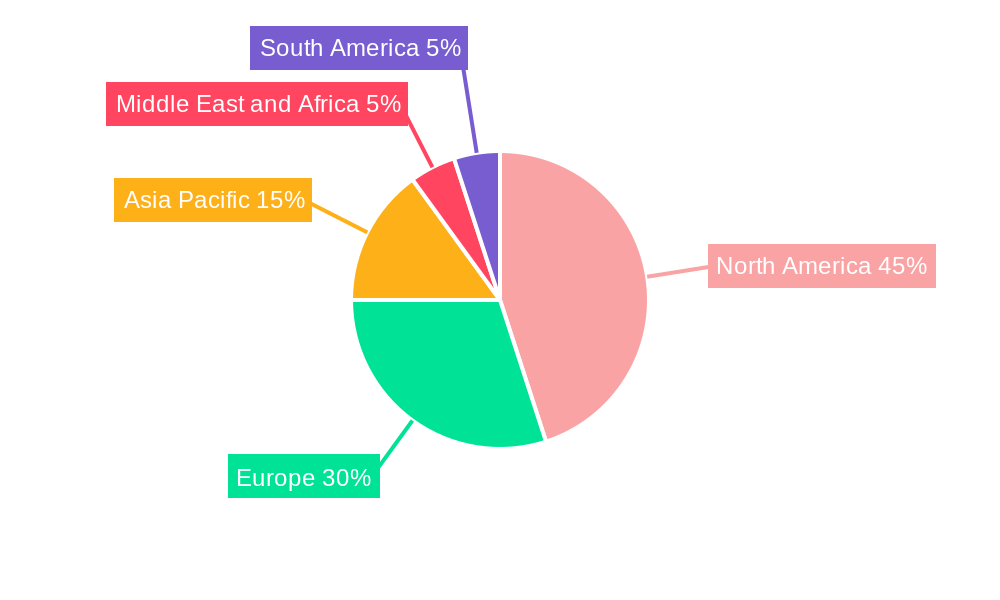
The global pain management devices market, valued at $10.64 billion in 2025, is projected to experience robust growth, driven by a rising elderly population, increasing prevalence of chronic pain conditions (like musculoskeletal disorders, cancer pain, and neuropathic pain), and advancements in minimally invasive procedures. The market's Compound Annual Growth Rate (CAGR) of 9.70% from 2019 to 2024 suggests a significant expansion through 2033. Key growth drivers include technological innovations leading to more effective and less invasive pain management solutions, such as advanced neurostimulation devices and minimally invasive ablation techniques. The increasing adoption of these devices in hospitals and physiotherapy centers, coupled with the rising awareness and demand for improved pain management, fuels market expansion. However, factors like the high cost of advanced pain management devices and potential side effects associated with certain procedures may act as restraints. Market segmentation reveals strong growth prospects across various product types (neurostimulation devices, infusion pumps, ablation devices) and applications (musculoskeletal, cancer pain, neuropathic pain, facial pain, and migraine). North America and Europe currently dominate the market, but the Asia Pacific region is expected to witness significant growth due to increasing healthcare spending and rising prevalence of chronic pain. Leading companies like Medtronic, Boston Scientific, and Stryker are actively investing in research and development to maintain their market leadership through innovation and strategic acquisitions.
The forecast period (2025-2033) anticipates sustained growth, influenced by factors such as the increasing adoption of personalized medicine approaches in pain management, the development of less invasive and more targeted therapies, and the growing demand for home-based pain management solutions. This trend reflects a shift towards patient-centric care, improved healthcare access, and technological advancements. Competitive intensity is expected to remain high, with companies focusing on product differentiation, strategic partnerships, and expanding their geographical reach to capture market share. Further growth potential lies in the development of novel pain management devices, including those incorporating artificial intelligence and machine learning for better diagnosis and personalized treatment. The market's future trajectory depends on continued technological advancements, regulatory approvals, and reimbursement policies affecting accessibility and affordability of these devices.
Pain Management Devices Industry: Market Analysis and Forecast (2019-2033)
This comprehensive report provides an in-depth analysis of the Pain Management Devices industry, offering valuable insights for stakeholders seeking to understand market dynamics, key players, and future growth potential. The report covers the period from 2019 to 2033, with 2025 serving as the base and estimated year. The detailed analysis encompasses market segmentation by product type, application, and end-user, coupled with a meticulous examination of industry trends and leading companies. The global market value is projected to reach xx Million by 2033.
Pain Management Devices Industry Market Composition & Trends
The Pain Management Devices market is characterized by a moderately concentrated landscape with key players like Medtronic, Boston Scientific Corporation, and Stryker holding significant market share. However, the market also exhibits considerable dynamism fueled by ongoing technological innovation, particularly in neurostimulation and minimally invasive procedures. Stringent regulatory requirements, particularly concerning safety and efficacy, shape market entry and product development. Substitute therapies, such as medication and physical therapy, exert competitive pressure. The end-user landscape is diverse, encompassing hospitals and clinics, physiotherapy centers, and increasingly, home-based care settings. Significant M&A activity has shaped the market; for instance, xx Million in deals were recorded in 2024 alone, primarily driven by consolidation and expansion into new technologies.
- Market Share Distribution (2024): Medtronic (20%), Boston Scientific (15%), Stryker (12%), Others (53%)
- M&A Activity (2019-2024): Total deal value approximately xx Million.
- Innovation Catalysts: Development of advanced neurostimulation devices, minimally invasive procedures, and remote patient monitoring systems.
- Regulatory Landscape: Stringent regulatory approvals required for new devices and therapies.
Pain Management Devices Industry Industry Evolution
The Pain Management Devices market has witnessed robust growth over the historical period (2019-2024), driven by increasing prevalence of chronic pain conditions, rising geriatric population, and technological advancements. The market experienced a CAGR of xx% during 2019-2024. Technological advancements, such as the development of sophisticated neurostimulation devices and minimally invasive procedures, have significantly enhanced treatment options. Consumer demand is shifting towards personalized, minimally invasive treatments with reduced side effects and improved efficacy. The adoption of advanced technologies like remote patient monitoring is gaining momentum, enhancing patient outcomes and convenience. The market is expected to maintain a steady growth trajectory in the forecast period (2025-2033), with projected CAGR of xx%. Increased focus on personalized medicine and a shift towards outpatient settings will fuel market expansion. The increasing adoption of minimally invasive procedures and implantable devices and development of advanced drug delivery systems are further driving market growth.
Leading Regions, Countries, or Segments in Pain Management Devices Industry
North America currently dominates the Pain Management Devices market, driven by high healthcare expenditure, technological advancements, and strong regulatory support. Within product types, Neurostimulation Devices holds the largest market share due to its effectiveness in treating chronic and neuropathic pain. In terms of applications, Musculoskeletal pain management constitutes the largest segment.
Key Drivers (North America):
- High healthcare expenditure.
- Early adoption of innovative technologies.
- Favorable regulatory environment.
- High prevalence of chronic pain conditions.
Dominance Factors (Neurostimulation Devices):
- Effectiveness in treating chronic pain conditions.
- Technological advancements offering improved efficacy and safety.
- Increasing patient preference for minimally invasive procedures.
Market Dominance (Musculoskeletal Pain Management):
- High prevalence of musculoskeletal disorders.
- Growing awareness of effective treatment options.
- Increasing demand for minimally invasive procedures.
Pain Management Devices Industry Product Innovations
Recent innovations include the development of advanced neurostimulation devices offering personalized therapy options, coupled with sophisticated data analytics for optimal treatment adjustments. Miniaturized and implantable devices are gaining popularity due to their enhanced comfort and portability. The introduction of novel drug delivery systems provides targeted pain relief, reducing systemic side effects. Unique selling propositions focus on improved efficacy, reduced invasiveness, and enhanced patient comfort, coupled with personalized treatment options facilitated by advanced data analytics.
Propelling Factors for Pain Management Devices Industry Growth
Technological advancements in neurostimulation, drug delivery, and minimally invasive procedures are key growth drivers. An aging population and rising prevalence of chronic pain conditions are further boosting market demand. Favorable regulatory environments in developed countries accelerate product approvals and market penetration. The increasing adoption of remote patient monitoring technologies is improving treatment adherence and patient outcomes.
Obstacles in the Pain Management Devices Industry Market
High cost of devices and therapies remains a significant barrier, limiting accessibility for many patients. Stringent regulatory approvals often delay product launches and increase development costs. Supply chain disruptions, especially concerning critical components and raw materials, may impact production and availability. Intense competition among established players and new entrants necessitates continuous innovation to maintain market share.
Future Opportunities in Pain Management Devices Industry
Emerging markets in Asia and Latin America present significant growth potential. Advancements in artificial intelligence (AI) and machine learning (ML) for personalized pain management offer vast opportunities. Further development and integration of remote patient monitoring technologies will improve patient outcomes and reduce healthcare costs. The expansion into new therapeutic applications, such as headache and migraine management, will broaden the market scope.
Major Players in the Pain Management Devices Industry Ecosystem
- ICU Medical Inc
- LivaNova
- DJO Global LLC
- Enovis
- Medtronic
- Baxter
- Stryker
- Abbott
- Boston Scientific Corporation
- Nevro Corp
- Stim Wave LLC
- SPR Therapeutics
Key Developments in Pain Management Devices Industry Industry
- June 2022: Coach Care partners with Nexstim to offer a commercial remote patient monitoring (RPM) and wellness monitoring device for pain management.
- January 2021: Boston Scientific Corporation launches the WaveWriter Alpha, a portfolio of Spinal Cord Stimulator (SCS) systems.
Strategic Pain Management Devices Industry Market Forecast
The Pain Management Devices market is poised for significant growth over the forecast period (2025-2033), driven by technological advancements, increasing prevalence of chronic pain, and expanding adoption of minimally invasive procedures. The continued development of personalized therapy options, coupled with the growing adoption of remote patient monitoring systems, will further fuel market expansion. The emergence of new markets and therapeutic applications presents considerable opportunities for industry players. The market is expected to achieve robust growth, surpassing xx Million by 2033.
Pain Management Devices Industry Segmentation
-
1. Product Type
- 1.1. Neurostimulation Devices
- 1.2. Infusion Pumps
- 1.3. Ablation Devices
-
2. Application
- 2.1. Musculoskeletal
- 2.2. Cancer Pain
- 2.3. Neuropathic Pain
- 2.4. Facial Pain and Migraine
- 2.5. Other
-
3. End-User
- 3.1. Physiotherapy Centers
- 3.2. Hospitals and Clinics
- 3.3. Others
Pain Management Devices Industry Segmentation By Geography
-
1. North America
- 1.1. United States
- 1.2. Canada
- 1.3. Mexico
-
2. Europe
- 2.1. Germany
- 2.2. United Kingdom
- 2.3. France
- 2.4. Italy
- 2.5. Spain
- 2.6. Rest of Europe
-
3. Asia Pacific
- 3.1. China
- 3.2. Japan
- 3.3. India
- 3.4. Australia
- 3.5. South Korea
- 3.6. Rest of Asia Pacific
-
4. Middle East and Africa
- 4.1. GCC
- 4.2. South Africa
- 4.3. Rest of Middle East and Africa
-
5. South America
- 5.1. Brazil
- 5.2. Argentina
- 5.3. Rest of South America
Pain Management Devices Industry REPORT HIGHLIGHTS
| Aspects | Details |
|---|---|
| Study Period | 2019-2033 |
| Base Year | 2024 |
| Estimated Year | 2025 |
| Forecast Period | 2025-2033 |
| Historical Period | 2019-2024 |
| Growth Rate | CAGR of 9.70% from 2019-2033 |
| Segmentation |
|
Table of Contents
- 1. Introduction
- 1.1. Research Scope
- 1.2. Market Segmentation
- 1.3. Research Methodology
- 1.4. Definitions and Assumptions
- 2. Executive Summary
- 2.1. Introduction
- 3. Market Dynamics
- 3.1. Introduction
- 3.2. Market Drivers
- 3.2.1. The advent of Innovative and Technologically Advanced Pain Management Devices; Increase in Adoption of Pain Management Devices; Rise in Geriatric Population
- 3.3. Market Restrains
- 3.3.1. Preferable use of medications for pain management
- 3.4. Market Trends
- 3.4.1. The neuropathic pain management devices segment counted for the largest share of the global market and witness significant growth
- 4. Market Factor Analysis
- 4.1. Porters Five Forces
- 4.2. Supply/Value Chain
- 4.3. PESTEL analysis
- 4.4. Market Entropy
- 4.5. Patent/Trademark Analysis
- 5. Global Pain Management Devices Industry Analysis, Insights and Forecast, 2019-2031
- 5.1. Market Analysis, Insights and Forecast - by Product Type
- 5.1.1. Neurostimulation Devices
- 5.1.2. Infusion Pumps
- 5.1.3. Ablation Devices
- 5.2. Market Analysis, Insights and Forecast - by Application
- 5.2.1. Musculoskeletal
- 5.2.2. Cancer Pain
- 5.2.3. Neuropathic Pain
- 5.2.4. Facial Pain and Migraine
- 5.2.5. Other
- 5.3. Market Analysis, Insights and Forecast - by End-User
- 5.3.1. Physiotherapy Centers
- 5.3.2. Hospitals and Clinics
- 5.3.3. Others
- 5.4. Market Analysis, Insights and Forecast - by Region
- 5.4.1. North America
- 5.4.2. Europe
- 5.4.3. Asia Pacific
- 5.4.4. Middle East and Africa
- 5.4.5. South America
- 5.1. Market Analysis, Insights and Forecast - by Product Type
- 6. North America Pain Management Devices Industry Analysis, Insights and Forecast, 2019-2031
- 6.1. Market Analysis, Insights and Forecast - by Product Type
- 6.1.1. Neurostimulation Devices
- 6.1.2. Infusion Pumps
- 6.1.3. Ablation Devices
- 6.2. Market Analysis, Insights and Forecast - by Application
- 6.2.1. Musculoskeletal
- 6.2.2. Cancer Pain
- 6.2.3. Neuropathic Pain
- 6.2.4. Facial Pain and Migraine
- 6.2.5. Other
- 6.3. Market Analysis, Insights and Forecast - by End-User
- 6.3.1. Physiotherapy Centers
- 6.3.2. Hospitals and Clinics
- 6.3.3. Others
- 6.1. Market Analysis, Insights and Forecast - by Product Type
- 7. Europe Pain Management Devices Industry Analysis, Insights and Forecast, 2019-2031
- 7.1. Market Analysis, Insights and Forecast - by Product Type
- 7.1.1. Neurostimulation Devices
- 7.1.2. Infusion Pumps
- 7.1.3. Ablation Devices
- 7.2. Market Analysis, Insights and Forecast - by Application
- 7.2.1. Musculoskeletal
- 7.2.2. Cancer Pain
- 7.2.3. Neuropathic Pain
- 7.2.4. Facial Pain and Migraine
- 7.2.5. Other
- 7.3. Market Analysis, Insights and Forecast - by End-User
- 7.3.1. Physiotherapy Centers
- 7.3.2. Hospitals and Clinics
- 7.3.3. Others
- 7.1. Market Analysis, Insights and Forecast - by Product Type
- 8. Asia Pacific Pain Management Devices Industry Analysis, Insights and Forecast, 2019-2031
- 8.1. Market Analysis, Insights and Forecast - by Product Type
- 8.1.1. Neurostimulation Devices
- 8.1.2. Infusion Pumps
- 8.1.3. Ablation Devices
- 8.2. Market Analysis, Insights and Forecast - by Application
- 8.2.1. Musculoskeletal
- 8.2.2. Cancer Pain
- 8.2.3. Neuropathic Pain
- 8.2.4. Facial Pain and Migraine
- 8.2.5. Other
- 8.3. Market Analysis, Insights and Forecast - by End-User
- 8.3.1. Physiotherapy Centers
- 8.3.2. Hospitals and Clinics
- 8.3.3. Others
- 8.1. Market Analysis, Insights and Forecast - by Product Type
- 9. Middle East and Africa Pain Management Devices Industry Analysis, Insights and Forecast, 2019-2031
- 9.1. Market Analysis, Insights and Forecast - by Product Type
- 9.1.1. Neurostimulation Devices
- 9.1.2. Infusion Pumps
- 9.1.3. Ablation Devices
- 9.2. Market Analysis, Insights and Forecast - by Application
- 9.2.1. Musculoskeletal
- 9.2.2. Cancer Pain
- 9.2.3. Neuropathic Pain
- 9.2.4. Facial Pain and Migraine
- 9.2.5. Other
- 9.3. Market Analysis, Insights and Forecast - by End-User
- 9.3.1. Physiotherapy Centers
- 9.3.2. Hospitals and Clinics
- 9.3.3. Others
- 9.1. Market Analysis, Insights and Forecast - by Product Type
- 10. South America Pain Management Devices Industry Analysis, Insights and Forecast, 2019-2031
- 10.1. Market Analysis, Insights and Forecast - by Product Type
- 10.1.1. Neurostimulation Devices
- 10.1.2. Infusion Pumps
- 10.1.3. Ablation Devices
- 10.2. Market Analysis, Insights and Forecast - by Application
- 10.2.1. Musculoskeletal
- 10.2.2. Cancer Pain
- 10.2.3. Neuropathic Pain
- 10.2.4. Facial Pain and Migraine
- 10.2.5. Other
- 10.3. Market Analysis, Insights and Forecast - by End-User
- 10.3.1. Physiotherapy Centers
- 10.3.2. Hospitals and Clinics
- 10.3.3. Others
- 10.1. Market Analysis, Insights and Forecast - by Product Type
- 11. North America Pain Management Devices Industry Analysis, Insights and Forecast, 2019-2031
- 11.1. Market Analysis, Insights and Forecast - By Country/Sub-region
- 11.1.1. undefined
- 12. Europe Pain Management Devices Industry Analysis, Insights and Forecast, 2019-2031
- 12.1. Market Analysis, Insights and Forecast - By Country/Sub-region
- 12.1.1. undefined
- 13. Asia Pacific Pain Management Devices Industry Analysis, Insights and Forecast, 2019-2031
- 13.1. Market Analysis, Insights and Forecast - By Country/Sub-region
- 13.1.1. undefined
- 14. Middle East and Africa Pain Management Devices Industry Analysis, Insights and Forecast, 2019-2031
- 14.1. Market Analysis, Insights and Forecast - By Country/Sub-region
- 14.1.1. undefined
- 15. South America Pain Management Devices Industry Analysis, Insights and Forecast, 2019-2031
- 15.1. Market Analysis, Insights and Forecast - By Country/Sub-region
- 15.1.1. undefined
- 16. Competitive Analysis
- 16.1. Global Market Share Analysis 2024
- 16.2. Company Profiles
- 16.2.1 ICU Medical Inc
- 16.2.1.1. Overview
- 16.2.1.2. Products
- 16.2.1.3. SWOT Analysis
- 16.2.1.4. Recent Developments
- 16.2.1.5. Financials (Based on Availability)
- 16.2.2 LivaNova
- 16.2.2.1. Overview
- 16.2.2.2. Products
- 16.2.2.3. SWOT Analysis
- 16.2.2.4. Recent Developments
- 16.2.2.5. Financials (Based on Availability)
- 16.2.3 DJO Global LLC
- 16.2.3.1. Overview
- 16.2.3.2. Products
- 16.2.3.3. SWOT Analysis
- 16.2.3.4. Recent Developments
- 16.2.3.5. Financials (Based on Availability)
- 16.2.4 Enovis
- 16.2.4.1. Overview
- 16.2.4.2. Products
- 16.2.4.3. SWOT Analysis
- 16.2.4.4. Recent Developments
- 16.2.4.5. Financials (Based on Availability)
- 16.2.5 Medtronic
- 16.2.5.1. Overview
- 16.2.5.2. Products
- 16.2.5.3. SWOT Analysis
- 16.2.5.4. Recent Developments
- 16.2.5.5. Financials (Based on Availability)
- 16.2.6 Baxter
- 16.2.6.1. Overview
- 16.2.6.2. Products
- 16.2.6.3. SWOT Analysis
- 16.2.6.4. Recent Developments
- 16.2.6.5. Financials (Based on Availability)
- 16.2.7 Stryker
- 16.2.7.1. Overview
- 16.2.7.2. Products
- 16.2.7.3. SWOT Analysis
- 16.2.7.4. Recent Developments
- 16.2.7.5. Financials (Based on Availability)
- 16.2.8 Abbott
- 16.2.8.1. Overview
- 16.2.8.2. Products
- 16.2.8.3. SWOT Analysis
- 16.2.8.4. Recent Developments
- 16.2.8.5. Financials (Based on Availability)
- 16.2.9 Boston Scientific Corporation
- 16.2.9.1. Overview
- 16.2.9.2. Products
- 16.2.9.3. SWOT Analysis
- 16.2.9.4. Recent Developments
- 16.2.9.5. Financials (Based on Availability)
- 16.2.10 Nevro Cor
- 16.2.10.1. Overview
- 16.2.10.2. Products
- 16.2.10.3. SWOT Analysis
- 16.2.10.4. Recent Developments
- 16.2.10.5. Financials (Based on Availability)
- 16.2.11 Stim Wave LLC
- 16.2.11.1. Overview
- 16.2.11.2. Products
- 16.2.11.3. SWOT Analysis
- 16.2.11.4. Recent Developments
- 16.2.11.5. Financials (Based on Availability)
- 16.2.12 SPR Therapeutics
- 16.2.12.1. Overview
- 16.2.12.2. Products
- 16.2.12.3. SWOT Analysis
- 16.2.12.4. Recent Developments
- 16.2.12.5. Financials (Based on Availability)
- 16.2.1 ICU Medical Inc
List of Figures
- Figure 1: Global Pain Management Devices Industry Revenue Breakdown (Million, %) by Region 2024 & 2032
- Figure 2: Global Pain Management Devices Industry Volume Breakdown (K Unit, %) by Region 2024 & 2032
- Figure 3: North America Pain Management Devices Industry Revenue (Million), by Country 2024 & 2032
- Figure 4: North America Pain Management Devices Industry Volume (K Unit), by Country 2024 & 2032
- Figure 5: North America Pain Management Devices Industry Revenue Share (%), by Country 2024 & 2032
- Figure 6: North America Pain Management Devices Industry Volume Share (%), by Country 2024 & 2032
- Figure 7: Europe Pain Management Devices Industry Revenue (Million), by Country 2024 & 2032
- Figure 8: Europe Pain Management Devices Industry Volume (K Unit), by Country 2024 & 2032
- Figure 9: Europe Pain Management Devices Industry Revenue Share (%), by Country 2024 & 2032
- Figure 10: Europe Pain Management Devices Industry Volume Share (%), by Country 2024 & 2032
- Figure 11: Asia Pacific Pain Management Devices Industry Revenue (Million), by Country 2024 & 2032
- Figure 12: Asia Pacific Pain Management Devices Industry Volume (K Unit), by Country 2024 & 2032
- Figure 13: Asia Pacific Pain Management Devices Industry Revenue Share (%), by Country 2024 & 2032
- Figure 14: Asia Pacific Pain Management Devices Industry Volume Share (%), by Country 2024 & 2032
- Figure 15: Middle East and Africa Pain Management Devices Industry Revenue (Million), by Country 2024 & 2032
- Figure 16: Middle East and Africa Pain Management Devices Industry Volume (K Unit), by Country 2024 & 2032
- Figure 17: Middle East and Africa Pain Management Devices Industry Revenue Share (%), by Country 2024 & 2032
- Figure 18: Middle East and Africa Pain Management Devices Industry Volume Share (%), by Country 2024 & 2032
- Figure 19: South America Pain Management Devices Industry Revenue (Million), by Country 2024 & 2032
- Figure 20: South America Pain Management Devices Industry Volume (K Unit), by Country 2024 & 2032
- Figure 21: South America Pain Management Devices Industry Revenue Share (%), by Country 2024 & 2032
- Figure 22: South America Pain Management Devices Industry Volume Share (%), by Country 2024 & 2032
- Figure 23: North America Pain Management Devices Industry Revenue (Million), by Product Type 2024 & 2032
- Figure 24: North America Pain Management Devices Industry Volume (K Unit), by Product Type 2024 & 2032
- Figure 25: North America Pain Management Devices Industry Revenue Share (%), by Product Type 2024 & 2032
- Figure 26: North America Pain Management Devices Industry Volume Share (%), by Product Type 2024 & 2032
- Figure 27: North America Pain Management Devices Industry Revenue (Million), by Application 2024 & 2032
- Figure 28: North America Pain Management Devices Industry Volume (K Unit), by Application 2024 & 2032
- Figure 29: North America Pain Management Devices Industry Revenue Share (%), by Application 2024 & 2032
- Figure 30: North America Pain Management Devices Industry Volume Share (%), by Application 2024 & 2032
- Figure 31: North America Pain Management Devices Industry Revenue (Million), by End-User 2024 & 2032
- Figure 32: North America Pain Management Devices Industry Volume (K Unit), by End-User 2024 & 2032
- Figure 33: North America Pain Management Devices Industry Revenue Share (%), by End-User 2024 & 2032
- Figure 34: North America Pain Management Devices Industry Volume Share (%), by End-User 2024 & 2032
- Figure 35: North America Pain Management Devices Industry Revenue (Million), by Country 2024 & 2032
- Figure 36: North America Pain Management Devices Industry Volume (K Unit), by Country 2024 & 2032
- Figure 37: North America Pain Management Devices Industry Revenue Share (%), by Country 2024 & 2032
- Figure 38: North America Pain Management Devices Industry Volume Share (%), by Country 2024 & 2032
- Figure 39: Europe Pain Management Devices Industry Revenue (Million), by Product Type 2024 & 2032
- Figure 40: Europe Pain Management Devices Industry Volume (K Unit), by Product Type 2024 & 2032
- Figure 41: Europe Pain Management Devices Industry Revenue Share (%), by Product Type 2024 & 2032
- Figure 42: Europe Pain Management Devices Industry Volume Share (%), by Product Type 2024 & 2032
- Figure 43: Europe Pain Management Devices Industry Revenue (Million), by Application 2024 & 2032
- Figure 44: Europe Pain Management Devices Industry Volume (K Unit), by Application 2024 & 2032
- Figure 45: Europe Pain Management Devices Industry Revenue Share (%), by Application 2024 & 2032
- Figure 46: Europe Pain Management Devices Industry Volume Share (%), by Application 2024 & 2032
- Figure 47: Europe Pain Management Devices Industry Revenue (Million), by End-User 2024 & 2032
- Figure 48: Europe Pain Management Devices Industry Volume (K Unit), by End-User 2024 & 2032
- Figure 49: Europe Pain Management Devices Industry Revenue Share (%), by End-User 2024 & 2032
- Figure 50: Europe Pain Management Devices Industry Volume Share (%), by End-User 2024 & 2032
- Figure 51: Europe Pain Management Devices Industry Revenue (Million), by Country 2024 & 2032
- Figure 52: Europe Pain Management Devices Industry Volume (K Unit), by Country 2024 & 2032
- Figure 53: Europe Pain Management Devices Industry Revenue Share (%), by Country 2024 & 2032
- Figure 54: Europe Pain Management Devices Industry Volume Share (%), by Country 2024 & 2032
- Figure 55: Asia Pacific Pain Management Devices Industry Revenue (Million), by Product Type 2024 & 2032
- Figure 56: Asia Pacific Pain Management Devices Industry Volume (K Unit), by Product Type 2024 & 2032
- Figure 57: Asia Pacific Pain Management Devices Industry Revenue Share (%), by Product Type 2024 & 2032
- Figure 58: Asia Pacific Pain Management Devices Industry Volume Share (%), by Product Type 2024 & 2032
- Figure 59: Asia Pacific Pain Management Devices Industry Revenue (Million), by Application 2024 & 2032
- Figure 60: Asia Pacific Pain Management Devices Industry Volume (K Unit), by Application 2024 & 2032
- Figure 61: Asia Pacific Pain Management Devices Industry Revenue Share (%), by Application 2024 & 2032
- Figure 62: Asia Pacific Pain Management Devices Industry Volume Share (%), by Application 2024 & 2032
- Figure 63: Asia Pacific Pain Management Devices Industry Revenue (Million), by End-User 2024 & 2032
- Figure 64: Asia Pacific Pain Management Devices Industry Volume (K Unit), by End-User 2024 & 2032
- Figure 65: Asia Pacific Pain Management Devices Industry Revenue Share (%), by End-User 2024 & 2032
- Figure 66: Asia Pacific Pain Management Devices Industry Volume Share (%), by End-User 2024 & 2032
- Figure 67: Asia Pacific Pain Management Devices Industry Revenue (Million), by Country 2024 & 2032
- Figure 68: Asia Pacific Pain Management Devices Industry Volume (K Unit), by Country 2024 & 2032
- Figure 69: Asia Pacific Pain Management Devices Industry Revenue Share (%), by Country 2024 & 2032
- Figure 70: Asia Pacific Pain Management Devices Industry Volume Share (%), by Country 2024 & 2032
- Figure 71: Middle East and Africa Pain Management Devices Industry Revenue (Million), by Product Type 2024 & 2032
- Figure 72: Middle East and Africa Pain Management Devices Industry Volume (K Unit), by Product Type 2024 & 2032
- Figure 73: Middle East and Africa Pain Management Devices Industry Revenue Share (%), by Product Type 2024 & 2032
- Figure 74: Middle East and Africa Pain Management Devices Industry Volume Share (%), by Product Type 2024 & 2032
- Figure 75: Middle East and Africa Pain Management Devices Industry Revenue (Million), by Application 2024 & 2032
- Figure 76: Middle East and Africa Pain Management Devices Industry Volume (K Unit), by Application 2024 & 2032
- Figure 77: Middle East and Africa Pain Management Devices Industry Revenue Share (%), by Application 2024 & 2032
- Figure 78: Middle East and Africa Pain Management Devices Industry Volume Share (%), by Application 2024 & 2032
- Figure 79: Middle East and Africa Pain Management Devices Industry Revenue (Million), by End-User 2024 & 2032
- Figure 80: Middle East and Africa Pain Management Devices Industry Volume (K Unit), by End-User 2024 & 2032
- Figure 81: Middle East and Africa Pain Management Devices Industry Revenue Share (%), by End-User 2024 & 2032
- Figure 82: Middle East and Africa Pain Management Devices Industry Volume Share (%), by End-User 2024 & 2032
- Figure 83: Middle East and Africa Pain Management Devices Industry Revenue (Million), by Country 2024 & 2032
- Figure 84: Middle East and Africa Pain Management Devices Industry Volume (K Unit), by Country 2024 & 2032
- Figure 85: Middle East and Africa Pain Management Devices Industry Revenue Share (%), by Country 2024 & 2032
- Figure 86: Middle East and Africa Pain Management Devices Industry Volume Share (%), by Country 2024 & 2032
- Figure 87: South America Pain Management Devices Industry Revenue (Million), by Product Type 2024 & 2032
- Figure 88: South America Pain Management Devices Industry Volume (K Unit), by Product Type 2024 & 2032
- Figure 89: South America Pain Management Devices Industry Revenue Share (%), by Product Type 2024 & 2032
- Figure 90: South America Pain Management Devices Industry Volume Share (%), by Product Type 2024 & 2032
- Figure 91: South America Pain Management Devices Industry Revenue (Million), by Application 2024 & 2032
- Figure 92: South America Pain Management Devices Industry Volume (K Unit), by Application 2024 & 2032
- Figure 93: South America Pain Management Devices Industry Revenue Share (%), by Application 2024 & 2032
- Figure 94: South America Pain Management Devices Industry Volume Share (%), by Application 2024 & 2032
- Figure 95: South America Pain Management Devices Industry Revenue (Million), by End-User 2024 & 2032
- Figure 96: South America Pain Management Devices Industry Volume (K Unit), by End-User 2024 & 2032
- Figure 97: South America Pain Management Devices Industry Revenue Share (%), by End-User 2024 & 2032
- Figure 98: South America Pain Management Devices Industry Volume Share (%), by End-User 2024 & 2032
- Figure 99: South America Pain Management Devices Industry Revenue (Million), by Country 2024 & 2032
- Figure 100: South America Pain Management Devices Industry Volume (K Unit), by Country 2024 & 2032
- Figure 101: South America Pain Management Devices Industry Revenue Share (%), by Country 2024 & 2032
- Figure 102: South America Pain Management Devices Industry Volume Share (%), by Country 2024 & 2032
List of Tables
- Table 1: Global Pain Management Devices Industry Revenue Million Forecast, by Region 2019 & 2032
- Table 2: Global Pain Management Devices Industry Volume K Unit Forecast, by Region 2019 & 2032
- Table 3: Global Pain Management Devices Industry Revenue Million Forecast, by Product Type 2019 & 2032
- Table 4: Global Pain Management Devices Industry Volume K Unit Forecast, by Product Type 2019 & 2032
- Table 5: Global Pain Management Devices Industry Revenue Million Forecast, by Application 2019 & 2032
- Table 6: Global Pain Management Devices Industry Volume K Unit Forecast, by Application 2019 & 2032
- Table 7: Global Pain Management Devices Industry Revenue Million Forecast, by End-User 2019 & 2032
- Table 8: Global Pain Management Devices Industry Volume K Unit Forecast, by End-User 2019 & 2032
- Table 9: Global Pain Management Devices Industry Revenue Million Forecast, by Region 2019 & 2032
- Table 10: Global Pain Management Devices Industry Volume K Unit Forecast, by Region 2019 & 2032
- Table 11: Global Pain Management Devices Industry Revenue Million Forecast, by Country 2019 & 2032
- Table 12: Global Pain Management Devices Industry Volume K Unit Forecast, by Country 2019 & 2032
- Table 13: Global Pain Management Devices Industry Revenue Million Forecast, by Country 2019 & 2032
- Table 14: Global Pain Management Devices Industry Volume K Unit Forecast, by Country 2019 & 2032
- Table 15: Global Pain Management Devices Industry Revenue Million Forecast, by Country 2019 & 2032
- Table 16: Global Pain Management Devices Industry Volume K Unit Forecast, by Country 2019 & 2032
- Table 17: Global Pain Management Devices Industry Revenue Million Forecast, by Country 2019 & 2032
- Table 18: Global Pain Management Devices Industry Volume K Unit Forecast, by Country 2019 & 2032
- Table 19: Global Pain Management Devices Industry Revenue Million Forecast, by Country 2019 & 2032
- Table 20: Global Pain Management Devices Industry Volume K Unit Forecast, by Country 2019 & 2032
- Table 21: Global Pain Management Devices Industry Revenue Million Forecast, by Product Type 2019 & 2032
- Table 22: Global Pain Management Devices Industry Volume K Unit Forecast, by Product Type 2019 & 2032
- Table 23: Global Pain Management Devices Industry Revenue Million Forecast, by Application 2019 & 2032
- Table 24: Global Pain Management Devices Industry Volume K Unit Forecast, by Application 2019 & 2032
- Table 25: Global Pain Management Devices Industry Revenue Million Forecast, by End-User 2019 & 2032
- Table 26: Global Pain Management Devices Industry Volume K Unit Forecast, by End-User 2019 & 2032
- Table 27: Global Pain Management Devices Industry Revenue Million Forecast, by Country 2019 & 2032
- Table 28: Global Pain Management Devices Industry Volume K Unit Forecast, by Country 2019 & 2032
- Table 29: United States Pain Management Devices Industry Revenue (Million) Forecast, by Application 2019 & 2032
- Table 30: United States Pain Management Devices Industry Volume (K Unit) Forecast, by Application 2019 & 2032
- Table 31: Canada Pain Management Devices Industry Revenue (Million) Forecast, by Application 2019 & 2032
- Table 32: Canada Pain Management Devices Industry Volume (K Unit) Forecast, by Application 2019 & 2032
- Table 33: Mexico Pain Management Devices Industry Revenue (Million) Forecast, by Application 2019 & 2032
- Table 34: Mexico Pain Management Devices Industry Volume (K Unit) Forecast, by Application 2019 & 2032
- Table 35: Global Pain Management Devices Industry Revenue Million Forecast, by Product Type 2019 & 2032
- Table 36: Global Pain Management Devices Industry Volume K Unit Forecast, by Product Type 2019 & 2032
- Table 37: Global Pain Management Devices Industry Revenue Million Forecast, by Application 2019 & 2032
- Table 38: Global Pain Management Devices Industry Volume K Unit Forecast, by Application 2019 & 2032
- Table 39: Global Pain Management Devices Industry Revenue Million Forecast, by End-User 2019 & 2032
- Table 40: Global Pain Management Devices Industry Volume K Unit Forecast, by End-User 2019 & 2032
- Table 41: Global Pain Management Devices Industry Revenue Million Forecast, by Country 2019 & 2032
- Table 42: Global Pain Management Devices Industry Volume K Unit Forecast, by Country 2019 & 2032
- Table 43: Germany Pain Management Devices Industry Revenue (Million) Forecast, by Application 2019 & 2032
- Table 44: Germany Pain Management Devices Industry Volume (K Unit) Forecast, by Application 2019 & 2032
- Table 45: United Kingdom Pain Management Devices Industry Revenue (Million) Forecast, by Application 2019 & 2032
- Table 46: United Kingdom Pain Management Devices Industry Volume (K Unit) Forecast, by Application 2019 & 2032
- Table 47: France Pain Management Devices Industry Revenue (Million) Forecast, by Application 2019 & 2032
- Table 48: France Pain Management Devices Industry Volume (K Unit) Forecast, by Application 2019 & 2032
- Table 49: Italy Pain Management Devices Industry Revenue (Million) Forecast, by Application 2019 & 2032
- Table 50: Italy Pain Management Devices Industry Volume (K Unit) Forecast, by Application 2019 & 2032
- Table 51: Spain Pain Management Devices Industry Revenue (Million) Forecast, by Application 2019 & 2032
- Table 52: Spain Pain Management Devices Industry Volume (K Unit) Forecast, by Application 2019 & 2032
- Table 53: Rest of Europe Pain Management Devices Industry Revenue (Million) Forecast, by Application 2019 & 2032
- Table 54: Rest of Europe Pain Management Devices Industry Volume (K Unit) Forecast, by Application 2019 & 2032
- Table 55: Global Pain Management Devices Industry Revenue Million Forecast, by Product Type 2019 & 2032
- Table 56: Global Pain Management Devices Industry Volume K Unit Forecast, by Product Type 2019 & 2032
- Table 57: Global Pain Management Devices Industry Revenue Million Forecast, by Application 2019 & 2032
- Table 58: Global Pain Management Devices Industry Volume K Unit Forecast, by Application 2019 & 2032
- Table 59: Global Pain Management Devices Industry Revenue Million Forecast, by End-User 2019 & 2032
- Table 60: Global Pain Management Devices Industry Volume K Unit Forecast, by End-User 2019 & 2032
- Table 61: Global Pain Management Devices Industry Revenue Million Forecast, by Country 2019 & 2032
- Table 62: Global Pain Management Devices Industry Volume K Unit Forecast, by Country 2019 & 2032
- Table 63: China Pain Management Devices Industry Revenue (Million) Forecast, by Application 2019 & 2032
- Table 64: China Pain Management Devices Industry Volume (K Unit) Forecast, by Application 2019 & 2032
- Table 65: Japan Pain Management Devices Industry Revenue (Million) Forecast, by Application 2019 & 2032
- Table 66: Japan Pain Management Devices Industry Volume (K Unit) Forecast, by Application 2019 & 2032
- Table 67: India Pain Management Devices Industry Revenue (Million) Forecast, by Application 2019 & 2032
- Table 68: India Pain Management Devices Industry Volume (K Unit) Forecast, by Application 2019 & 2032
- Table 69: Australia Pain Management Devices Industry Revenue (Million) Forecast, by Application 2019 & 2032
- Table 70: Australia Pain Management Devices Industry Volume (K Unit) Forecast, by Application 2019 & 2032
- Table 71: South Korea Pain Management Devices Industry Revenue (Million) Forecast, by Application 2019 & 2032
- Table 72: South Korea Pain Management Devices Industry Volume (K Unit) Forecast, by Application 2019 & 2032
- Table 73: Rest of Asia Pacific Pain Management Devices Industry Revenue (Million) Forecast, by Application 2019 & 2032
- Table 74: Rest of Asia Pacific Pain Management Devices Industry Volume (K Unit) Forecast, by Application 2019 & 2032
- Table 75: Global Pain Management Devices Industry Revenue Million Forecast, by Product Type 2019 & 2032
- Table 76: Global Pain Management Devices Industry Volume K Unit Forecast, by Product Type 2019 & 2032
- Table 77: Global Pain Management Devices Industry Revenue Million Forecast, by Application 2019 & 2032
- Table 78: Global Pain Management Devices Industry Volume K Unit Forecast, by Application 2019 & 2032
- Table 79: Global Pain Management Devices Industry Revenue Million Forecast, by End-User 2019 & 2032
- Table 80: Global Pain Management Devices Industry Volume K Unit Forecast, by End-User 2019 & 2032
- Table 81: Global Pain Management Devices Industry Revenue Million Forecast, by Country 2019 & 2032
- Table 82: Global Pain Management Devices Industry Volume K Unit Forecast, by Country 2019 & 2032
- Table 83: GCC Pain Management Devices Industry Revenue (Million) Forecast, by Application 2019 & 2032
- Table 84: GCC Pain Management Devices Industry Volume (K Unit) Forecast, by Application 2019 & 2032
- Table 85: South Africa Pain Management Devices Industry Revenue (Million) Forecast, by Application 2019 & 2032
- Table 86: South Africa Pain Management Devices Industry Volume (K Unit) Forecast, by Application 2019 & 2032
- Table 87: Rest of Middle East and Africa Pain Management Devices Industry Revenue (Million) Forecast, by Application 2019 & 2032
- Table 88: Rest of Middle East and Africa Pain Management Devices Industry Volume (K Unit) Forecast, by Application 2019 & 2032
- Table 89: Global Pain Management Devices Industry Revenue Million Forecast, by Product Type 2019 & 2032
- Table 90: Global Pain Management Devices Industry Volume K Unit Forecast, by Product Type 2019 & 2032
- Table 91: Global Pain Management Devices Industry Revenue Million Forecast, by Application 2019 & 2032
- Table 92: Global Pain Management Devices Industry Volume K Unit Forecast, by Application 2019 & 2032
- Table 93: Global Pain Management Devices Industry Revenue Million Forecast, by End-User 2019 & 2032
- Table 94: Global Pain Management Devices Industry Volume K Unit Forecast, by End-User 2019 & 2032
- Table 95: Global Pain Management Devices Industry Revenue Million Forecast, by Country 2019 & 2032
- Table 96: Global Pain Management Devices Industry Volume K Unit Forecast, by Country 2019 & 2032
- Table 97: Brazil Pain Management Devices Industry Revenue (Million) Forecast, by Application 2019 & 2032
- Table 98: Brazil Pain Management Devices Industry Volume (K Unit) Forecast, by Application 2019 & 2032
- Table 99: Argentina Pain Management Devices Industry Revenue (Million) Forecast, by Application 2019 & 2032
- Table 100: Argentina Pain Management Devices Industry Volume (K Unit) Forecast, by Application 2019 & 2032
- Table 101: Rest of South America Pain Management Devices Industry Revenue (Million) Forecast, by Application 2019 & 2032
- Table 102: Rest of South America Pain Management Devices Industry Volume (K Unit) Forecast, by Application 2019 & 2032
Frequently Asked Questions
1. What is the projected Compound Annual Growth Rate (CAGR) of the Pain Management Devices Industry?
The projected CAGR is approximately 9.70%.
2. Which companies are prominent players in the Pain Management Devices Industry?
Key companies in the market include ICU Medical Inc, LivaNova, DJO Global LLC, Enovis, Medtronic, Baxter, Stryker, Abbott, Boston Scientific Corporation, Nevro Cor, Stim Wave LLC, SPR Therapeutics.
3. What are the main segments of the Pain Management Devices Industry?
The market segments include Product Type, Application, End-User.
4. Can you provide details about the market size?
The market size is estimated to be USD 10.64 Million as of 2022.
5. What are some drivers contributing to market growth?
The advent of Innovative and Technologically Advanced Pain Management Devices; Increase in Adoption of Pain Management Devices; Rise in Geriatric Population.
6. What are the notable trends driving market growth?
The neuropathic pain management devices segment counted for the largest share of the global market and witness significant growth.
7. Are there any restraints impacting market growth?
Preferable use of medications for pain management.
8. Can you provide examples of recent developments in the market?
In June 2022, Coach Care has partnered with (Nexstim NBT System) NXTSTIM to Offer World's First Commercial (remote patient monitoring) RPM and Wellness Monitoring Device for Pain Management
9. What pricing options are available for accessing the report?
Pricing options include single-user, multi-user, and enterprise licenses priced at USD 4750, USD 5250, and USD 8750 respectively.
10. Is the market size provided in terms of value or volume?
The market size is provided in terms of value, measured in Million and volume, measured in K Unit.
11. Are there any specific market keywords associated with the report?
Yes, the market keyword associated with the report is "Pain Management Devices Industry," which aids in identifying and referencing the specific market segment covered.
12. How do I determine which pricing option suits my needs best?
The pricing options vary based on user requirements and access needs. Individual users may opt for single-user licenses, while businesses requiring broader access may choose multi-user or enterprise licenses for cost-effective access to the report.
13. Are there any additional resources or data provided in the Pain Management Devices Industry report?
While the report offers comprehensive insights, it's advisable to review the specific contents or supplementary materials provided to ascertain if additional resources or data are available.
14. How can I stay updated on further developments or reports in the Pain Management Devices Industry?
To stay informed about further developments, trends, and reports in the Pain Management Devices Industry, consider subscribing to industry newsletters, following relevant companies and organizations, or regularly checking reputable industry news sources and publications.
Methodology
Step 1 - Identification of Relevant Samples Size from Population Database


Step 2 - Approaches for Defining Global Market Size (Value, Volume* & Price*)

Note*: In applicable scenarios
Step 3 - Data Sources
Primary Research
- Web Analytics
- Survey Reports
- Research Institute
- Latest Research Reports
- Opinion Leaders
Secondary Research
- Annual Reports
- White Paper
- Latest Press Release
- Industry Association
- Paid Database
- Investor Presentations

Step 4 - Data Triangulation
Involves using different sources of information in order to increase the validity of a study
These sources are likely to be stakeholders in a program - participants, other researchers, program staff, other community members, and so on.
Then we put all data in single framework & apply various statistical tools to find out the dynamic on the market.
During the analysis stage, feedback from the stakeholder groups would be compared to determine areas of agreement as well as areas of divergence
