

Key Insights
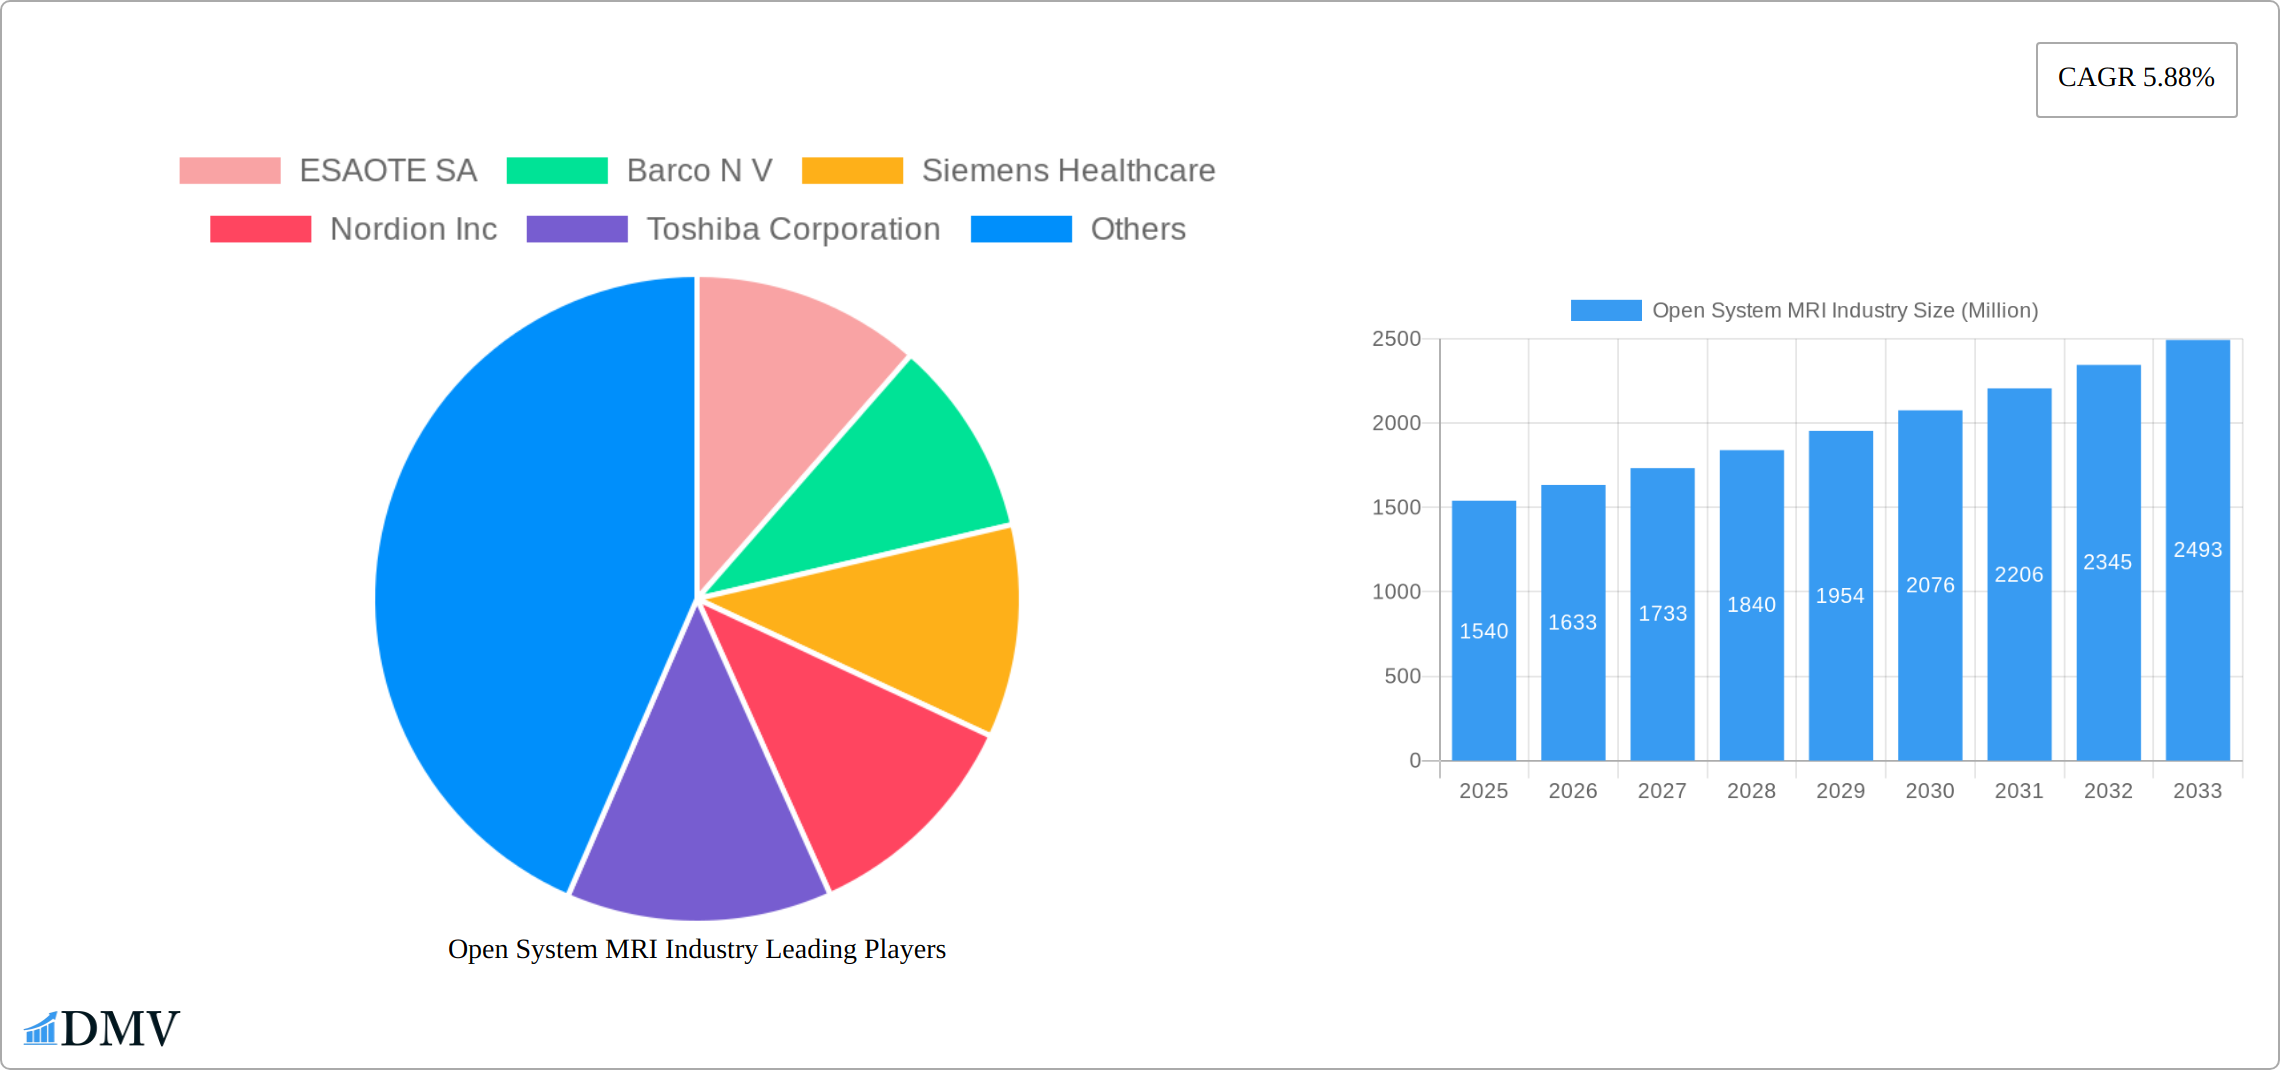
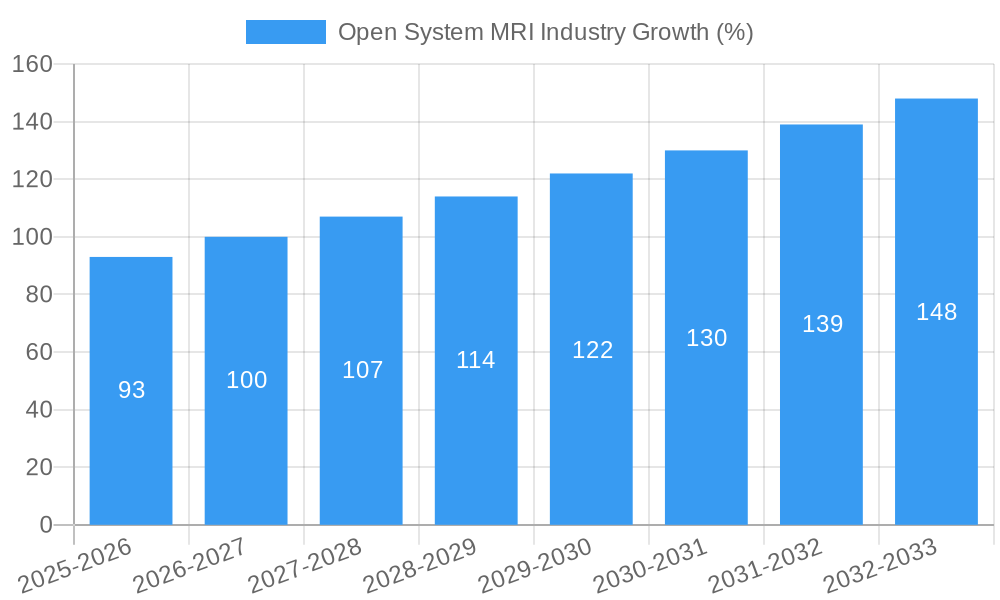
The open system MRI market, valued at $1.54 billion in 2025, is projected to experience robust growth, driven by a Compound Annual Growth Rate (CAGR) of 5.88% from 2025 to 2033. This expansion is fueled by several key factors. Technological advancements resulting in improved image quality, faster scan times, and increased patient comfort are attracting wider adoption across various medical specialties. The rising prevalence of neurological disorders, cardiovascular diseases, and cancer, coupled with a growing aging population requiring more frequent imaging, significantly contributes to market demand. Furthermore, the increasing preference for open system MRIs, which offer a less claustrophobic experience compared to traditional closed systems, is driving market growth, particularly among patients with anxiety or claustrophobia. The diverse range of applications, including neurology, cardiology, oncology, and gastroenterology, ensures a broad market base. However, the high initial investment cost associated with open system MRI machines remains a significant restraint, potentially limiting wider penetration in developing economies. The market is segmented by resolution (low, mid, high-field scanners) and application, with high-field scanners and neurological applications currently leading the market share, while mid-field scanners are expected to show substantial growth due to their cost-effectiveness and accessibility. The competitive landscape is populated by major players including Siemens Healthcare, GE Healthcare, Philips Healthcare, and others, who are engaged in strategic initiatives like technological innovations, mergers, and acquisitions to maintain and expand their market share.
The geographical distribution of the market reflects the current healthcare infrastructure and economic landscape. North America and Europe currently dominate the market due to advanced healthcare infrastructure and high adoption rates. However, the Asia-Pacific region is projected to witness the fastest growth in the forecast period, driven by rising disposable incomes, increasing healthcare expenditure, and growing awareness regarding advanced medical imaging techniques. The Middle East and Africa and South America regions are expected to exhibit moderate growth, propelled by improvements in healthcare infrastructure and government initiatives promoting healthcare modernization. The overall market outlook for open system MRI remains positive, promising significant growth opportunities for market participants over the next decade, though navigating the challenges of high initial costs and expanding access in developing markets will be crucial for continued success.
Open System MRI Industry Market Report: 2019-2033
This comprehensive report provides an in-depth analysis of the Open System MRI industry, offering valuable insights for stakeholders seeking to understand market dynamics, competitive landscapes, and future growth trajectories. The report covers the period from 2019 to 2033, with a base year of 2025 and a forecast period from 2025 to 2033. The market is valued at xx Million in 2025 and is projected to reach xx Million by 2033, exhibiting a CAGR of xx%.
Open System MRI Industry Market Composition & Trends
The Open System MRI market is characterized by moderate concentration, with key players holding significant market share. The distribution is as follows: Siemens Healthcare holds approximately xx% market share, followed by GE Healthcare with xx%, Philips Healthcare with xx%, and other players like Canon Medical Systems Corporation, Toshiba Corporation, and ESAOTE SA collectively holding the remaining xx%. Innovation is driven by advancements in magnet technology, improved image resolution, and the development of specialized applications. The regulatory landscape, while generally supportive of technological advancement, varies across regions, impacting market access and approval timelines. Substitute products, such as Ultrasound and CT scans, exert competitive pressure, particularly in specific applications. The end-user profile encompasses hospitals, diagnostic imaging centers, and veterinary clinics, with hospitals forming the largest segment. Mergers and acquisitions (M&A) activity has been relatively moderate in recent years, with deal values averaging approximately xx Million per transaction. A recent example is the xx Million acquisition of xx company by xx company in xx.
- Market Share: Siemens Healthcare (xx%), GE Healthcare (xx%), Philips Healthcare (xx%), Others (xx%).
- M&A Activity: Average deal value: xx Million.
- Key Regulatory Bodies: [List relevant regulatory bodies and their influence]
- Substitute Products: Ultrasound, CT Scans.
Open System MRI Industry Industry Evolution
The Open System MRI industry has witnessed significant growth from 2019 to 2024, driven by technological advancements leading to improved image quality and faster scan times. The market experienced a CAGR of xx% during this period. The adoption of open MRI systems has increased steadily, particularly in applications where patient comfort and claustrophobia are major concerns. This growth is fueled by increasing prevalence of chronic diseases necessitating frequent MRI scans, along with rising disposable incomes and healthcare spending in developing economies. Technological advancements, such as the introduction of higher-field strength magnets and improved software algorithms, have significantly enhanced image resolution and diagnostic accuracy. Furthermore, a shift towards minimally invasive procedures and increased demand for quicker turnaround times are driving adoption of advanced open MRI systems. The market is expected to continue this trajectory with a projected CAGR of xx% from 2025 to 2033, reaching a market value of xx Million by 2033. This growth will be largely driven by emerging applications in veterinary medicine and advancements in artificial intelligence for image analysis.
Leading Regions, Countries, or Segments in Open System MRI Industry
North America currently holds the largest market share within the Open System MRI industry, driven by high healthcare expenditure, technological advancements, and a strong regulatory framework. However, the Asia-Pacific region demonstrates the highest growth potential due to a rapidly expanding healthcare infrastructure and rising prevalence of chronic diseases.
- By Resolution: High-field scanners dominate the market due to their superior image quality, though mid-field scanners maintain significant market share due to a balance of cost and performance. Low-field scanners hold a niche market, primarily in veterinary applications.
- By Application: Neurology and Oncology are leading application segments, driven by the increasing prevalence of neurological disorders and cancer cases. Cardiology and Gastroenterology applications are also growing.
- Key Drivers (North America): High healthcare expenditure, advanced technological infrastructure, strong regulatory support, and established healthcare systems.
- Key Drivers (Asia-Pacific): Rapid economic growth, increasing healthcare spending, rising prevalence of chronic diseases, and government initiatives to improve healthcare infrastructure.
Open System MRI Industry Product Innovations
Recent innovations in Open System MRI technology include the development of higher-field strength magnets offering superior image quality with reduced scan times. Advancements in gradient coil technology and radiofrequency (RF) coils further enhance image resolution and reduce artifacts. The introduction of advanced software algorithms for image reconstruction and analysis also significantly improves diagnostic accuracy. Unique selling propositions often include enhanced patient comfort through open-bore designs, reduced scan times, improved image quality, and specialized software packages tailored to specific applications.
Propelling Factors for Open System MRI Growth
Technological advancements, including higher field strength magnets and improved software, are key drivers. Increased prevalence of chronic diseases requiring MRI scans fuels demand. Rising healthcare expenditure and favorable regulatory environments in developed and emerging markets are also contributing factors. Government initiatives promoting healthcare infrastructure development further enhance growth prospects. The expanding veterinary market offers substantial opportunities for specialized open MRI systems.
Obstacles in the Open System MRI Industry Market
High initial investment costs for equipment pose a barrier to entry for smaller healthcare facilities. The complexity of open MRI systems can lead to increased maintenance and operational costs. Competition from established players with extensive market share limits the growth of new entrants. Supply chain disruptions due to global events impact production timelines and can affect availability and price. Varying regulatory approvals across different regions add complexity and increase the time to market for new products.
Future Opportunities in Open System MRI Industry
Expanding applications in veterinary medicine present substantial growth opportunities. The integration of Artificial Intelligence (AI) and machine learning for improved image analysis and automated diagnosis offers significant potential. Development of portable or mobile open MRI systems can expand accessibility in remote areas. Focus on improving patient experience through enhanced comfort and reducing scan times will continue to be a major area of innovation.
Major Players in the Open System MRI Industry Ecosystem
- ESAOTE SA
- Barco N V
- Siemens Healthcare
- Nordion Inc
- Toshiba Corporation
- Hologic Inc
- GE Healthcare
- Philips Healthcare
- Hitachi Medical Corporation
- Canon Medical Systems Corporation
- Onex Corporation (Carestream Health)
- Shimadzu Corporation
Key Developments in Open System MRI Industry Industry
- July 2022: Canon Medical launched a new open-bore 1.5T MRI system, expanding its presence in the growing 1.5T MR market segment. This launch strengthens their market position and product portfolio.
- January 2023: Esaote North America, Inc. launched the Magnifico Vet Open MRI system, targeting the growing veterinary market. This caters to a niche but significant area, increasing market reach and potentially opening new revenue streams.
Strategic Open System MRI Industry Market Forecast
The Open System MRI market is poised for substantial growth over the forecast period (2025-2033), driven by technological advancements, increasing prevalence of chronic diseases, and the expansion into new application areas such as veterinary medicine. The development of AI-powered diagnostic tools and the introduction of more compact and portable systems will further fuel market expansion. These factors, combined with continuous innovation in image quality and patient comfort, position the Open System MRI market for significant future growth and market penetration.
Open System MRI Industry Segmentation
-
1. Resolution
- 1.1. Low- Field Scanner
- 1.2. Mid-field Scanner
- 1.3. High-Field Scanner
-
2. Application
- 2.1. Neurology
- 2.2. Gastroenterology
- 2.3. Cardiology
- 2.4. Oncology
- 2.5. Other Applications
Open System MRI Industry Segmentation By Geography
-
1. North America
- 1.1. United States
- 1.2. Canada
- 1.3. Mexico
-
2. Europe
- 2.1. Germany
- 2.2. United Kingdom
- 2.3. France
- 2.4. Italy
- 2.5. Spain
- 2.6. Rest of Europe
-
3. Asia Pacific
- 3.1. China
- 3.2. Japan
- 3.3. India
- 3.4. Australia
- 3.5. South Korea
- 3.6. Rest of Asia Pacific
-
4. Middle East and Africa
- 4.1. GCC
- 4.2. South Africa
- 4.3. Rest of Middle East and Africa
-
5. South America
- 5.1. Brazil
- 5.2. Argentina
- 5.3. Rest of South America

Open System MRI Industry REPORT HIGHLIGHTS
| Aspects | Details |
|---|---|
| Study Period | 2019-2033 |
| Base Year | 2024 |
| Estimated Year | 2025 |
| Forecast Period | 2025-2033 |
| Historical Period | 2019-2024 |
| Growth Rate | CAGR of 5.88% from 2019-2033 |
| Segmentation |
|
Table of Contents
- 1. Introduction
- 1.1. Research Scope
- 1.2. Market Segmentation
- 1.3. Research Methodology
- 1.4. Definitions and Assumptions
- 2. Executive Summary
- 2.1. Introduction
- 3. Market Dynamics
- 3.1. Introduction
- 3.2. Market Drivers
- 3.2.1. Increasing Number of MRI Procedures; Technological Developments in Open MRI System
- 3.3. Market Restrains
- 3.3.1. High Cost of Open MRI Systems
- 3.4. Market Trends
- 3.4.1. Neurology Segment is Expected to Witness Significant Growth Over the Forecast Period.
- 4. Market Factor Analysis
- 4.1. Porters Five Forces
- 4.2. Supply/Value Chain
- 4.3. PESTEL analysis
- 4.4. Market Entropy
- 4.5. Patent/Trademark Analysis
- 5. Global Open System MRI Industry Analysis, Insights and Forecast, 2019-2031
- 5.1. Market Analysis, Insights and Forecast - by Resolution
- 5.1.1. Low- Field Scanner
- 5.1.2. Mid-field Scanner
- 5.1.3. High-Field Scanner
- 5.2. Market Analysis, Insights and Forecast - by Application
- 5.2.1. Neurology
- 5.2.2. Gastroenterology
- 5.2.3. Cardiology
- 5.2.4. Oncology
- 5.2.5. Other Applications
- 5.3. Market Analysis, Insights and Forecast - by Region
- 5.3.1. North America
- 5.3.2. Europe
- 5.3.3. Asia Pacific
- 5.3.4. Middle East and Africa
- 5.3.5. South America
- 5.1. Market Analysis, Insights and Forecast - by Resolution
- 6. North America Open System MRI Industry Analysis, Insights and Forecast, 2019-2031
- 6.1. Market Analysis, Insights and Forecast - by Resolution
- 6.1.1. Low- Field Scanner
- 6.1.2. Mid-field Scanner
- 6.1.3. High-Field Scanner
- 6.2. Market Analysis, Insights and Forecast - by Application
- 6.2.1. Neurology
- 6.2.2. Gastroenterology
- 6.2.3. Cardiology
- 6.2.4. Oncology
- 6.2.5. Other Applications
- 6.1. Market Analysis, Insights and Forecast - by Resolution
- 7. Europe Open System MRI Industry Analysis, Insights and Forecast, 2019-2031
- 7.1. Market Analysis, Insights and Forecast - by Resolution
- 7.1.1. Low- Field Scanner
- 7.1.2. Mid-field Scanner
- 7.1.3. High-Field Scanner
- 7.2. Market Analysis, Insights and Forecast - by Application
- 7.2.1. Neurology
- 7.2.2. Gastroenterology
- 7.2.3. Cardiology
- 7.2.4. Oncology
- 7.2.5. Other Applications
- 7.1. Market Analysis, Insights and Forecast - by Resolution
- 8. Asia Pacific Open System MRI Industry Analysis, Insights and Forecast, 2019-2031
- 8.1. Market Analysis, Insights and Forecast - by Resolution
- 8.1.1. Low- Field Scanner
- 8.1.2. Mid-field Scanner
- 8.1.3. High-Field Scanner
- 8.2. Market Analysis, Insights and Forecast - by Application
- 8.2.1. Neurology
- 8.2.2. Gastroenterology
- 8.2.3. Cardiology
- 8.2.4. Oncology
- 8.2.5. Other Applications
- 8.1. Market Analysis, Insights and Forecast - by Resolution
- 9. Middle East and Africa Open System MRI Industry Analysis, Insights and Forecast, 2019-2031
- 9.1. Market Analysis, Insights and Forecast - by Resolution
- 9.1.1. Low- Field Scanner
- 9.1.2. Mid-field Scanner
- 9.1.3. High-Field Scanner
- 9.2. Market Analysis, Insights and Forecast - by Application
- 9.2.1. Neurology
- 9.2.2. Gastroenterology
- 9.2.3. Cardiology
- 9.2.4. Oncology
- 9.2.5. Other Applications
- 9.1. Market Analysis, Insights and Forecast - by Resolution
- 10. South America Open System MRI Industry Analysis, Insights and Forecast, 2019-2031
- 10.1. Market Analysis, Insights and Forecast - by Resolution
- 10.1.1. Low- Field Scanner
- 10.1.2. Mid-field Scanner
- 10.1.3. High-Field Scanner
- 10.2. Market Analysis, Insights and Forecast - by Application
- 10.2.1. Neurology
- 10.2.2. Gastroenterology
- 10.2.3. Cardiology
- 10.2.4. Oncology
- 10.2.5. Other Applications
- 10.1. Market Analysis, Insights and Forecast - by Resolution
- 11. North America Open System MRI Industry Analysis, Insights and Forecast, 2019-2031
- 11.1. Market Analysis, Insights and Forecast - By Country/Sub-region
- 11.1.1 United States
- 11.1.2 Canada
- 11.1.3 Mexico
- 12. Europe Open System MRI Industry Analysis, Insights and Forecast, 2019-2031
- 12.1. Market Analysis, Insights and Forecast - By Country/Sub-region
- 12.1.1 Germany
- 12.1.2 United Kingdom
- 12.1.3 France
- 12.1.4 Italy
- 12.1.5 Spain
- 12.1.6 Rest of Europe
- 13. Asia Pacific Open System MRI Industry Analysis, Insights and Forecast, 2019-2031
- 13.1. Market Analysis, Insights and Forecast - By Country/Sub-region
- 13.1.1 China
- 13.1.2 Japan
- 13.1.3 India
- 13.1.4 Australia
- 13.1.5 South Korea
- 13.1.6 Rest of Asia Pacific
- 14. Middle East and Africa Open System MRI Industry Analysis, Insights and Forecast, 2019-2031
- 14.1. Market Analysis, Insights and Forecast - By Country/Sub-region
- 14.1.1 GCC
- 14.1.2 South Africa
- 14.1.3 Rest of Middle East and Africa
- 15. South America Open System MRI Industry Analysis, Insights and Forecast, 2019-2031
- 15.1. Market Analysis, Insights and Forecast - By Country/Sub-region
- 15.1.1 Brazil
- 15.1.2 Argentina
- 15.1.3 Rest of South America
- 16. Competitive Analysis
- 16.1. Global Market Share Analysis 2024
- 16.2. Company Profiles
- 16.2.1 ESAOTE SA
- 16.2.1.1. Overview
- 16.2.1.2. Products
- 16.2.1.3. SWOT Analysis
- 16.2.1.4. Recent Developments
- 16.2.1.5. Financials (Based on Availability)
- 16.2.2 Barco N V
- 16.2.2.1. Overview
- 16.2.2.2. Products
- 16.2.2.3. SWOT Analysis
- 16.2.2.4. Recent Developments
- 16.2.2.5. Financials (Based on Availability)
- 16.2.3 Siemens Healthcare
- 16.2.3.1. Overview
- 16.2.3.2. Products
- 16.2.3.3. SWOT Analysis
- 16.2.3.4. Recent Developments
- 16.2.3.5. Financials (Based on Availability)
- 16.2.4 Nordion Inc
- 16.2.4.1. Overview
- 16.2.4.2. Products
- 16.2.4.3. SWOT Analysis
- 16.2.4.4. Recent Developments
- 16.2.4.5. Financials (Based on Availability)
- 16.2.5 Toshiba Corporation
- 16.2.5.1. Overview
- 16.2.5.2. Products
- 16.2.5.3. SWOT Analysis
- 16.2.5.4. Recent Developments
- 16.2.5.5. Financials (Based on Availability)
- 16.2.6 Hologic Inc
- 16.2.6.1. Overview
- 16.2.6.2. Products
- 16.2.6.3. SWOT Analysis
- 16.2.6.4. Recent Developments
- 16.2.6.5. Financials (Based on Availability)
- 16.2.7 GE Healthcare
- 16.2.7.1. Overview
- 16.2.7.2. Products
- 16.2.7.3. SWOT Analysis
- 16.2.7.4. Recent Developments
- 16.2.7.5. Financials (Based on Availability)
- 16.2.8 Philips Healthcare
- 16.2.8.1. Overview
- 16.2.8.2. Products
- 16.2.8.3. SWOT Analysis
- 16.2.8.4. Recent Developments
- 16.2.8.5. Financials (Based on Availability)
- 16.2.9 Hitachi Medical Corporation
- 16.2.9.1. Overview
- 16.2.9.2. Products
- 16.2.9.3. SWOT Analysis
- 16.2.9.4. Recent Developments
- 16.2.9.5. Financials (Based on Availability)
- 16.2.10 Canon Medical Systems Corporation
- 16.2.10.1. Overview
- 16.2.10.2. Products
- 16.2.10.3. SWOT Analysis
- 16.2.10.4. Recent Developments
- 16.2.10.5. Financials (Based on Availability)
- 16.2.11 Onex Corporation (Carestream Health)
- 16.2.11.1. Overview
- 16.2.11.2. Products
- 16.2.11.3. SWOT Analysis
- 16.2.11.4. Recent Developments
- 16.2.11.5. Financials (Based on Availability)
- 16.2.12 Shimadzu Corporation
- 16.2.12.1. Overview
- 16.2.12.2. Products
- 16.2.12.3. SWOT Analysis
- 16.2.12.4. Recent Developments
- 16.2.12.5. Financials (Based on Availability)
- 16.2.1 ESAOTE SA
List of Figures
- Figure 1: Global Open System MRI Industry Revenue Breakdown (Million, %) by Region 2024 & 2032
- Figure 2: North America Open System MRI Industry Revenue (Million), by Country 2024 & 2032
- Figure 3: North America Open System MRI Industry Revenue Share (%), by Country 2024 & 2032
- Figure 4: Europe Open System MRI Industry Revenue (Million), by Country 2024 & 2032
- Figure 5: Europe Open System MRI Industry Revenue Share (%), by Country 2024 & 2032
- Figure 6: Asia Pacific Open System MRI Industry Revenue (Million), by Country 2024 & 2032
- Figure 7: Asia Pacific Open System MRI Industry Revenue Share (%), by Country 2024 & 2032
- Figure 8: Middle East and Africa Open System MRI Industry Revenue (Million), by Country 2024 & 2032
- Figure 9: Middle East and Africa Open System MRI Industry Revenue Share (%), by Country 2024 & 2032
- Figure 10: South America Open System MRI Industry Revenue (Million), by Country 2024 & 2032
- Figure 11: South America Open System MRI Industry Revenue Share (%), by Country 2024 & 2032
- Figure 12: North America Open System MRI Industry Revenue (Million), by Resolution 2024 & 2032
- Figure 13: North America Open System MRI Industry Revenue Share (%), by Resolution 2024 & 2032
- Figure 14: North America Open System MRI Industry Revenue (Million), by Application 2024 & 2032
- Figure 15: North America Open System MRI Industry Revenue Share (%), by Application 2024 & 2032
- Figure 16: North America Open System MRI Industry Revenue (Million), by Country 2024 & 2032
- Figure 17: North America Open System MRI Industry Revenue Share (%), by Country 2024 & 2032
- Figure 18: Europe Open System MRI Industry Revenue (Million), by Resolution 2024 & 2032
- Figure 19: Europe Open System MRI Industry Revenue Share (%), by Resolution 2024 & 2032
- Figure 20: Europe Open System MRI Industry Revenue (Million), by Application 2024 & 2032
- Figure 21: Europe Open System MRI Industry Revenue Share (%), by Application 2024 & 2032
- Figure 22: Europe Open System MRI Industry Revenue (Million), by Country 2024 & 2032
- Figure 23: Europe Open System MRI Industry Revenue Share (%), by Country 2024 & 2032
- Figure 24: Asia Pacific Open System MRI Industry Revenue (Million), by Resolution 2024 & 2032
- Figure 25: Asia Pacific Open System MRI Industry Revenue Share (%), by Resolution 2024 & 2032
- Figure 26: Asia Pacific Open System MRI Industry Revenue (Million), by Application 2024 & 2032
- Figure 27: Asia Pacific Open System MRI Industry Revenue Share (%), by Application 2024 & 2032
- Figure 28: Asia Pacific Open System MRI Industry Revenue (Million), by Country 2024 & 2032
- Figure 29: Asia Pacific Open System MRI Industry Revenue Share (%), by Country 2024 & 2032
- Figure 30: Middle East and Africa Open System MRI Industry Revenue (Million), by Resolution 2024 & 2032
- Figure 31: Middle East and Africa Open System MRI Industry Revenue Share (%), by Resolution 2024 & 2032
- Figure 32: Middle East and Africa Open System MRI Industry Revenue (Million), by Application 2024 & 2032
- Figure 33: Middle East and Africa Open System MRI Industry Revenue Share (%), by Application 2024 & 2032
- Figure 34: Middle East and Africa Open System MRI Industry Revenue (Million), by Country 2024 & 2032
- Figure 35: Middle East and Africa Open System MRI Industry Revenue Share (%), by Country 2024 & 2032
- Figure 36: South America Open System MRI Industry Revenue (Million), by Resolution 2024 & 2032
- Figure 37: South America Open System MRI Industry Revenue Share (%), by Resolution 2024 & 2032
- Figure 38: South America Open System MRI Industry Revenue (Million), by Application 2024 & 2032
- Figure 39: South America Open System MRI Industry Revenue Share (%), by Application 2024 & 2032
- Figure 40: South America Open System MRI Industry Revenue (Million), by Country 2024 & 2032
- Figure 41: South America Open System MRI Industry Revenue Share (%), by Country 2024 & 2032
List of Tables
- Table 1: Global Open System MRI Industry Revenue Million Forecast, by Region 2019 & 2032
- Table 2: Global Open System MRI Industry Revenue Million Forecast, by Resolution 2019 & 2032
- Table 3: Global Open System MRI Industry Revenue Million Forecast, by Application 2019 & 2032
- Table 4: Global Open System MRI Industry Revenue Million Forecast, by Region 2019 & 2032
- Table 5: Global Open System MRI Industry Revenue Million Forecast, by Country 2019 & 2032
- Table 6: United States Open System MRI Industry Revenue (Million) Forecast, by Application 2019 & 2032
- Table 7: Canada Open System MRI Industry Revenue (Million) Forecast, by Application 2019 & 2032
- Table 8: Mexico Open System MRI Industry Revenue (Million) Forecast, by Application 2019 & 2032
- Table 9: Global Open System MRI Industry Revenue Million Forecast, by Country 2019 & 2032
- Table 10: Germany Open System MRI Industry Revenue (Million) Forecast, by Application 2019 & 2032
- Table 11: United Kingdom Open System MRI Industry Revenue (Million) Forecast, by Application 2019 & 2032
- Table 12: France Open System MRI Industry Revenue (Million) Forecast, by Application 2019 & 2032
- Table 13: Italy Open System MRI Industry Revenue (Million) Forecast, by Application 2019 & 2032
- Table 14: Spain Open System MRI Industry Revenue (Million) Forecast, by Application 2019 & 2032
- Table 15: Rest of Europe Open System MRI Industry Revenue (Million) Forecast, by Application 2019 & 2032
- Table 16: Global Open System MRI Industry Revenue Million Forecast, by Country 2019 & 2032
- Table 17: China Open System MRI Industry Revenue (Million) Forecast, by Application 2019 & 2032
- Table 18: Japan Open System MRI Industry Revenue (Million) Forecast, by Application 2019 & 2032
- Table 19: India Open System MRI Industry Revenue (Million) Forecast, by Application 2019 & 2032
- Table 20: Australia Open System MRI Industry Revenue (Million) Forecast, by Application 2019 & 2032
- Table 21: South Korea Open System MRI Industry Revenue (Million) Forecast, by Application 2019 & 2032
- Table 22: Rest of Asia Pacific Open System MRI Industry Revenue (Million) Forecast, by Application 2019 & 2032
- Table 23: Global Open System MRI Industry Revenue Million Forecast, by Country 2019 & 2032
- Table 24: GCC Open System MRI Industry Revenue (Million) Forecast, by Application 2019 & 2032
- Table 25: South Africa Open System MRI Industry Revenue (Million) Forecast, by Application 2019 & 2032
- Table 26: Rest of Middle East and Africa Open System MRI Industry Revenue (Million) Forecast, by Application 2019 & 2032
- Table 27: Global Open System MRI Industry Revenue Million Forecast, by Country 2019 & 2032
- Table 28: Brazil Open System MRI Industry Revenue (Million) Forecast, by Application 2019 & 2032
- Table 29: Argentina Open System MRI Industry Revenue (Million) Forecast, by Application 2019 & 2032
- Table 30: Rest of South America Open System MRI Industry Revenue (Million) Forecast, by Application 2019 & 2032
- Table 31: Global Open System MRI Industry Revenue Million Forecast, by Resolution 2019 & 2032
- Table 32: Global Open System MRI Industry Revenue Million Forecast, by Application 2019 & 2032
- Table 33: Global Open System MRI Industry Revenue Million Forecast, by Country 2019 & 2032
- Table 34: United States Open System MRI Industry Revenue (Million) Forecast, by Application 2019 & 2032
- Table 35: Canada Open System MRI Industry Revenue (Million) Forecast, by Application 2019 & 2032
- Table 36: Mexico Open System MRI Industry Revenue (Million) Forecast, by Application 2019 & 2032
- Table 37: Global Open System MRI Industry Revenue Million Forecast, by Resolution 2019 & 2032
- Table 38: Global Open System MRI Industry Revenue Million Forecast, by Application 2019 & 2032
- Table 39: Global Open System MRI Industry Revenue Million Forecast, by Country 2019 & 2032
- Table 40: Germany Open System MRI Industry Revenue (Million) Forecast, by Application 2019 & 2032
- Table 41: United Kingdom Open System MRI Industry Revenue (Million) Forecast, by Application 2019 & 2032
- Table 42: France Open System MRI Industry Revenue (Million) Forecast, by Application 2019 & 2032
- Table 43: Italy Open System MRI Industry Revenue (Million) Forecast, by Application 2019 & 2032
- Table 44: Spain Open System MRI Industry Revenue (Million) Forecast, by Application 2019 & 2032
- Table 45: Rest of Europe Open System MRI Industry Revenue (Million) Forecast, by Application 2019 & 2032
- Table 46: Global Open System MRI Industry Revenue Million Forecast, by Resolution 2019 & 2032
- Table 47: Global Open System MRI Industry Revenue Million Forecast, by Application 2019 & 2032
- Table 48: Global Open System MRI Industry Revenue Million Forecast, by Country 2019 & 2032
- Table 49: China Open System MRI Industry Revenue (Million) Forecast, by Application 2019 & 2032
- Table 50: Japan Open System MRI Industry Revenue (Million) Forecast, by Application 2019 & 2032
- Table 51: India Open System MRI Industry Revenue (Million) Forecast, by Application 2019 & 2032
- Table 52: Australia Open System MRI Industry Revenue (Million) Forecast, by Application 2019 & 2032
- Table 53: South Korea Open System MRI Industry Revenue (Million) Forecast, by Application 2019 & 2032
- Table 54: Rest of Asia Pacific Open System MRI Industry Revenue (Million) Forecast, by Application 2019 & 2032
- Table 55: Global Open System MRI Industry Revenue Million Forecast, by Resolution 2019 & 2032
- Table 56: Global Open System MRI Industry Revenue Million Forecast, by Application 2019 & 2032
- Table 57: Global Open System MRI Industry Revenue Million Forecast, by Country 2019 & 2032
- Table 58: GCC Open System MRI Industry Revenue (Million) Forecast, by Application 2019 & 2032
- Table 59: South Africa Open System MRI Industry Revenue (Million) Forecast, by Application 2019 & 2032
- Table 60: Rest of Middle East and Africa Open System MRI Industry Revenue (Million) Forecast, by Application 2019 & 2032
- Table 61: Global Open System MRI Industry Revenue Million Forecast, by Resolution 2019 & 2032
- Table 62: Global Open System MRI Industry Revenue Million Forecast, by Application 2019 & 2032
- Table 63: Global Open System MRI Industry Revenue Million Forecast, by Country 2019 & 2032
- Table 64: Brazil Open System MRI Industry Revenue (Million) Forecast, by Application 2019 & 2032
- Table 65: Argentina Open System MRI Industry Revenue (Million) Forecast, by Application 2019 & 2032
- Table 66: Rest of South America Open System MRI Industry Revenue (Million) Forecast, by Application 2019 & 2032
Frequently Asked Questions
1. What is the projected Compound Annual Growth Rate (CAGR) of the Open System MRI Industry?
The projected CAGR is approximately 5.88%.
2. Which companies are prominent players in the Open System MRI Industry?
Key companies in the market include ESAOTE SA, Barco N V, Siemens Healthcare, Nordion Inc, Toshiba Corporation, Hologic Inc, GE Healthcare, Philips Healthcare, Hitachi Medical Corporation, Canon Medical Systems Corporation, Onex Corporation (Carestream Health), Shimadzu Corporation.
3. What are the main segments of the Open System MRI Industry?
The market segments include Resolution, Application.
4. Can you provide details about the market size?
The market size is estimated to be USD 1.54 Million as of 2022.
5. What are some drivers contributing to market growth?
Increasing Number of MRI Procedures; Technological Developments in Open MRI System.
6. What are the notable trends driving market growth?
Neurology Segment is Expected to Witness Significant Growth Over the Forecast Period..
7. Are there any restraints impacting market growth?
High Cost of Open MRI Systems.
8. Can you provide examples of recent developments in the market?
January 2023: Esaote North America, Inc. launched the Magnifico Vet Open MRI system, a new imaging solution uniquely suited to provide diagnostic efficacy in a variety of veterinary hospitals.
9. What pricing options are available for accessing the report?
Pricing options include single-user, multi-user, and enterprise licenses priced at USD 4750, USD 5250, and USD 8750 respectively.
10. Is the market size provided in terms of value or volume?
The market size is provided in terms of value, measured in Million.
11. Are there any specific market keywords associated with the report?
Yes, the market keyword associated with the report is "Open System MRI Industry," which aids in identifying and referencing the specific market segment covered.
12. How do I determine which pricing option suits my needs best?
The pricing options vary based on user requirements and access needs. Individual users may opt for single-user licenses, while businesses requiring broader access may choose multi-user or enterprise licenses for cost-effective access to the report.
13. Are there any additional resources or data provided in the Open System MRI Industry report?
While the report offers comprehensive insights, it's advisable to review the specific contents or supplementary materials provided to ascertain if additional resources or data are available.
14. How can I stay updated on further developments or reports in the Open System MRI Industry?
To stay informed about further developments, trends, and reports in the Open System MRI Industry, consider subscribing to industry newsletters, following relevant companies and organizations, or regularly checking reputable industry news sources and publications.
Methodology
Step 1 - Identification of Relevant Samples Size from Population Database


Step 2 - Approaches for Defining Global Market Size (Value, Volume* & Price*)

Note*: In applicable scenarios
Step 3 - Data Sources
Primary Research
- Web Analytics
- Survey Reports
- Research Institute
- Latest Research Reports
- Opinion Leaders
Secondary Research
- Annual Reports
- White Paper
- Latest Press Release
- Industry Association
- Paid Database
- Investor Presentations

Step 4 - Data Triangulation
Involves using different sources of information in order to increase the validity of a study
These sources are likely to be stakeholders in a program - participants, other researchers, program staff, other community members, and so on.
Then we put all data in single framework & apply various statistical tools to find out the dynamic on the market.
During the analysis stage, feedback from the stakeholder groups would be compared to determine areas of agreement as well as areas of divergence
