

Key Insights
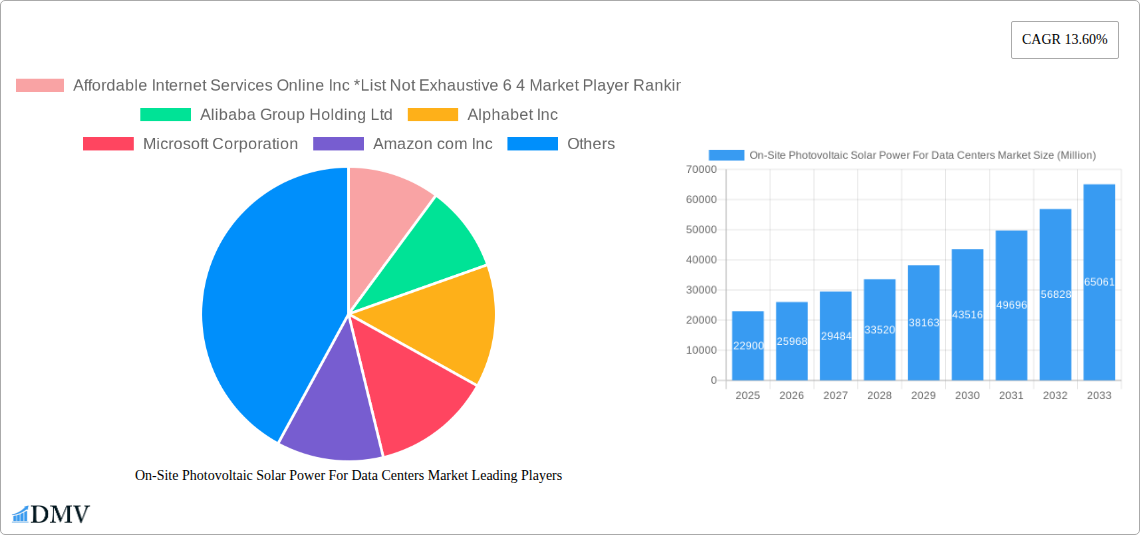
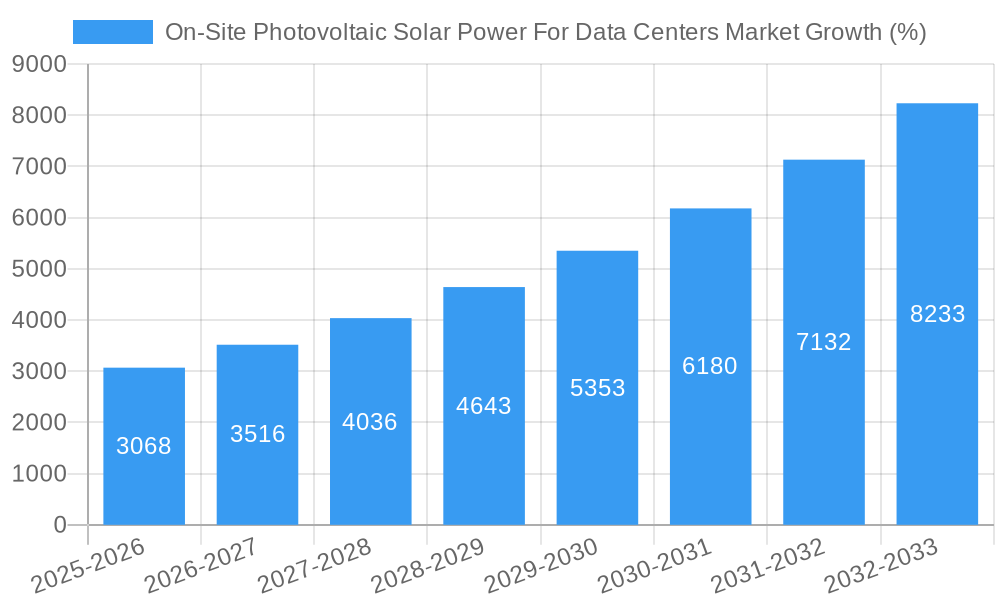
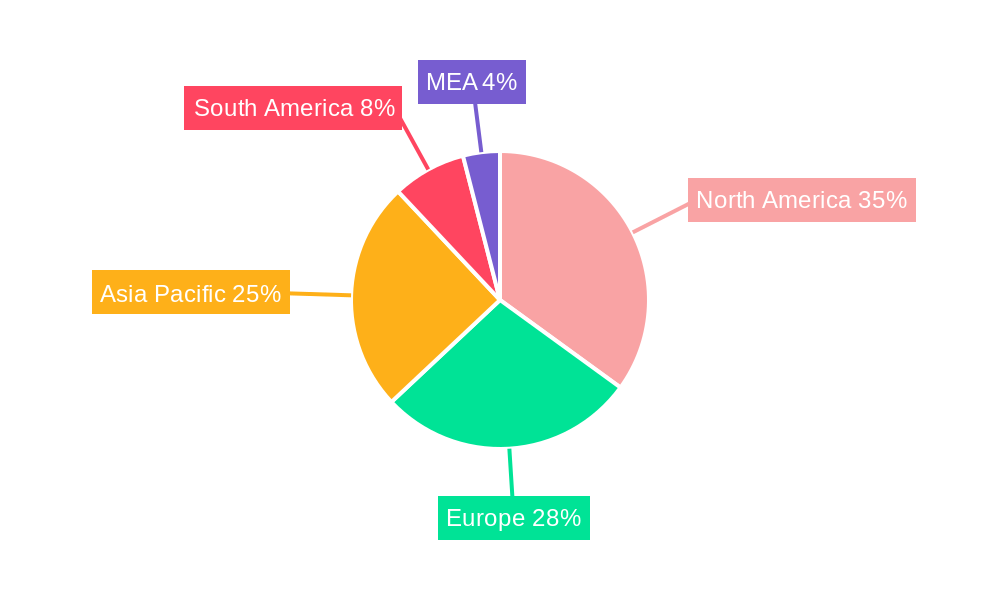
The On-Site Photovoltaic Solar Power for Data Centers market is experiencing robust growth, projected to reach \$22.90 billion in 2025 and exhibiting a Compound Annual Growth Rate (CAGR) of 13.60% from 2025 to 2033. This expansion is driven by the increasing demand for renewable energy sources within the data center industry, coupled with rising concerns about carbon footprint reduction and escalating electricity costs. The rising adoption of thin-film and crystalline solar cells, tailored for data center applications, fuels this growth. Key applications include powering data centers directly, supplementing grid power for telecom towers, and powering other commercial applications. Leading market players such as Alibaba, Alphabet, Microsoft, Amazon, Facebook, and Dell Technologies are actively investing in and deploying on-site solar solutions, demonstrating the market's viability and future potential. Geographic distribution reveals strong growth in North America and Asia-Pacific, driven by supportive government policies, technological advancements, and large-scale data center deployments in these regions. However, initial investment costs and the intermittent nature of solar power remain key restraints, necessitating further advancements in energy storage solutions and grid integration technologies to fully unlock the market's potential.
The market segmentation highlights the dominance of crystalline solar cells due to their higher efficiency, but thin-film solar cells are gaining traction due to their cost-effectiveness and flexibility in application. The data center segment is the largest application area, driven by the substantial energy consumption of these facilities. Growth is further fueled by the increasing awareness of environmental, social, and governance (ESG) factors among data center operators and the potential for cost savings through reduced electricity bills. Future growth will depend on continued technological innovation in solar cell efficiency, energy storage capabilities, and smart grid integration, alongside supportive government policies and incentives that encourage renewable energy adoption within the data center sector. Competition amongst established tech giants and emerging solar technology providers will further shape the market landscape in the coming years.
On-Site Photovoltaic Solar Power For Data Centers Market: A Comprehensive Report (2019-2033)
This insightful report delivers a comprehensive analysis of the On-Site Photovoltaic Solar Power for Data Centers market, providing crucial insights for stakeholders seeking to navigate this rapidly evolving landscape. Covering the period 2019-2033, with a focus on 2025, this study unveils market dynamics, technological advancements, and key player strategies, offering a robust forecast for future growth. The market is projected to reach xx Million by 2033, driven by increasing demand for sustainable energy solutions and stringent environmental regulations.
On-Site Photovoltaic Solar Power For Data Centers Market Market Composition & Trends
This section meticulously dissects the market's structure, analyzing factors shaping its trajectory. We examine market concentration, revealing the share distribution among key players like Alibaba Group Holding Ltd, Alphabet Inc, Microsoft Corporation, Amazon com Inc, Facebook Inc, and Dell Technologies Inc, alongside emerging players such as Affordable Internet Services Online Inc. Innovation catalysts, including advancements in solar cell technology and energy storage solutions, are explored alongside the regulatory landscape influencing market adoption. Analysis of substitute products, end-user profiles (primarily data centers, telecom towers, and other commercial applications), and recent M&A activities, including deal values (estimated at xx Million annually), paint a complete picture of the competitive dynamics.
- Market Concentration: Highly fragmented, with the top 6 players holding an estimated xx% market share in 2025.
- Innovation Catalysts: Advancements in thin-film and crystalline solar cell efficiencies, improved energy storage solutions.
- Regulatory Landscape: Government incentives, carbon emission reduction targets, and renewable energy mandates are driving market growth.
- Substitute Products: Traditional grid electricity, other renewable energy sources (wind, hydro).
- M&A Activity: Significant M&A activity observed in recent years, with deals averaging xx Million in value.
On-Site Photovoltaic Solar Power For Data Centers Market Industry Evolution
This section provides a detailed examination of the market's growth trajectory from 2019 to 2033. We analyze historical growth rates (xx% CAGR from 2019-2024), projected growth rates (xx% CAGR from 2025-2033), and factors influencing these trends. Technological advancements, such as the development of more efficient solar cells and improved energy storage systems, are detailed, alongside shifting consumer demands towards sustainable and cost-effective energy solutions. The growing awareness of carbon footprint reduction among data center operators is a key factor driving adoption. Specific data points illustrating adoption rates across various segments and regions are provided, offering a complete picture of market evolution.
Leading Regions, Countries, or Segments in On-Site Photovoltaic Solar Power For Data Centers Market
This section identifies the leading regions, countries, and segments within the On-Site Photovoltaic Solar Power for Data Centers market. We analyze dominance factors for each, considering market size, growth potential, and specific market drivers. The analysis focuses on the two key segments: Type (Thin-film solar cells and crystalline solar cells) and Application (data centers, telecom towers, and other commercial applications).
- Key Drivers:
- Investment Trends: Significant investments in renewable energy infrastructure and government incentives.
- Regulatory Support: Favorable policies and regulations promoting the adoption of solar energy.
- Technological Advancements: Improvements in solar cell efficiency and cost reductions.
- Dominance Factors: High energy consumption by data centers in specific regions, combined with supportive government policies, contributes to regional dominance. Crystalline solar cells currently hold a larger market share due to higher efficiency, although thin-film technology is gaining traction.
On-Site Photovoltaic Solar Power For Data Centers Market Product Innovations
Recent product innovations focus on increasing efficiency, reducing costs, and enhancing durability. This includes advancements in bifacial solar panels, higher-efficiency solar cells, and integrated energy storage solutions, offering improved performance and unique selling propositions. The integration of AI-powered monitoring systems and predictive maintenance features are also improving the efficiency and reliability of on-site solar power systems for data centers.
Propelling Factors for On-Site Photovoltaic Solar Power For Data Centers Market Growth
Several key factors drive market growth. These include the increasing awareness of environmental sustainability among data center operators, coupled with the rising cost of grid electricity. Stringent environmental regulations and government incentives for renewable energy adoption further propel market expansion. The decreasing cost of solar technology also makes it a more attractive option for data centers.
Obstacles in the On-Site Photovoltaic Solar Power For Data Centers Market Market
Despite the positive trends, several challenges hinder market growth. High initial investment costs for solar installations can act as a barrier for smaller data centers. Supply chain disruptions, especially related to raw materials for solar panel manufacturing, can impact project timelines and costs. Furthermore, intermittency of solar power and the need for robust energy storage solutions present technical challenges.
Future Opportunities in On-Site Photovoltaic Solar Power For Data Centers Market
Future opportunities lie in expanding into emerging markets with high data center density and supportive government policies. Technological advancements, such as advancements in perovskite solar cells and improved energy storage solutions, will further enhance the cost-effectiveness and reliability of on-site solar power for data centers. Exploring new business models, like power purchase agreements (PPAs), can facilitate wider adoption.
Major Players in the On-Site Photovoltaic Solar Power For Data Centers Market Ecosystem
- Alibaba Group Holding Ltd
- Alphabet Inc
- Microsoft Corporation
- Amazon com Inc
- Facebook Inc
- Dell Technologies Inc
- Affordable Internet Services Online Inc
Key Developments in On-Site Photovoltaic Solar Power For Data Centers Market Industry
- September 2023: Power Capital Renewable Energy (PCRE) signs a 58 MW PPA with Google for powering its Irish data center and offices.
- August 2023: SCC installs a 737kWp solar PV system at its Birmingham data center, covering over 5% of its energy needs.
Strategic On-Site Photovoltaic Solar Power For Data Centers Market Market Forecast
The On-Site Photovoltaic Solar Power for Data Centers market is poised for substantial growth in the coming years. Driven by increasing demand for sustainable energy, technological advancements, and supportive government policies, this market is expected to witness significant expansion. The focus on reducing carbon emissions, coupled with the decreasing cost of solar technology, will create further opportunities for market growth. The adoption of innovative business models and strategic partnerships will play a crucial role in shaping the future of this dynamic sector.
On-Site Photovoltaic Solar Power For Data Centers Market Segmentation
- 1. Production Analysis
- 2. Consumption Analysis
- 3. Import Market Analysis (Value & Volume)
- 4. Export Market Analysis (Value & Volume)
- 5. Price Trend Analysis
On-Site Photovoltaic Solar Power For Data Centers Market Segmentation By Geography
-
1. North America
- 1.1. United States
- 1.2. Canada
- 1.3. Rest of North America
-
2. Europe
- 2.1. Germany
- 2.2. France
- 2.3. United Kingdom
- 2.4. Italy
- 2.5. Spain
- 2.6. NORDIC
- 2.7. Turkey
- 2.8. Russia
- 2.9. Rest of Europe
-
3. Asia Pacific
- 3.1. China
- 3.2. India
- 3.3. Japan
- 3.4. Australia
- 3.5. Malaysia
- 3.6. Thailand
- 3.7. Indonesia
- 3.8. Vietnam
- 3.9. Rest of Asia Pacific
-
4. South America
- 4.1. Brazil
- 4.2. Argentina
- 4.3. Chile
- 4.4. Colombia
- 4.5. Rest of South America
-
5. Middle East and Africa
- 5.1. United Arab Emirates
- 5.2. Qatar
- 5.3. Saudi Arabia
- 5.4. South Africa
- 5.5. Nigeria
- 5.6. Egypt
On-Site Photovoltaic Solar Power For Data Centers Market REPORT HIGHLIGHTS
| Aspects | Details |
|---|---|
| Study Period | 2019-2033 |
| Base Year | 2024 |
| Estimated Year | 2025 |
| Forecast Period | 2025-2033 |
| Historical Period | 2019-2024 |
| Growth Rate | CAGR of 13.60% from 2019-2033 |
| Segmentation |
|
Table of Contents
- 1. Introduction
- 1.1. Research Scope
- 1.2. Market Segmentation
- 1.3. Research Methodology
- 1.4. Definitions and Assumptions
- 2. Executive Summary
- 2.1. Introduction
- 3. Market Dynamics
- 3.1. Introduction
- 3.2. Market Drivers
- 3.2.1. 4.; Decreasing Solar Power Installation Costs 4.; Growing focus on Implementing Sustainable Business Practices
- 3.3. Market Restrains
- 3.3.1. 4.; Lack of Space for Small Data Centers to Install Solar Panels
- 3.4. Market Trends
- 3.4.1. Decrease in Solar Power Installation Cost is Likely to Drive the Market
- 4. Market Factor Analysis
- 4.1. Porters Five Forces
- 4.2. Supply/Value Chain
- 4.3. PESTEL analysis
- 4.4. Market Entropy
- 4.5. Patent/Trademark Analysis
- 5. Global On-Site Photovoltaic Solar Power For Data Centers Market Analysis, Insights and Forecast, 2019-2031
- 5.1. Market Analysis, Insights and Forecast - by Production Analysis
- 5.2. Market Analysis, Insights and Forecast - by Consumption Analysis
- 5.3. Market Analysis, Insights and Forecast - by Import Market Analysis (Value & Volume)
- 5.4. Market Analysis, Insights and Forecast - by Export Market Analysis (Value & Volume)
- 5.5. Market Analysis, Insights and Forecast - by Price Trend Analysis
- 5.6. Market Analysis, Insights and Forecast - by Region
- 5.6.1. North America
- 5.6.2. Europe
- 5.6.3. Asia Pacific
- 5.6.4. South America
- 5.6.5. Middle East and Africa
- 5.1. Market Analysis, Insights and Forecast - by Production Analysis
- 6. North America On-Site Photovoltaic Solar Power For Data Centers Market Analysis, Insights and Forecast, 2019-2031
- 6.1. Market Analysis, Insights and Forecast - by Production Analysis
- 6.2. Market Analysis, Insights and Forecast - by Consumption Analysis
- 6.3. Market Analysis, Insights and Forecast - by Import Market Analysis (Value & Volume)
- 6.4. Market Analysis, Insights and Forecast - by Export Market Analysis (Value & Volume)
- 6.5. Market Analysis, Insights and Forecast - by Price Trend Analysis
- 6.1. Market Analysis, Insights and Forecast - by Production Analysis
- 7. Europe On-Site Photovoltaic Solar Power For Data Centers Market Analysis, Insights and Forecast, 2019-2031
- 7.1. Market Analysis, Insights and Forecast - by Production Analysis
- 7.2. Market Analysis, Insights and Forecast - by Consumption Analysis
- 7.3. Market Analysis, Insights and Forecast - by Import Market Analysis (Value & Volume)
- 7.4. Market Analysis, Insights and Forecast - by Export Market Analysis (Value & Volume)
- 7.5. Market Analysis, Insights and Forecast - by Price Trend Analysis
- 7.1. Market Analysis, Insights and Forecast - by Production Analysis
- 8. Asia Pacific On-Site Photovoltaic Solar Power For Data Centers Market Analysis, Insights and Forecast, 2019-2031
- 8.1. Market Analysis, Insights and Forecast - by Production Analysis
- 8.2. Market Analysis, Insights and Forecast - by Consumption Analysis
- 8.3. Market Analysis, Insights and Forecast - by Import Market Analysis (Value & Volume)
- 8.4. Market Analysis, Insights and Forecast - by Export Market Analysis (Value & Volume)
- 8.5. Market Analysis, Insights and Forecast - by Price Trend Analysis
- 8.1. Market Analysis, Insights and Forecast - by Production Analysis
- 9. South America On-Site Photovoltaic Solar Power For Data Centers Market Analysis, Insights and Forecast, 2019-2031
- 9.1. Market Analysis, Insights and Forecast - by Production Analysis
- 9.2. Market Analysis, Insights and Forecast - by Consumption Analysis
- 9.3. Market Analysis, Insights and Forecast - by Import Market Analysis (Value & Volume)
- 9.4. Market Analysis, Insights and Forecast - by Export Market Analysis (Value & Volume)
- 9.5. Market Analysis, Insights and Forecast - by Price Trend Analysis
- 9.1. Market Analysis, Insights and Forecast - by Production Analysis
- 10. Middle East and Africa On-Site Photovoltaic Solar Power For Data Centers Market Analysis, Insights and Forecast, 2019-2031
- 10.1. Market Analysis, Insights and Forecast - by Production Analysis
- 10.2. Market Analysis, Insights and Forecast - by Consumption Analysis
- 10.3. Market Analysis, Insights and Forecast - by Import Market Analysis (Value & Volume)
- 10.4. Market Analysis, Insights and Forecast - by Export Market Analysis (Value & Volume)
- 10.5. Market Analysis, Insights and Forecast - by Price Trend Analysis
- 10.1. Market Analysis, Insights and Forecast - by Production Analysis
- 11. North America On-Site Photovoltaic Solar Power For Data Centers Market Analysis, Insights and Forecast, 2019-2031
- 11.1. Market Analysis, Insights and Forecast - By Country/Sub-region
- 11.1.1 United States
- 11.1.2 Canada
- 11.1.3 Mexico
- 12. Europe On-Site Photovoltaic Solar Power For Data Centers Market Analysis, Insights and Forecast, 2019-2031
- 12.1. Market Analysis, Insights and Forecast - By Country/Sub-region
- 12.1.1 Germany
- 12.1.2 United Kingdom
- 12.1.3 France
- 12.1.4 Spain
- 12.1.5 Italy
- 12.1.6 Spain
- 12.1.7 Belgium
- 12.1.8 Netherland
- 12.1.9 Nordics
- 12.1.10 Rest of Europe
- 13. Asia Pacific On-Site Photovoltaic Solar Power For Data Centers Market Analysis, Insights and Forecast, 2019-2031
- 13.1. Market Analysis, Insights and Forecast - By Country/Sub-region
- 13.1.1 China
- 13.1.2 Japan
- 13.1.3 India
- 13.1.4 South Korea
- 13.1.5 Southeast Asia
- 13.1.6 Australia
- 13.1.7 Indonesia
- 13.1.8 Phillipes
- 13.1.9 Singapore
- 13.1.10 Thailandc
- 13.1.11 Rest of Asia Pacific
- 14. South America On-Site Photovoltaic Solar Power For Data Centers Market Analysis, Insights and Forecast, 2019-2031
- 14.1. Market Analysis, Insights and Forecast - By Country/Sub-region
- 14.1.1 Brazil
- 14.1.2 Argentina
- 14.1.3 Peru
- 14.1.4 Chile
- 14.1.5 Colombia
- 14.1.6 Ecuador
- 14.1.7 Venezuela
- 14.1.8 Rest of South America
- 15. MEA On-Site Photovoltaic Solar Power For Data Centers Market Analysis, Insights and Forecast, 2019-2031
- 15.1. Market Analysis, Insights and Forecast - By Country/Sub-region
- 15.1.1 United Arab Emirates
- 15.1.2 Saudi Arabia
- 15.1.3 South Africa
- 15.1.4 Rest of Middle East and Africa
- 16. Competitive Analysis
- 16.1. Global Market Share Analysis 2024
- 16.2. Company Profiles
- 16.2.1 Affordable Internet Services Online Inc *List Not Exhaustive 6 4 Market Player Rankin
- 16.2.1.1. Overview
- 16.2.1.2. Products
- 16.2.1.3. SWOT Analysis
- 16.2.1.4. Recent Developments
- 16.2.1.5. Financials (Based on Availability)
- 16.2.2 Alibaba Group Holding Ltd
- 16.2.2.1. Overview
- 16.2.2.2. Products
- 16.2.2.3. SWOT Analysis
- 16.2.2.4. Recent Developments
- 16.2.2.5. Financials (Based on Availability)
- 16.2.3 Alphabet Inc
- 16.2.3.1. Overview
- 16.2.3.2. Products
- 16.2.3.3. SWOT Analysis
- 16.2.3.4. Recent Developments
- 16.2.3.5. Financials (Based on Availability)
- 16.2.4 Microsoft Corporation
- 16.2.4.1. Overview
- 16.2.4.2. Products
- 16.2.4.3. SWOT Analysis
- 16.2.4.4. Recent Developments
- 16.2.4.5. Financials (Based on Availability)
- 16.2.5 Amazon com Inc
- 16.2.5.1. Overview
- 16.2.5.2. Products
- 16.2.5.3. SWOT Analysis
- 16.2.5.4. Recent Developments
- 16.2.5.5. Financials (Based on Availability)
- 16.2.6 Facebook Inc
- 16.2.6.1. Overview
- 16.2.6.2. Products
- 16.2.6.3. SWOT Analysis
- 16.2.6.4. Recent Developments
- 16.2.6.5. Financials (Based on Availability)
- 16.2.7 Dell Technologies Inc
- 16.2.7.1. Overview
- 16.2.7.2. Products
- 16.2.7.3. SWOT Analysis
- 16.2.7.4. Recent Developments
- 16.2.7.5. Financials (Based on Availability)
- 16.2.1 Affordable Internet Services Online Inc *List Not Exhaustive 6 4 Market Player Rankin
List of Figures
- Figure 1: Global On-Site Photovoltaic Solar Power For Data Centers Market Revenue Breakdown (Million, %) by Region 2024 & 2032
- Figure 2: North America On-Site Photovoltaic Solar Power For Data Centers Market Revenue (Million), by Country 2024 & 2032
- Figure 3: North America On-Site Photovoltaic Solar Power For Data Centers Market Revenue Share (%), by Country 2024 & 2032
- Figure 4: Europe On-Site Photovoltaic Solar Power For Data Centers Market Revenue (Million), by Country 2024 & 2032
- Figure 5: Europe On-Site Photovoltaic Solar Power For Data Centers Market Revenue Share (%), by Country 2024 & 2032
- Figure 6: Asia Pacific On-Site Photovoltaic Solar Power For Data Centers Market Revenue (Million), by Country 2024 & 2032
- Figure 7: Asia Pacific On-Site Photovoltaic Solar Power For Data Centers Market Revenue Share (%), by Country 2024 & 2032
- Figure 8: South America On-Site Photovoltaic Solar Power For Data Centers Market Revenue (Million), by Country 2024 & 2032
- Figure 9: South America On-Site Photovoltaic Solar Power For Data Centers Market Revenue Share (%), by Country 2024 & 2032
- Figure 10: MEA On-Site Photovoltaic Solar Power For Data Centers Market Revenue (Million), by Country 2024 & 2032
- Figure 11: MEA On-Site Photovoltaic Solar Power For Data Centers Market Revenue Share (%), by Country 2024 & 2032
- Figure 12: North America On-Site Photovoltaic Solar Power For Data Centers Market Revenue (Million), by Production Analysis 2024 & 2032
- Figure 13: North America On-Site Photovoltaic Solar Power For Data Centers Market Revenue Share (%), by Production Analysis 2024 & 2032
- Figure 14: North America On-Site Photovoltaic Solar Power For Data Centers Market Revenue (Million), by Consumption Analysis 2024 & 2032
- Figure 15: North America On-Site Photovoltaic Solar Power For Data Centers Market Revenue Share (%), by Consumption Analysis 2024 & 2032
- Figure 16: North America On-Site Photovoltaic Solar Power For Data Centers Market Revenue (Million), by Import Market Analysis (Value & Volume) 2024 & 2032
- Figure 17: North America On-Site Photovoltaic Solar Power For Data Centers Market Revenue Share (%), by Import Market Analysis (Value & Volume) 2024 & 2032
- Figure 18: North America On-Site Photovoltaic Solar Power For Data Centers Market Revenue (Million), by Export Market Analysis (Value & Volume) 2024 & 2032
- Figure 19: North America On-Site Photovoltaic Solar Power For Data Centers Market Revenue Share (%), by Export Market Analysis (Value & Volume) 2024 & 2032
- Figure 20: North America On-Site Photovoltaic Solar Power For Data Centers Market Revenue (Million), by Price Trend Analysis 2024 & 2032
- Figure 21: North America On-Site Photovoltaic Solar Power For Data Centers Market Revenue Share (%), by Price Trend Analysis 2024 & 2032
- Figure 22: North America On-Site Photovoltaic Solar Power For Data Centers Market Revenue (Million), by Country 2024 & 2032
- Figure 23: North America On-Site Photovoltaic Solar Power For Data Centers Market Revenue Share (%), by Country 2024 & 2032
- Figure 24: Europe On-Site Photovoltaic Solar Power For Data Centers Market Revenue (Million), by Production Analysis 2024 & 2032
- Figure 25: Europe On-Site Photovoltaic Solar Power For Data Centers Market Revenue Share (%), by Production Analysis 2024 & 2032
- Figure 26: Europe On-Site Photovoltaic Solar Power For Data Centers Market Revenue (Million), by Consumption Analysis 2024 & 2032
- Figure 27: Europe On-Site Photovoltaic Solar Power For Data Centers Market Revenue Share (%), by Consumption Analysis 2024 & 2032
- Figure 28: Europe On-Site Photovoltaic Solar Power For Data Centers Market Revenue (Million), by Import Market Analysis (Value & Volume) 2024 & 2032
- Figure 29: Europe On-Site Photovoltaic Solar Power For Data Centers Market Revenue Share (%), by Import Market Analysis (Value & Volume) 2024 & 2032
- Figure 30: Europe On-Site Photovoltaic Solar Power For Data Centers Market Revenue (Million), by Export Market Analysis (Value & Volume) 2024 & 2032
- Figure 31: Europe On-Site Photovoltaic Solar Power For Data Centers Market Revenue Share (%), by Export Market Analysis (Value & Volume) 2024 & 2032
- Figure 32: Europe On-Site Photovoltaic Solar Power For Data Centers Market Revenue (Million), by Price Trend Analysis 2024 & 2032
- Figure 33: Europe On-Site Photovoltaic Solar Power For Data Centers Market Revenue Share (%), by Price Trend Analysis 2024 & 2032
- Figure 34: Europe On-Site Photovoltaic Solar Power For Data Centers Market Revenue (Million), by Country 2024 & 2032
- Figure 35: Europe On-Site Photovoltaic Solar Power For Data Centers Market Revenue Share (%), by Country 2024 & 2032
- Figure 36: Asia Pacific On-Site Photovoltaic Solar Power For Data Centers Market Revenue (Million), by Production Analysis 2024 & 2032
- Figure 37: Asia Pacific On-Site Photovoltaic Solar Power For Data Centers Market Revenue Share (%), by Production Analysis 2024 & 2032
- Figure 38: Asia Pacific On-Site Photovoltaic Solar Power For Data Centers Market Revenue (Million), by Consumption Analysis 2024 & 2032
- Figure 39: Asia Pacific On-Site Photovoltaic Solar Power For Data Centers Market Revenue Share (%), by Consumption Analysis 2024 & 2032
- Figure 40: Asia Pacific On-Site Photovoltaic Solar Power For Data Centers Market Revenue (Million), by Import Market Analysis (Value & Volume) 2024 & 2032
- Figure 41: Asia Pacific On-Site Photovoltaic Solar Power For Data Centers Market Revenue Share (%), by Import Market Analysis (Value & Volume) 2024 & 2032
- Figure 42: Asia Pacific On-Site Photovoltaic Solar Power For Data Centers Market Revenue (Million), by Export Market Analysis (Value & Volume) 2024 & 2032
- Figure 43: Asia Pacific On-Site Photovoltaic Solar Power For Data Centers Market Revenue Share (%), by Export Market Analysis (Value & Volume) 2024 & 2032
- Figure 44: Asia Pacific On-Site Photovoltaic Solar Power For Data Centers Market Revenue (Million), by Price Trend Analysis 2024 & 2032
- Figure 45: Asia Pacific On-Site Photovoltaic Solar Power For Data Centers Market Revenue Share (%), by Price Trend Analysis 2024 & 2032
- Figure 46: Asia Pacific On-Site Photovoltaic Solar Power For Data Centers Market Revenue (Million), by Country 2024 & 2032
- Figure 47: Asia Pacific On-Site Photovoltaic Solar Power For Data Centers Market Revenue Share (%), by Country 2024 & 2032
- Figure 48: South America On-Site Photovoltaic Solar Power For Data Centers Market Revenue (Million), by Production Analysis 2024 & 2032
- Figure 49: South America On-Site Photovoltaic Solar Power For Data Centers Market Revenue Share (%), by Production Analysis 2024 & 2032
- Figure 50: South America On-Site Photovoltaic Solar Power For Data Centers Market Revenue (Million), by Consumption Analysis 2024 & 2032
- Figure 51: South America On-Site Photovoltaic Solar Power For Data Centers Market Revenue Share (%), by Consumption Analysis 2024 & 2032
- Figure 52: South America On-Site Photovoltaic Solar Power For Data Centers Market Revenue (Million), by Import Market Analysis (Value & Volume) 2024 & 2032
- Figure 53: South America On-Site Photovoltaic Solar Power For Data Centers Market Revenue Share (%), by Import Market Analysis (Value & Volume) 2024 & 2032
- Figure 54: South America On-Site Photovoltaic Solar Power For Data Centers Market Revenue (Million), by Export Market Analysis (Value & Volume) 2024 & 2032
- Figure 55: South America On-Site Photovoltaic Solar Power For Data Centers Market Revenue Share (%), by Export Market Analysis (Value & Volume) 2024 & 2032
- Figure 56: South America On-Site Photovoltaic Solar Power For Data Centers Market Revenue (Million), by Price Trend Analysis 2024 & 2032
- Figure 57: South America On-Site Photovoltaic Solar Power For Data Centers Market Revenue Share (%), by Price Trend Analysis 2024 & 2032
- Figure 58: South America On-Site Photovoltaic Solar Power For Data Centers Market Revenue (Million), by Country 2024 & 2032
- Figure 59: South America On-Site Photovoltaic Solar Power For Data Centers Market Revenue Share (%), by Country 2024 & 2032
- Figure 60: Middle East and Africa On-Site Photovoltaic Solar Power For Data Centers Market Revenue (Million), by Production Analysis 2024 & 2032
- Figure 61: Middle East and Africa On-Site Photovoltaic Solar Power For Data Centers Market Revenue Share (%), by Production Analysis 2024 & 2032
- Figure 62: Middle East and Africa On-Site Photovoltaic Solar Power For Data Centers Market Revenue (Million), by Consumption Analysis 2024 & 2032
- Figure 63: Middle East and Africa On-Site Photovoltaic Solar Power For Data Centers Market Revenue Share (%), by Consumption Analysis 2024 & 2032
- Figure 64: Middle East and Africa On-Site Photovoltaic Solar Power For Data Centers Market Revenue (Million), by Import Market Analysis (Value & Volume) 2024 & 2032
- Figure 65: Middle East and Africa On-Site Photovoltaic Solar Power For Data Centers Market Revenue Share (%), by Import Market Analysis (Value & Volume) 2024 & 2032
- Figure 66: Middle East and Africa On-Site Photovoltaic Solar Power For Data Centers Market Revenue (Million), by Export Market Analysis (Value & Volume) 2024 & 2032
- Figure 67: Middle East and Africa On-Site Photovoltaic Solar Power For Data Centers Market Revenue Share (%), by Export Market Analysis (Value & Volume) 2024 & 2032
- Figure 68: Middle East and Africa On-Site Photovoltaic Solar Power For Data Centers Market Revenue (Million), by Price Trend Analysis 2024 & 2032
- Figure 69: Middle East and Africa On-Site Photovoltaic Solar Power For Data Centers Market Revenue Share (%), by Price Trend Analysis 2024 & 2032
- Figure 70: Middle East and Africa On-Site Photovoltaic Solar Power For Data Centers Market Revenue (Million), by Country 2024 & 2032
- Figure 71: Middle East and Africa On-Site Photovoltaic Solar Power For Data Centers Market Revenue Share (%), by Country 2024 & 2032
List of Tables
- Table 1: Global On-Site Photovoltaic Solar Power For Data Centers Market Revenue Million Forecast, by Region 2019 & 2032
- Table 2: Global On-Site Photovoltaic Solar Power For Data Centers Market Revenue Million Forecast, by Production Analysis 2019 & 2032
- Table 3: Global On-Site Photovoltaic Solar Power For Data Centers Market Revenue Million Forecast, by Consumption Analysis 2019 & 2032
- Table 4: Global On-Site Photovoltaic Solar Power For Data Centers Market Revenue Million Forecast, by Import Market Analysis (Value & Volume) 2019 & 2032
- Table 5: Global On-Site Photovoltaic Solar Power For Data Centers Market Revenue Million Forecast, by Export Market Analysis (Value & Volume) 2019 & 2032
- Table 6: Global On-Site Photovoltaic Solar Power For Data Centers Market Revenue Million Forecast, by Price Trend Analysis 2019 & 2032
- Table 7: Global On-Site Photovoltaic Solar Power For Data Centers Market Revenue Million Forecast, by Region 2019 & 2032
- Table 8: Global On-Site Photovoltaic Solar Power For Data Centers Market Revenue Million Forecast, by Country 2019 & 2032
- Table 9: United States On-Site Photovoltaic Solar Power For Data Centers Market Revenue (Million) Forecast, by Application 2019 & 2032
- Table 10: Canada On-Site Photovoltaic Solar Power For Data Centers Market Revenue (Million) Forecast, by Application 2019 & 2032
- Table 11: Mexico On-Site Photovoltaic Solar Power For Data Centers Market Revenue (Million) Forecast, by Application 2019 & 2032
- Table 12: Global On-Site Photovoltaic Solar Power For Data Centers Market Revenue Million Forecast, by Country 2019 & 2032
- Table 13: Germany On-Site Photovoltaic Solar Power For Data Centers Market Revenue (Million) Forecast, by Application 2019 & 2032
- Table 14: United Kingdom On-Site Photovoltaic Solar Power For Data Centers Market Revenue (Million) Forecast, by Application 2019 & 2032
- Table 15: France On-Site Photovoltaic Solar Power For Data Centers Market Revenue (Million) Forecast, by Application 2019 & 2032
- Table 16: Spain On-Site Photovoltaic Solar Power For Data Centers Market Revenue (Million) Forecast, by Application 2019 & 2032
- Table 17: Italy On-Site Photovoltaic Solar Power For Data Centers Market Revenue (Million) Forecast, by Application 2019 & 2032
- Table 18: Spain On-Site Photovoltaic Solar Power For Data Centers Market Revenue (Million) Forecast, by Application 2019 & 2032
- Table 19: Belgium On-Site Photovoltaic Solar Power For Data Centers Market Revenue (Million) Forecast, by Application 2019 & 2032
- Table 20: Netherland On-Site Photovoltaic Solar Power For Data Centers Market Revenue (Million) Forecast, by Application 2019 & 2032
- Table 21: Nordics On-Site Photovoltaic Solar Power For Data Centers Market Revenue (Million) Forecast, by Application 2019 & 2032
- Table 22: Rest of Europe On-Site Photovoltaic Solar Power For Data Centers Market Revenue (Million) Forecast, by Application 2019 & 2032
- Table 23: Global On-Site Photovoltaic Solar Power For Data Centers Market Revenue Million Forecast, by Country 2019 & 2032
- Table 24: China On-Site Photovoltaic Solar Power For Data Centers Market Revenue (Million) Forecast, by Application 2019 & 2032
- Table 25: Japan On-Site Photovoltaic Solar Power For Data Centers Market Revenue (Million) Forecast, by Application 2019 & 2032
- Table 26: India On-Site Photovoltaic Solar Power For Data Centers Market Revenue (Million) Forecast, by Application 2019 & 2032
- Table 27: South Korea On-Site Photovoltaic Solar Power For Data Centers Market Revenue (Million) Forecast, by Application 2019 & 2032
- Table 28: Southeast Asia On-Site Photovoltaic Solar Power For Data Centers Market Revenue (Million) Forecast, by Application 2019 & 2032
- Table 29: Australia On-Site Photovoltaic Solar Power For Data Centers Market Revenue (Million) Forecast, by Application 2019 & 2032
- Table 30: Indonesia On-Site Photovoltaic Solar Power For Data Centers Market Revenue (Million) Forecast, by Application 2019 & 2032
- Table 31: Phillipes On-Site Photovoltaic Solar Power For Data Centers Market Revenue (Million) Forecast, by Application 2019 & 2032
- Table 32: Singapore On-Site Photovoltaic Solar Power For Data Centers Market Revenue (Million) Forecast, by Application 2019 & 2032
- Table 33: Thailandc On-Site Photovoltaic Solar Power For Data Centers Market Revenue (Million) Forecast, by Application 2019 & 2032
- Table 34: Rest of Asia Pacific On-Site Photovoltaic Solar Power For Data Centers Market Revenue (Million) Forecast, by Application 2019 & 2032
- Table 35: Global On-Site Photovoltaic Solar Power For Data Centers Market Revenue Million Forecast, by Country 2019 & 2032
- Table 36: Brazil On-Site Photovoltaic Solar Power For Data Centers Market Revenue (Million) Forecast, by Application 2019 & 2032
- Table 37: Argentina On-Site Photovoltaic Solar Power For Data Centers Market Revenue (Million) Forecast, by Application 2019 & 2032
- Table 38: Peru On-Site Photovoltaic Solar Power For Data Centers Market Revenue (Million) Forecast, by Application 2019 & 2032
- Table 39: Chile On-Site Photovoltaic Solar Power For Data Centers Market Revenue (Million) Forecast, by Application 2019 & 2032
- Table 40: Colombia On-Site Photovoltaic Solar Power For Data Centers Market Revenue (Million) Forecast, by Application 2019 & 2032
- Table 41: Ecuador On-Site Photovoltaic Solar Power For Data Centers Market Revenue (Million) Forecast, by Application 2019 & 2032
- Table 42: Venezuela On-Site Photovoltaic Solar Power For Data Centers Market Revenue (Million) Forecast, by Application 2019 & 2032
- Table 43: Rest of South America On-Site Photovoltaic Solar Power For Data Centers Market Revenue (Million) Forecast, by Application 2019 & 2032
- Table 44: Global On-Site Photovoltaic Solar Power For Data Centers Market Revenue Million Forecast, by Country 2019 & 2032
- Table 45: United Arab Emirates On-Site Photovoltaic Solar Power For Data Centers Market Revenue (Million) Forecast, by Application 2019 & 2032
- Table 46: Saudi Arabia On-Site Photovoltaic Solar Power For Data Centers Market Revenue (Million) Forecast, by Application 2019 & 2032
- Table 47: South Africa On-Site Photovoltaic Solar Power For Data Centers Market Revenue (Million) Forecast, by Application 2019 & 2032
- Table 48: Rest of Middle East and Africa On-Site Photovoltaic Solar Power For Data Centers Market Revenue (Million) Forecast, by Application 2019 & 2032
- Table 49: Global On-Site Photovoltaic Solar Power For Data Centers Market Revenue Million Forecast, by Production Analysis 2019 & 2032
- Table 50: Global On-Site Photovoltaic Solar Power For Data Centers Market Revenue Million Forecast, by Consumption Analysis 2019 & 2032
- Table 51: Global On-Site Photovoltaic Solar Power For Data Centers Market Revenue Million Forecast, by Import Market Analysis (Value & Volume) 2019 & 2032
- Table 52: Global On-Site Photovoltaic Solar Power For Data Centers Market Revenue Million Forecast, by Export Market Analysis (Value & Volume) 2019 & 2032
- Table 53: Global On-Site Photovoltaic Solar Power For Data Centers Market Revenue Million Forecast, by Price Trend Analysis 2019 & 2032
- Table 54: Global On-Site Photovoltaic Solar Power For Data Centers Market Revenue Million Forecast, by Country 2019 & 2032
- Table 55: United States On-Site Photovoltaic Solar Power For Data Centers Market Revenue (Million) Forecast, by Application 2019 & 2032
- Table 56: Canada On-Site Photovoltaic Solar Power For Data Centers Market Revenue (Million) Forecast, by Application 2019 & 2032
- Table 57: Rest of North America On-Site Photovoltaic Solar Power For Data Centers Market Revenue (Million) Forecast, by Application 2019 & 2032
- Table 58: Global On-Site Photovoltaic Solar Power For Data Centers Market Revenue Million Forecast, by Production Analysis 2019 & 2032
- Table 59: Global On-Site Photovoltaic Solar Power For Data Centers Market Revenue Million Forecast, by Consumption Analysis 2019 & 2032
- Table 60: Global On-Site Photovoltaic Solar Power For Data Centers Market Revenue Million Forecast, by Import Market Analysis (Value & Volume) 2019 & 2032
- Table 61: Global On-Site Photovoltaic Solar Power For Data Centers Market Revenue Million Forecast, by Export Market Analysis (Value & Volume) 2019 & 2032
- Table 62: Global On-Site Photovoltaic Solar Power For Data Centers Market Revenue Million Forecast, by Price Trend Analysis 2019 & 2032
- Table 63: Global On-Site Photovoltaic Solar Power For Data Centers Market Revenue Million Forecast, by Country 2019 & 2032
- Table 64: Germany On-Site Photovoltaic Solar Power For Data Centers Market Revenue (Million) Forecast, by Application 2019 & 2032
- Table 65: France On-Site Photovoltaic Solar Power For Data Centers Market Revenue (Million) Forecast, by Application 2019 & 2032
- Table 66: United Kingdom On-Site Photovoltaic Solar Power For Data Centers Market Revenue (Million) Forecast, by Application 2019 & 2032
- Table 67: Italy On-Site Photovoltaic Solar Power For Data Centers Market Revenue (Million) Forecast, by Application 2019 & 2032
- Table 68: Spain On-Site Photovoltaic Solar Power For Data Centers Market Revenue (Million) Forecast, by Application 2019 & 2032
- Table 69: NORDIC On-Site Photovoltaic Solar Power For Data Centers Market Revenue (Million) Forecast, by Application 2019 & 2032
- Table 70: Turkey On-Site Photovoltaic Solar Power For Data Centers Market Revenue (Million) Forecast, by Application 2019 & 2032
- Table 71: Russia On-Site Photovoltaic Solar Power For Data Centers Market Revenue (Million) Forecast, by Application 2019 & 2032
- Table 72: Rest of Europe On-Site Photovoltaic Solar Power For Data Centers Market Revenue (Million) Forecast, by Application 2019 & 2032
- Table 73: Global On-Site Photovoltaic Solar Power For Data Centers Market Revenue Million Forecast, by Production Analysis 2019 & 2032
- Table 74: Global On-Site Photovoltaic Solar Power For Data Centers Market Revenue Million Forecast, by Consumption Analysis 2019 & 2032
- Table 75: Global On-Site Photovoltaic Solar Power For Data Centers Market Revenue Million Forecast, by Import Market Analysis (Value & Volume) 2019 & 2032
- Table 76: Global On-Site Photovoltaic Solar Power For Data Centers Market Revenue Million Forecast, by Export Market Analysis (Value & Volume) 2019 & 2032
- Table 77: Global On-Site Photovoltaic Solar Power For Data Centers Market Revenue Million Forecast, by Price Trend Analysis 2019 & 2032
- Table 78: Global On-Site Photovoltaic Solar Power For Data Centers Market Revenue Million Forecast, by Country 2019 & 2032
- Table 79: China On-Site Photovoltaic Solar Power For Data Centers Market Revenue (Million) Forecast, by Application 2019 & 2032
- Table 80: India On-Site Photovoltaic Solar Power For Data Centers Market Revenue (Million) Forecast, by Application 2019 & 2032
- Table 81: Japan On-Site Photovoltaic Solar Power For Data Centers Market Revenue (Million) Forecast, by Application 2019 & 2032
- Table 82: Australia On-Site Photovoltaic Solar Power For Data Centers Market Revenue (Million) Forecast, by Application 2019 & 2032
- Table 83: Malaysia On-Site Photovoltaic Solar Power For Data Centers Market Revenue (Million) Forecast, by Application 2019 & 2032
- Table 84: Thailand On-Site Photovoltaic Solar Power For Data Centers Market Revenue (Million) Forecast, by Application 2019 & 2032
- Table 85: Indonesia On-Site Photovoltaic Solar Power For Data Centers Market Revenue (Million) Forecast, by Application 2019 & 2032
- Table 86: Vietnam On-Site Photovoltaic Solar Power For Data Centers Market Revenue (Million) Forecast, by Application 2019 & 2032
- Table 87: Rest of Asia Pacific On-Site Photovoltaic Solar Power For Data Centers Market Revenue (Million) Forecast, by Application 2019 & 2032
- Table 88: Global On-Site Photovoltaic Solar Power For Data Centers Market Revenue Million Forecast, by Production Analysis 2019 & 2032
- Table 89: Global On-Site Photovoltaic Solar Power For Data Centers Market Revenue Million Forecast, by Consumption Analysis 2019 & 2032
- Table 90: Global On-Site Photovoltaic Solar Power For Data Centers Market Revenue Million Forecast, by Import Market Analysis (Value & Volume) 2019 & 2032
- Table 91: Global On-Site Photovoltaic Solar Power For Data Centers Market Revenue Million Forecast, by Export Market Analysis (Value & Volume) 2019 & 2032
- Table 92: Global On-Site Photovoltaic Solar Power For Data Centers Market Revenue Million Forecast, by Price Trend Analysis 2019 & 2032
- Table 93: Global On-Site Photovoltaic Solar Power For Data Centers Market Revenue Million Forecast, by Country 2019 & 2032
- Table 94: Brazil On-Site Photovoltaic Solar Power For Data Centers Market Revenue (Million) Forecast, by Application 2019 & 2032
- Table 95: Argentina On-Site Photovoltaic Solar Power For Data Centers Market Revenue (Million) Forecast, by Application 2019 & 2032
- Table 96: Chile On-Site Photovoltaic Solar Power For Data Centers Market Revenue (Million) Forecast, by Application 2019 & 2032
- Table 97: Colombia On-Site Photovoltaic Solar Power For Data Centers Market Revenue (Million) Forecast, by Application 2019 & 2032
- Table 98: Rest of South America On-Site Photovoltaic Solar Power For Data Centers Market Revenue (Million) Forecast, by Application 2019 & 2032
- Table 99: Global On-Site Photovoltaic Solar Power For Data Centers Market Revenue Million Forecast, by Production Analysis 2019 & 2032
- Table 100: Global On-Site Photovoltaic Solar Power For Data Centers Market Revenue Million Forecast, by Consumption Analysis 2019 & 2032
- Table 101: Global On-Site Photovoltaic Solar Power For Data Centers Market Revenue Million Forecast, by Import Market Analysis (Value & Volume) 2019 & 2032
- Table 102: Global On-Site Photovoltaic Solar Power For Data Centers Market Revenue Million Forecast, by Export Market Analysis (Value & Volume) 2019 & 2032
- Table 103: Global On-Site Photovoltaic Solar Power For Data Centers Market Revenue Million Forecast, by Price Trend Analysis 2019 & 2032
- Table 104: Global On-Site Photovoltaic Solar Power For Data Centers Market Revenue Million Forecast, by Country 2019 & 2032
- Table 105: United Arab Emirates On-Site Photovoltaic Solar Power For Data Centers Market Revenue (Million) Forecast, by Application 2019 & 2032
- Table 106: Qatar On-Site Photovoltaic Solar Power For Data Centers Market Revenue (Million) Forecast, by Application 2019 & 2032
- Table 107: Saudi Arabia On-Site Photovoltaic Solar Power For Data Centers Market Revenue (Million) Forecast, by Application 2019 & 2032
- Table 108: South Africa On-Site Photovoltaic Solar Power For Data Centers Market Revenue (Million) Forecast, by Application 2019 & 2032
- Table 109: Nigeria On-Site Photovoltaic Solar Power For Data Centers Market Revenue (Million) Forecast, by Application 2019 & 2032
- Table 110: Egypt On-Site Photovoltaic Solar Power For Data Centers Market Revenue (Million) Forecast, by Application 2019 & 2032
Frequently Asked Questions
1. What is the projected Compound Annual Growth Rate (CAGR) of the On-Site Photovoltaic Solar Power For Data Centers Market?
The projected CAGR is approximately 13.60%.
2. Which companies are prominent players in the On-Site Photovoltaic Solar Power For Data Centers Market?
Key companies in the market include Affordable Internet Services Online Inc *List Not Exhaustive 6 4 Market Player Rankin, Alibaba Group Holding Ltd, Alphabet Inc, Microsoft Corporation, Amazon com Inc, Facebook Inc, Dell Technologies Inc.
3. What are the main segments of the On-Site Photovoltaic Solar Power For Data Centers Market?
The market segments include Production Analysis, Consumption Analysis, Import Market Analysis (Value & Volume), Export Market Analysis (Value & Volume), Price Trend Analysis.
4. Can you provide details about the market size?
The market size is estimated to be USD 22.90 Million as of 2022.
5. What are some drivers contributing to market growth?
4.; Decreasing Solar Power Installation Costs 4.; Growing focus on Implementing Sustainable Business Practices.
6. What are the notable trends driving market growth?
Decrease in Solar Power Installation Cost is Likely to Drive the Market.
7. Are there any restraints impacting market growth?
4.; Lack of Space for Small Data Centers to Install Solar Panels.
8. Can you provide examples of recent developments in the market?
In September 2023, Ireland-based Power Capital Renewable Energy (PCRE) signed a power purchase agreement (PPA) with American multinational technology firm Google. The agreement will help power up the data centre and offices of Google in Ireland with solar energy worth 58 MW capacity.
9. What pricing options are available for accessing the report?
Pricing options include single-user, multi-user, and enterprise licenses priced at USD 4750, USD 5250, and USD 8750 respectively.
10. Is the market size provided in terms of value or volume?
The market size is provided in terms of value, measured in Million.
11. Are there any specific market keywords associated with the report?
Yes, the market keyword associated with the report is "On-Site Photovoltaic Solar Power For Data Centers Market," which aids in identifying and referencing the specific market segment covered.
12. How do I determine which pricing option suits my needs best?
The pricing options vary based on user requirements and access needs. Individual users may opt for single-user licenses, while businesses requiring broader access may choose multi-user or enterprise licenses for cost-effective access to the report.
13. Are there any additional resources or data provided in the On-Site Photovoltaic Solar Power For Data Centers Market report?
While the report offers comprehensive insights, it's advisable to review the specific contents or supplementary materials provided to ascertain if additional resources or data are available.
14. How can I stay updated on further developments or reports in the On-Site Photovoltaic Solar Power For Data Centers Market?
To stay informed about further developments, trends, and reports in the On-Site Photovoltaic Solar Power For Data Centers Market, consider subscribing to industry newsletters, following relevant companies and organizations, or regularly checking reputable industry news sources and publications.
Methodology
Step 1 - Identification of Relevant Samples Size from Population Database


Step 2 - Approaches for Defining Global Market Size (Value, Volume* & Price*)

Note*: In applicable scenarios
Step 3 - Data Sources
Primary Research
- Web Analytics
- Survey Reports
- Research Institute
- Latest Research Reports
- Opinion Leaders
Secondary Research
- Annual Reports
- White Paper
- Latest Press Release
- Industry Association
- Paid Database
- Investor Presentations

Step 4 - Data Triangulation
Involves using different sources of information in order to increase the validity of a study
These sources are likely to be stakeholders in a program - participants, other researchers, program staff, other community members, and so on.
Then we put all data in single framework & apply various statistical tools to find out the dynamic on the market.
During the analysis stage, feedback from the stakeholder groups would be compared to determine areas of agreement as well as areas of divergence
