

Key Insights
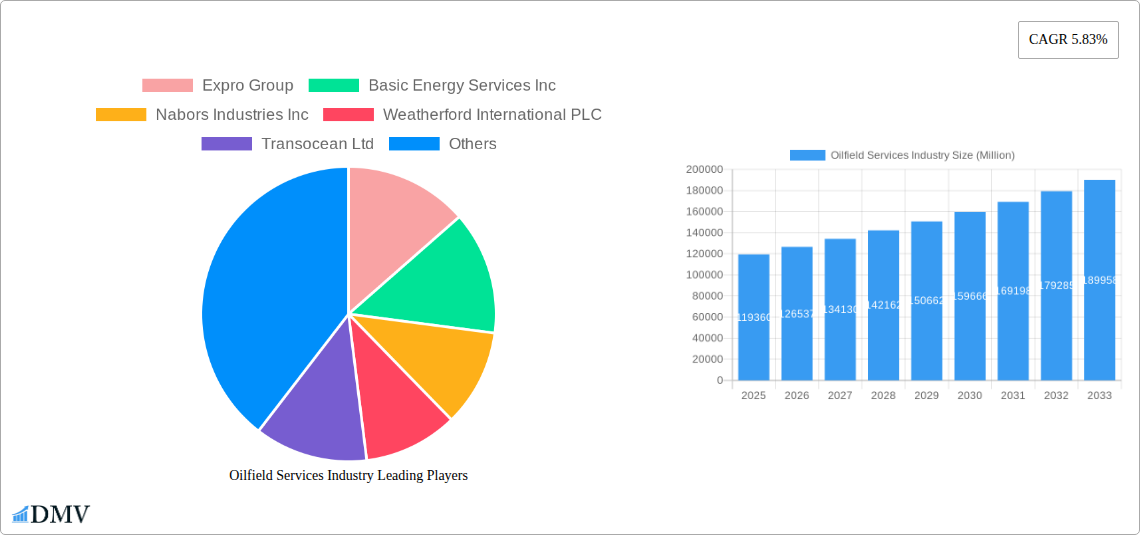
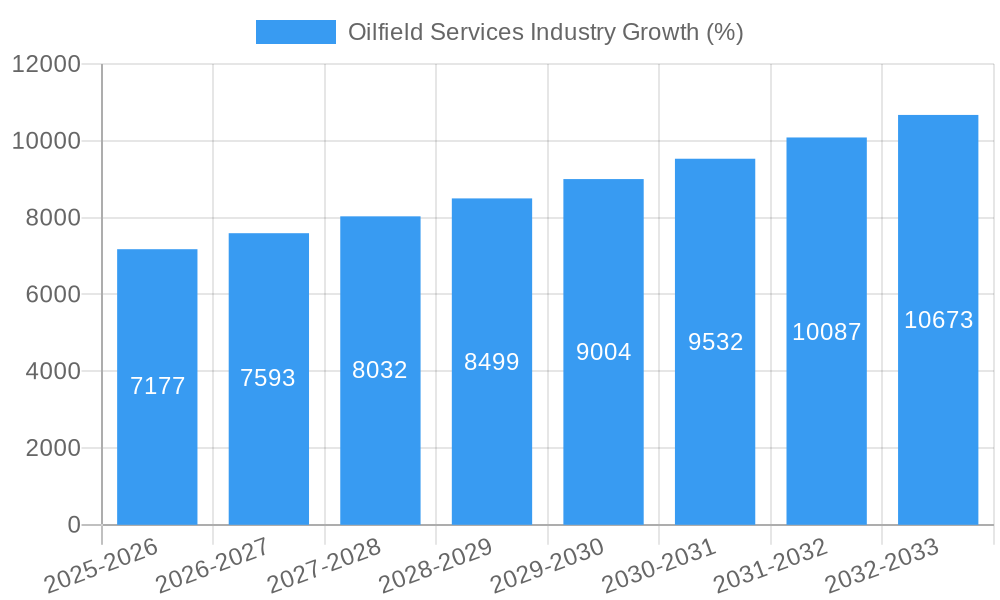
The global oilfield services market, valued at $119.36 billion in 2025, is projected to experience robust growth, driven by increasing global energy demand and ongoing exploration and production activities. A Compound Annual Growth Rate (CAGR) of 5.83% is anticipated from 2025 to 2033, indicating a significant market expansion. Key drivers include the rising need for enhanced oil recovery techniques, the development of unconventional resources like shale gas and tight oil, and the growing adoption of advanced technologies such as digitalization and automation to improve efficiency and reduce operational costs. The market's segmentation reveals that drilling services, completion services, and production & intervention services are the major revenue contributors, with offshore deployment currently holding a larger share but onshore operations projected for significant growth due to factors such as accessibility and reduced regulatory hurdles in certain regions. Competition among major players like Schlumberger, Halliburton, Baker Hughes, and others is intense, prompting continuous innovation and the introduction of integrated service offerings.
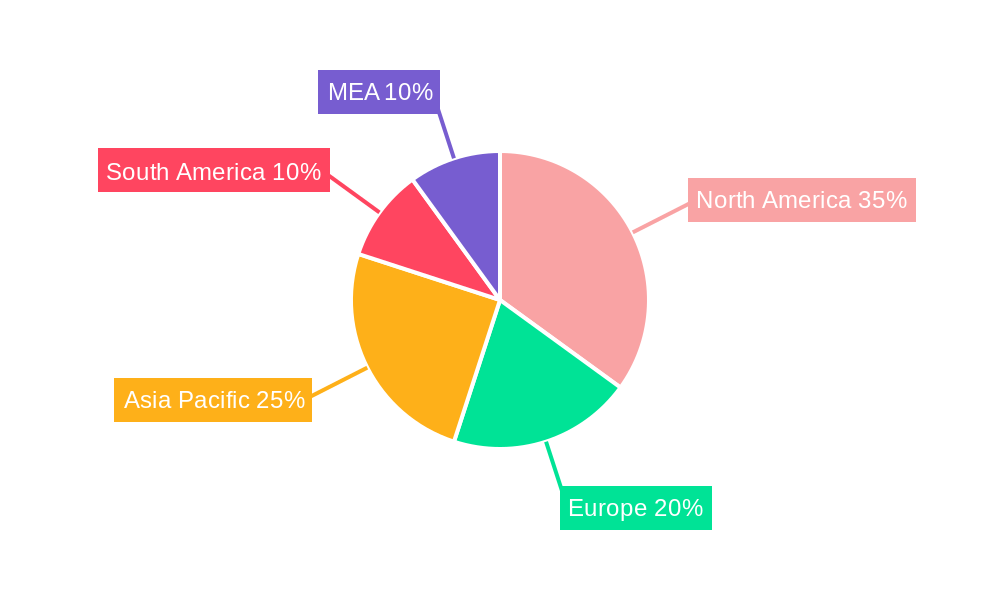
Geographic analysis points to North America maintaining a leading market position, fueled by robust shale gas production. However, significant growth opportunities exist in the Asia-Pacific region, driven by rapid industrialization and rising energy consumption in countries like China and India. Europe and the Middle East & Africa regions also contribute substantially, with ongoing investments in exploration and production activities. Market restraints include fluctuating oil prices, environmental regulations, and geopolitical uncertainties, but technological advancements and the increasing demand for sustainable energy solutions are mitigating these challenges and shaping the future trajectory of the oilfield services industry. The long-term forecast suggests a sustained upward trend, although the actual growth rate may fluctuate slightly based on global economic conditions and energy policy shifts.
Oilfield Services Industry Market Report: 2019-2033
This comprehensive report provides an in-depth analysis of the global Oilfield Services market, encompassing historical data (2019-2024), current estimations (2025), and future projections (2025-2033). Valued at $xx Million in 2025, the market is poised for significant growth, driven by technological advancements and increasing global energy demand. This report offers crucial insights for stakeholders, investors, and industry professionals seeking a clear understanding of this dynamic sector.
Oilfield Services Industry Market Composition & Trends
The global oilfield services market, estimated at $xx Million in 2025, exhibits moderate concentration with several major players holding significant market share. Schlumberger Limited, Halliburton Company, and Baker Hughes Company collectively account for approximately xx% of the market, while other key players like Expro Group, Weatherford International PLC, and Nabors Industries Inc. compete intensely. Innovation is fueled by the need for enhanced efficiency, reduced operational costs, and environmental sustainability, with significant investments in automation, digitalization, and AI-driven solutions. The regulatory landscape, varying across regions, influences operational costs and environmental compliance. Substitute products, such as renewable energy technologies, pose a long-term threat, demanding continuous innovation and adaptation within the oilfield services sector. End-users primarily comprise national and international oil & gas companies, with varying levels of technological adoption across regions. Mergers and acquisitions (M&A) activity remains significant, with recent deals valued at $xx Million, primarily aimed at consolidating market share and enhancing technological capabilities.
- Market Share Distribution (2025): Schlumberger: xx%, Halliburton: xx%, Baker Hughes: xx%, Others: xx%
- M&A Deal Value (2019-2024): $xx Million
- Key Innovation Catalysts: AI, Automation, Digitalization, Enhanced Oil Recovery (EOR) techniques.
- Significant Regulatory Factors: Emission standards, safety regulations, environmental impact assessments.
Oilfield Services Industry Evolution
The oilfield services market has witnessed fluctuating growth trajectories over the historical period (2019-2024), influenced by global economic conditions and oil price volatility. The forecast period (2025-2033) anticipates a Compound Annual Growth Rate (CAGR) of xx%, primarily driven by the increasing demand for oil and gas, particularly in emerging markets. This growth is further accelerated by technological advancements, including the adoption of automation in drilling and completion processes, leading to improved efficiency and reduced operational costs. The industry has shifted towards integrated services, with companies offering comprehensive solutions covering the entire oil and gas lifecycle. Consumer demands are focusing on sustainable and environmentally friendly solutions, prompting the adoption of technologies aimed at reducing carbon emissions and improving environmental performance. While the transition to renewable energy sources presents a long-term challenge, the forecast period expects continued growth within the oilfield services sector, driven by persistent energy demands and ongoing investments in upstream oil and gas activities.
- Historical Growth Rate (2019-2024): xx% CAGR (Fluctuations based on oil prices are detailed in Appendix A)
- Projected Growth Rate (2025-2033): xx% CAGR
- Key Technological Advancements: AI-powered drilling optimization, remote operations, robotic solutions.
- Shifting Consumer Demands: Focus on ESG (Environmental, Social, and Governance) factors, reduced operational emissions, improved safety standards.
Leading Regions, Countries, or Segments in Oilfield Services Industry
- Dominant Region/Country: North America (particularly the U.S.) continues to be the leading market due to its large shale gas reserves and robust oil and gas production activities, coupled with significant investment in technological advancements. The Middle East and Asia-Pacific are also showing significant growth potential.
Service Type:
- Drilling Services: Remains a dominant segment, driven by ongoing exploration and production activities globally.
- Completion Services: Shows strong growth, propelled by the increasing complexity of well completions and the need for enhanced oil recovery techniques.
- Production and Intervention Services: Experiencing steady growth as operators focus on maximizing production from existing fields.
- Other Services: Includes specialized services like pipeline construction and maintenance, and are witnessing growth, often linked to specific geographical needs.
Location of Deployment:
- Offshore: High growth potential driven by deepwater projects, despite higher operational costs.
- Onshore: Continues to be the larger segment, driven by shale gas and conventional oil and gas production.
Key Drivers:
- High investment in exploration and production activities: particularly in regions like North America, the Middle East, and Asia-Pacific.
- Governmental support and incentives: to promote domestic oil and gas production.
- Technological advancements: driving increased efficiency and reduced operational costs.
The dominance of specific regions and segments are influenced by factors such as resource availability, regulatory environment, technological maturity, and investment levels.
Oilfield Services Industry Product Innovations
Recent innovations focus on enhancing efficiency, reducing costs, and improving environmental performance. This includes the deployment of advanced drilling technologies, real-time monitoring systems, and automation solutions, alongside the adoption of AI-powered predictive maintenance and reservoir simulation to optimize production processes. Unique selling propositions often centre around improved safety, reduced operational emissions, and increased productivity. Furthermore, digital twins are becoming increasingly prevalent, allowing for more accurate modelling and optimization of oilfield operations.
Propelling Factors for Oilfield Services Industry Growth
The oilfield services market is experiencing growth due to several key factors. Firstly, increasing global energy demand, primarily driven by population growth and economic development in emerging markets, continues to fuel exploration and production activities. Secondly, technological advancements, such as the application of automation and AI, have improved efficiency and reduced operational costs, making the industry more attractive to investors. Finally, supportive government policies and incentives in certain regions are encouraging investment in oil and gas projects, further boosting the sector's growth.
Obstacles in the Oilfield Services Industry Market
The industry faces several challenges. Fluctuations in oil prices directly impact demand and investment levels. Stringent environmental regulations and the push towards decarbonization are increasing operational costs and complexity, which necessitates significant investments in new technologies and processes. Supply chain disruptions and skilled labor shortages further constrain industry growth. Lastly, intense competition among service providers leads to downward pressure on pricing, impacting profitability. These factors, individually and collectively, restrain overall market expansion.
Future Opportunities in Oilfield Services Industry
Future growth hinges on several key areas. The increasing focus on carbon capture, utilization, and storage (CCUS) technologies creates new opportunities for oilfield service providers. The exploration and development of unconventional resources, such as shale gas and deepwater reserves, continues to demand sophisticated services. Additionally, the integration of digital technologies and automation promises improved efficiencies and sustainability, offering a promising avenue for growth. Finally, the expansion into emerging markets provides significant untapped potential.
Major Players in the Oilfield Services Industry Ecosystem
- Expro Group
- Basic Energy Services Inc
- Nabors Industries Inc
- Weatherford International PLC
- Transocean Ltd
- Baker Hughes Company
- China Oilfield Services Limited
- Halliburton Company
- OiLSERV
- Schlumberger Limited
- Valaris PLC
Key Developments in Oilfield Services Industry Industry
September 2023: Schlumberger Limited (SLB) partnered with INEOS Energy to collaborate on subsurface technologies, leveraging AI capabilities for enhanced operational performance and CCS initiatives. This signifies a growing focus on sustainable solutions within the oil and gas sector and illustrates the increasing role of AI and digitalization within the industry.
April 2023: QatarEnergy's acquisition of a 40% working interest in the C-10 block offshore Mauritania highlights ongoing investment in exploration and production, particularly in offshore projects. This development underscores the continued importance of offshore activities and their contribution to market growth.
Strategic Oilfield Services Industry Market Forecast
The oilfield services market is projected to witness robust growth in the coming years, driven by persistent global energy demand, technological advancements, and ongoing investments in exploration and production. Despite challenges posed by fluctuating oil prices and environmental concerns, the adoption of sustainable technologies and innovative service offerings will continue to drive market expansion. The focus on efficiency gains, digitalization, and a heightened emphasis on ESG factors will shape the future landscape of this vital sector. The market's potential remains significant, particularly in emerging markets and within specialized segments such as CCUS.
Oilfield Services Industry Segmentation
-
1. Service Type
- 1.1. Drilling Services
- 1.2. Completion Services
- 1.3. Production and Intervention Services
- 1.4. Other Services
-
2. Location of Deployment
- 2.1. Onshore
- 2.2. Offshore
Oilfield Services Industry Segmentation By Geography
-
1. North America
- 1.1. United States
- 1.2. Canada
- 1.3. Rest of North America
-
2. Europe
- 2.1. Germany
- 2.2. France
- 2.3. United Kingdom
- 2.4. Italy
- 2.5. Russia
- 2.6. Spain
- 2.7. NORDIC
- 2.8. Turkey
- 2.9. Rest of Europe
-
3. Asia Pacific
- 3.1. China
- 3.2. India
- 3.3. Japan
- 3.4. South Korea
- 3.5. Malaysia
- 3.6. Thailand
- 3.7. Vietnam
- 3.8. Rest of Asia Pacific
-
4. South America
- 4.1. Brazil
- 4.2. Argentina
- 4.3. Colombia
- 4.4. Rest of South America
-
5. Middle East and Africa
- 5.1. Saudi Arabia
- 5.2. United Arab Emirates
- 5.3. South Africa
- 5.4. Nigeria
- 5.5. Qatar
- 5.6. Egypt
- 5.7. Rest of the Middle East and Africa
Oilfield Services Industry REPORT HIGHLIGHTS
| Aspects | Details |
|---|---|
| Study Period | 2019-2033 |
| Base Year | 2024 |
| Estimated Year | 2025 |
| Forecast Period | 2025-2033 |
| Historical Period | 2019-2024 |
| Growth Rate | CAGR of 5.83% from 2019-2033 |
| Segmentation |
|
Table of Contents
- 1. Introduction
- 1.1. Research Scope
- 1.2. Market Segmentation
- 1.3. Research Methodology
- 1.4. Definitions and Assumptions
- 2. Executive Summary
- 2.1. Introduction
- 3. Market Dynamics
- 3.1. Introduction
- 3.2. Market Drivers
- 3.2.1 4.; Increasing Development of Gas Reserves and Advanced Technology
- 3.2.2 Tools
- 3.2.3 and Equipment4.; Increasing Investment in the Oilfield Services across World
- 3.3. Market Restrains
- 3.3.1 4.; The Volatile Oil Prices Over the Recent Period
- 3.3.2 Owing to the Supply-Demand Gap
- 3.4. Market Trends
- 3.4.1. Drilling Services Are Expected to Dominate the Market
- 4. Market Factor Analysis
- 4.1. Porters Five Forces
- 4.2. Supply/Value Chain
- 4.3. PESTEL analysis
- 4.4. Market Entropy
- 4.5. Patent/Trademark Analysis
- 5. Global Oilfield Services Industry Analysis, Insights and Forecast, 2019-2031
- 5.1. Market Analysis, Insights and Forecast - by Service Type
- 5.1.1. Drilling Services
- 5.1.2. Completion Services
- 5.1.3. Production and Intervention Services
- 5.1.4. Other Services
- 5.2. Market Analysis, Insights and Forecast - by Location of Deployment
- 5.2.1. Onshore
- 5.2.2. Offshore
- 5.3. Market Analysis, Insights and Forecast - by Region
- 5.3.1. North America
- 5.3.2. Europe
- 5.3.3. Asia Pacific
- 5.3.4. South America
- 5.3.5. Middle East and Africa
- 5.1. Market Analysis, Insights and Forecast - by Service Type
- 6. North America Oilfield Services Industry Analysis, Insights and Forecast, 2019-2031
- 6.1. Market Analysis, Insights and Forecast - by Service Type
- 6.1.1. Drilling Services
- 6.1.2. Completion Services
- 6.1.3. Production and Intervention Services
- 6.1.4. Other Services
- 6.2. Market Analysis, Insights and Forecast - by Location of Deployment
- 6.2.1. Onshore
- 6.2.2. Offshore
- 6.1. Market Analysis, Insights and Forecast - by Service Type
- 7. Europe Oilfield Services Industry Analysis, Insights and Forecast, 2019-2031
- 7.1. Market Analysis, Insights and Forecast - by Service Type
- 7.1.1. Drilling Services
- 7.1.2. Completion Services
- 7.1.3. Production and Intervention Services
- 7.1.4. Other Services
- 7.2. Market Analysis, Insights and Forecast - by Location of Deployment
- 7.2.1. Onshore
- 7.2.2. Offshore
- 7.1. Market Analysis, Insights and Forecast - by Service Type
- 8. Asia Pacific Oilfield Services Industry Analysis, Insights and Forecast, 2019-2031
- 8.1. Market Analysis, Insights and Forecast - by Service Type
- 8.1.1. Drilling Services
- 8.1.2. Completion Services
- 8.1.3. Production and Intervention Services
- 8.1.4. Other Services
- 8.2. Market Analysis, Insights and Forecast - by Location of Deployment
- 8.2.1. Onshore
- 8.2.2. Offshore
- 8.1. Market Analysis, Insights and Forecast - by Service Type
- 9. South America Oilfield Services Industry Analysis, Insights and Forecast, 2019-2031
- 9.1. Market Analysis, Insights and Forecast - by Service Type
- 9.1.1. Drilling Services
- 9.1.2. Completion Services
- 9.1.3. Production and Intervention Services
- 9.1.4. Other Services
- 9.2. Market Analysis, Insights and Forecast - by Location of Deployment
- 9.2.1. Onshore
- 9.2.2. Offshore
- 9.1. Market Analysis, Insights and Forecast - by Service Type
- 10. Middle East and Africa Oilfield Services Industry Analysis, Insights and Forecast, 2019-2031
- 10.1. Market Analysis, Insights and Forecast - by Service Type
- 10.1.1. Drilling Services
- 10.1.2. Completion Services
- 10.1.3. Production and Intervention Services
- 10.1.4. Other Services
- 10.2. Market Analysis, Insights and Forecast - by Location of Deployment
- 10.2.1. Onshore
- 10.2.2. Offshore
- 10.1. Market Analysis, Insights and Forecast - by Service Type
- 11. North America Oilfield Services Industry Analysis, Insights and Forecast, 2019-2031
- 11.1. Market Analysis, Insights and Forecast - By Country/Sub-region
- 11.1.1 United States
- 11.1.2 Canada
- 11.1.3 Mexico
- 12. Europe Oilfield Services Industry Analysis, Insights and Forecast, 2019-2031
- 12.1. Market Analysis, Insights and Forecast - By Country/Sub-region
- 12.1.1 Germany
- 12.1.2 United Kingdom
- 12.1.3 France
- 12.1.4 Spain
- 12.1.5 Italy
- 12.1.6 Spain
- 12.1.7 Belgium
- 12.1.8 Netherland
- 12.1.9 Nordics
- 12.1.10 Rest of Europe
- 13. Asia Pacific Oilfield Services Industry Analysis, Insights and Forecast, 2019-2031
- 13.1. Market Analysis, Insights and Forecast - By Country/Sub-region
- 13.1.1 China
- 13.1.2 Japan
- 13.1.3 India
- 13.1.4 South Korea
- 13.1.5 Southeast Asia
- 13.1.6 Australia
- 13.1.7 Indonesia
- 13.1.8 Phillipes
- 13.1.9 Singapore
- 13.1.10 Thailandc
- 13.1.11 Rest of Asia Pacific
- 14. South America Oilfield Services Industry Analysis, Insights and Forecast, 2019-2031
- 14.1. Market Analysis, Insights and Forecast - By Country/Sub-region
- 14.1.1 Brazil
- 14.1.2 Argentina
- 14.1.3 Peru
- 14.1.4 Chile
- 14.1.5 Colombia
- 14.1.6 Ecuador
- 14.1.7 Venezuela
- 14.1.8 Rest of South America
- 15. MEA Oilfield Services Industry Analysis, Insights and Forecast, 2019-2031
- 15.1. Market Analysis, Insights and Forecast - By Country/Sub-region
- 15.1.1 United Arab Emirates
- 15.1.2 Saudi Arabia
- 15.1.3 South Africa
- 15.1.4 Rest of Middle East and Africa
- 16. Competitive Analysis
- 16.1. Global Market Share Analysis 2024
- 16.2. Company Profiles
- 16.2.1 Expro Group
- 16.2.1.1. Overview
- 16.2.1.2. Products
- 16.2.1.3. SWOT Analysis
- 16.2.1.4. Recent Developments
- 16.2.1.5. Financials (Based on Availability)
- 16.2.2 Basic Energy Services Inc
- 16.2.2.1. Overview
- 16.2.2.2. Products
- 16.2.2.3. SWOT Analysis
- 16.2.2.4. Recent Developments
- 16.2.2.5. Financials (Based on Availability)
- 16.2.3 Nabors Industries Inc
- 16.2.3.1. Overview
- 16.2.3.2. Products
- 16.2.3.3. SWOT Analysis
- 16.2.3.4. Recent Developments
- 16.2.3.5. Financials (Based on Availability)
- 16.2.4 Weatherford International PLC
- 16.2.4.1. Overview
- 16.2.4.2. Products
- 16.2.4.3. SWOT Analysis
- 16.2.4.4. Recent Developments
- 16.2.4.5. Financials (Based on Availability)
- 16.2.5 Transocean Ltd
- 16.2.5.1. Overview
- 16.2.5.2. Products
- 16.2.5.3. SWOT Analysis
- 16.2.5.4. Recent Developments
- 16.2.5.5. Financials (Based on Availability)
- 16.2.6 Baker Hughes Company
- 16.2.6.1. Overview
- 16.2.6.2. Products
- 16.2.6.3. SWOT Analysis
- 16.2.6.4. Recent Developments
- 16.2.6.5. Financials (Based on Availability)
- 16.2.7 China Oilfield Services Limited
- 16.2.7.1. Overview
- 16.2.7.2. Products
- 16.2.7.3. SWOT Analysis
- 16.2.7.4. Recent Developments
- 16.2.7.5. Financials (Based on Availability)
- 16.2.8 Halliburton Company
- 16.2.8.1. Overview
- 16.2.8.2. Products
- 16.2.8.3. SWOT Analysis
- 16.2.8.4. Recent Developments
- 16.2.8.5. Financials (Based on Availability)
- 16.2.9 OiLSERV
- 16.2.9.1. Overview
- 16.2.9.2. Products
- 16.2.9.3. SWOT Analysis
- 16.2.9.4. Recent Developments
- 16.2.9.5. Financials (Based on Availability)
- 16.2.10 Schlumberger Limited
- 16.2.10.1. Overview
- 16.2.10.2. Products
- 16.2.10.3. SWOT Analysis
- 16.2.10.4. Recent Developments
- 16.2.10.5. Financials (Based on Availability)
- 16.2.11 Valaris PLC
- 16.2.11.1. Overview
- 16.2.11.2. Products
- 16.2.11.3. SWOT Analysis
- 16.2.11.4. Recent Developments
- 16.2.11.5. Financials (Based on Availability)
- 16.2.1 Expro Group
List of Figures
- Figure 1: Global Oilfield Services Industry Revenue Breakdown (Million, %) by Region 2024 & 2032
- Figure 2: North America Oilfield Services Industry Revenue (Million), by Country 2024 & 2032
- Figure 3: North America Oilfield Services Industry Revenue Share (%), by Country 2024 & 2032
- Figure 4: Europe Oilfield Services Industry Revenue (Million), by Country 2024 & 2032
- Figure 5: Europe Oilfield Services Industry Revenue Share (%), by Country 2024 & 2032
- Figure 6: Asia Pacific Oilfield Services Industry Revenue (Million), by Country 2024 & 2032
- Figure 7: Asia Pacific Oilfield Services Industry Revenue Share (%), by Country 2024 & 2032
- Figure 8: South America Oilfield Services Industry Revenue (Million), by Country 2024 & 2032
- Figure 9: South America Oilfield Services Industry Revenue Share (%), by Country 2024 & 2032
- Figure 10: MEA Oilfield Services Industry Revenue (Million), by Country 2024 & 2032
- Figure 11: MEA Oilfield Services Industry Revenue Share (%), by Country 2024 & 2032
- Figure 12: North America Oilfield Services Industry Revenue (Million), by Service Type 2024 & 2032
- Figure 13: North America Oilfield Services Industry Revenue Share (%), by Service Type 2024 & 2032
- Figure 14: North America Oilfield Services Industry Revenue (Million), by Location of Deployment 2024 & 2032
- Figure 15: North America Oilfield Services Industry Revenue Share (%), by Location of Deployment 2024 & 2032
- Figure 16: North America Oilfield Services Industry Revenue (Million), by Country 2024 & 2032
- Figure 17: North America Oilfield Services Industry Revenue Share (%), by Country 2024 & 2032
- Figure 18: Europe Oilfield Services Industry Revenue (Million), by Service Type 2024 & 2032
- Figure 19: Europe Oilfield Services Industry Revenue Share (%), by Service Type 2024 & 2032
- Figure 20: Europe Oilfield Services Industry Revenue (Million), by Location of Deployment 2024 & 2032
- Figure 21: Europe Oilfield Services Industry Revenue Share (%), by Location of Deployment 2024 & 2032
- Figure 22: Europe Oilfield Services Industry Revenue (Million), by Country 2024 & 2032
- Figure 23: Europe Oilfield Services Industry Revenue Share (%), by Country 2024 & 2032
- Figure 24: Asia Pacific Oilfield Services Industry Revenue (Million), by Service Type 2024 & 2032
- Figure 25: Asia Pacific Oilfield Services Industry Revenue Share (%), by Service Type 2024 & 2032
- Figure 26: Asia Pacific Oilfield Services Industry Revenue (Million), by Location of Deployment 2024 & 2032
- Figure 27: Asia Pacific Oilfield Services Industry Revenue Share (%), by Location of Deployment 2024 & 2032
- Figure 28: Asia Pacific Oilfield Services Industry Revenue (Million), by Country 2024 & 2032
- Figure 29: Asia Pacific Oilfield Services Industry Revenue Share (%), by Country 2024 & 2032
- Figure 30: South America Oilfield Services Industry Revenue (Million), by Service Type 2024 & 2032
- Figure 31: South America Oilfield Services Industry Revenue Share (%), by Service Type 2024 & 2032
- Figure 32: South America Oilfield Services Industry Revenue (Million), by Location of Deployment 2024 & 2032
- Figure 33: South America Oilfield Services Industry Revenue Share (%), by Location of Deployment 2024 & 2032
- Figure 34: South America Oilfield Services Industry Revenue (Million), by Country 2024 & 2032
- Figure 35: South America Oilfield Services Industry Revenue Share (%), by Country 2024 & 2032
- Figure 36: Middle East and Africa Oilfield Services Industry Revenue (Million), by Service Type 2024 & 2032
- Figure 37: Middle East and Africa Oilfield Services Industry Revenue Share (%), by Service Type 2024 & 2032
- Figure 38: Middle East and Africa Oilfield Services Industry Revenue (Million), by Location of Deployment 2024 & 2032
- Figure 39: Middle East and Africa Oilfield Services Industry Revenue Share (%), by Location of Deployment 2024 & 2032
- Figure 40: Middle East and Africa Oilfield Services Industry Revenue (Million), by Country 2024 & 2032
- Figure 41: Middle East and Africa Oilfield Services Industry Revenue Share (%), by Country 2024 & 2032
List of Tables
- Table 1: Global Oilfield Services Industry Revenue Million Forecast, by Region 2019 & 2032
- Table 2: Global Oilfield Services Industry Revenue Million Forecast, by Service Type 2019 & 2032
- Table 3: Global Oilfield Services Industry Revenue Million Forecast, by Location of Deployment 2019 & 2032
- Table 4: Global Oilfield Services Industry Revenue Million Forecast, by Region 2019 & 2032
- Table 5: Global Oilfield Services Industry Revenue Million Forecast, by Country 2019 & 2032
- Table 6: United States Oilfield Services Industry Revenue (Million) Forecast, by Application 2019 & 2032
- Table 7: Canada Oilfield Services Industry Revenue (Million) Forecast, by Application 2019 & 2032
- Table 8: Mexico Oilfield Services Industry Revenue (Million) Forecast, by Application 2019 & 2032
- Table 9: Global Oilfield Services Industry Revenue Million Forecast, by Country 2019 & 2032
- Table 10: Germany Oilfield Services Industry Revenue (Million) Forecast, by Application 2019 & 2032
- Table 11: United Kingdom Oilfield Services Industry Revenue (Million) Forecast, by Application 2019 & 2032
- Table 12: France Oilfield Services Industry Revenue (Million) Forecast, by Application 2019 & 2032
- Table 13: Spain Oilfield Services Industry Revenue (Million) Forecast, by Application 2019 & 2032
- Table 14: Italy Oilfield Services Industry Revenue (Million) Forecast, by Application 2019 & 2032
- Table 15: Spain Oilfield Services Industry Revenue (Million) Forecast, by Application 2019 & 2032
- Table 16: Belgium Oilfield Services Industry Revenue (Million) Forecast, by Application 2019 & 2032
- Table 17: Netherland Oilfield Services Industry Revenue (Million) Forecast, by Application 2019 & 2032
- Table 18: Nordics Oilfield Services Industry Revenue (Million) Forecast, by Application 2019 & 2032
- Table 19: Rest of Europe Oilfield Services Industry Revenue (Million) Forecast, by Application 2019 & 2032
- Table 20: Global Oilfield Services Industry Revenue Million Forecast, by Country 2019 & 2032
- Table 21: China Oilfield Services Industry Revenue (Million) Forecast, by Application 2019 & 2032
- Table 22: Japan Oilfield Services Industry Revenue (Million) Forecast, by Application 2019 & 2032
- Table 23: India Oilfield Services Industry Revenue (Million) Forecast, by Application 2019 & 2032
- Table 24: South Korea Oilfield Services Industry Revenue (Million) Forecast, by Application 2019 & 2032
- Table 25: Southeast Asia Oilfield Services Industry Revenue (Million) Forecast, by Application 2019 & 2032
- Table 26: Australia Oilfield Services Industry Revenue (Million) Forecast, by Application 2019 & 2032
- Table 27: Indonesia Oilfield Services Industry Revenue (Million) Forecast, by Application 2019 & 2032
- Table 28: Phillipes Oilfield Services Industry Revenue (Million) Forecast, by Application 2019 & 2032
- Table 29: Singapore Oilfield Services Industry Revenue (Million) Forecast, by Application 2019 & 2032
- Table 30: Thailandc Oilfield Services Industry Revenue (Million) Forecast, by Application 2019 & 2032
- Table 31: Rest of Asia Pacific Oilfield Services Industry Revenue (Million) Forecast, by Application 2019 & 2032
- Table 32: Global Oilfield Services Industry Revenue Million Forecast, by Country 2019 & 2032
- Table 33: Brazil Oilfield Services Industry Revenue (Million) Forecast, by Application 2019 & 2032
- Table 34: Argentina Oilfield Services Industry Revenue (Million) Forecast, by Application 2019 & 2032
- Table 35: Peru Oilfield Services Industry Revenue (Million) Forecast, by Application 2019 & 2032
- Table 36: Chile Oilfield Services Industry Revenue (Million) Forecast, by Application 2019 & 2032
- Table 37: Colombia Oilfield Services Industry Revenue (Million) Forecast, by Application 2019 & 2032
- Table 38: Ecuador Oilfield Services Industry Revenue (Million) Forecast, by Application 2019 & 2032
- Table 39: Venezuela Oilfield Services Industry Revenue (Million) Forecast, by Application 2019 & 2032
- Table 40: Rest of South America Oilfield Services Industry Revenue (Million) Forecast, by Application 2019 & 2032
- Table 41: Global Oilfield Services Industry Revenue Million Forecast, by Country 2019 & 2032
- Table 42: United Arab Emirates Oilfield Services Industry Revenue (Million) Forecast, by Application 2019 & 2032
- Table 43: Saudi Arabia Oilfield Services Industry Revenue (Million) Forecast, by Application 2019 & 2032
- Table 44: South Africa Oilfield Services Industry Revenue (Million) Forecast, by Application 2019 & 2032
- Table 45: Rest of Middle East and Africa Oilfield Services Industry Revenue (Million) Forecast, by Application 2019 & 2032
- Table 46: Global Oilfield Services Industry Revenue Million Forecast, by Service Type 2019 & 2032
- Table 47: Global Oilfield Services Industry Revenue Million Forecast, by Location of Deployment 2019 & 2032
- Table 48: Global Oilfield Services Industry Revenue Million Forecast, by Country 2019 & 2032
- Table 49: United States Oilfield Services Industry Revenue (Million) Forecast, by Application 2019 & 2032
- Table 50: Canada Oilfield Services Industry Revenue (Million) Forecast, by Application 2019 & 2032
- Table 51: Rest of North America Oilfield Services Industry Revenue (Million) Forecast, by Application 2019 & 2032
- Table 52: Global Oilfield Services Industry Revenue Million Forecast, by Service Type 2019 & 2032
- Table 53: Global Oilfield Services Industry Revenue Million Forecast, by Location of Deployment 2019 & 2032
- Table 54: Global Oilfield Services Industry Revenue Million Forecast, by Country 2019 & 2032
- Table 55: Germany Oilfield Services Industry Revenue (Million) Forecast, by Application 2019 & 2032
- Table 56: France Oilfield Services Industry Revenue (Million) Forecast, by Application 2019 & 2032
- Table 57: United Kingdom Oilfield Services Industry Revenue (Million) Forecast, by Application 2019 & 2032
- Table 58: Italy Oilfield Services Industry Revenue (Million) Forecast, by Application 2019 & 2032
- Table 59: Russia Oilfield Services Industry Revenue (Million) Forecast, by Application 2019 & 2032
- Table 60: Spain Oilfield Services Industry Revenue (Million) Forecast, by Application 2019 & 2032
- Table 61: NORDIC Oilfield Services Industry Revenue (Million) Forecast, by Application 2019 & 2032
- Table 62: Turkey Oilfield Services Industry Revenue (Million) Forecast, by Application 2019 & 2032
- Table 63: Rest of Europe Oilfield Services Industry Revenue (Million) Forecast, by Application 2019 & 2032
- Table 64: Global Oilfield Services Industry Revenue Million Forecast, by Service Type 2019 & 2032
- Table 65: Global Oilfield Services Industry Revenue Million Forecast, by Location of Deployment 2019 & 2032
- Table 66: Global Oilfield Services Industry Revenue Million Forecast, by Country 2019 & 2032
- Table 67: China Oilfield Services Industry Revenue (Million) Forecast, by Application 2019 & 2032
- Table 68: India Oilfield Services Industry Revenue (Million) Forecast, by Application 2019 & 2032
- Table 69: Japan Oilfield Services Industry Revenue (Million) Forecast, by Application 2019 & 2032
- Table 70: South Korea Oilfield Services Industry Revenue (Million) Forecast, by Application 2019 & 2032
- Table 71: Malaysia Oilfield Services Industry Revenue (Million) Forecast, by Application 2019 & 2032
- Table 72: Thailand Oilfield Services Industry Revenue (Million) Forecast, by Application 2019 & 2032
- Table 73: Vietnam Oilfield Services Industry Revenue (Million) Forecast, by Application 2019 & 2032
- Table 74: Rest of Asia Pacific Oilfield Services Industry Revenue (Million) Forecast, by Application 2019 & 2032
- Table 75: Global Oilfield Services Industry Revenue Million Forecast, by Service Type 2019 & 2032
- Table 76: Global Oilfield Services Industry Revenue Million Forecast, by Location of Deployment 2019 & 2032
- Table 77: Global Oilfield Services Industry Revenue Million Forecast, by Country 2019 & 2032
- Table 78: Brazil Oilfield Services Industry Revenue (Million) Forecast, by Application 2019 & 2032
- Table 79: Argentina Oilfield Services Industry Revenue (Million) Forecast, by Application 2019 & 2032
- Table 80: Colombia Oilfield Services Industry Revenue (Million) Forecast, by Application 2019 & 2032
- Table 81: Rest of South America Oilfield Services Industry Revenue (Million) Forecast, by Application 2019 & 2032
- Table 82: Global Oilfield Services Industry Revenue Million Forecast, by Service Type 2019 & 2032
- Table 83: Global Oilfield Services Industry Revenue Million Forecast, by Location of Deployment 2019 & 2032
- Table 84: Global Oilfield Services Industry Revenue Million Forecast, by Country 2019 & 2032
- Table 85: Saudi Arabia Oilfield Services Industry Revenue (Million) Forecast, by Application 2019 & 2032
- Table 86: United Arab Emirates Oilfield Services Industry Revenue (Million) Forecast, by Application 2019 & 2032
- Table 87: South Africa Oilfield Services Industry Revenue (Million) Forecast, by Application 2019 & 2032
- Table 88: Nigeria Oilfield Services Industry Revenue (Million) Forecast, by Application 2019 & 2032
- Table 89: Qatar Oilfield Services Industry Revenue (Million) Forecast, by Application 2019 & 2032
- Table 90: Egypt Oilfield Services Industry Revenue (Million) Forecast, by Application 2019 & 2032
- Table 91: Rest of the Middle East and Africa Oilfield Services Industry Revenue (Million) Forecast, by Application 2019 & 2032
Frequently Asked Questions
1. What is the projected Compound Annual Growth Rate (CAGR) of the Oilfield Services Industry?
The projected CAGR is approximately 5.83%.
2. Which companies are prominent players in the Oilfield Services Industry?
Key companies in the market include Expro Group, Basic Energy Services Inc, Nabors Industries Inc, Weatherford International PLC, Transocean Ltd, Baker Hughes Company, China Oilfield Services Limited, Halliburton Company, OiLSERV, Schlumberger Limited, Valaris PLC.
3. What are the main segments of the Oilfield Services Industry?
The market segments include Service Type, Location of Deployment.
4. Can you provide details about the market size?
The market size is estimated to be USD 119.36 Million as of 2022.
5. What are some drivers contributing to market growth?
4.; Increasing Development of Gas Reserves and Advanced Technology. Tools. and Equipment4.; Increasing Investment in the Oilfield Services across World.
6. What are the notable trends driving market growth?
Drilling Services Are Expected to Dominate the Market.
7. Are there any restraints impacting market growth?
4.; The Volatile Oil Prices Over the Recent Period. Owing to the Supply-Demand Gap.
8. Can you provide examples of recent developments in the market?
September 2023: SLB signed a subsurface technology agreement with INEOS Energy, the energy division of INEOS, a global chemical and manufacturing company. INEOS Energy will partner with SLB’s Performance Centre in Aberdeen to collaborate and innovate subsurface technologies, including AI capabilities, to help it drive operational performance for continued growth, new acquisitions, and carbon capture and storage (CCS).
9. What pricing options are available for accessing the report?
Pricing options include single-user, multi-user, and enterprise licenses priced at USD 4750, USD 5250, and USD 8750 respectively.
10. Is the market size provided in terms of value or volume?
The market size is provided in terms of value, measured in Million.
11. Are there any specific market keywords associated with the report?
Yes, the market keyword associated with the report is "Oilfield Services Industry," which aids in identifying and referencing the specific market segment covered.
12. How do I determine which pricing option suits my needs best?
The pricing options vary based on user requirements and access needs. Individual users may opt for single-user licenses, while businesses requiring broader access may choose multi-user or enterprise licenses for cost-effective access to the report.
13. Are there any additional resources or data provided in the Oilfield Services Industry report?
While the report offers comprehensive insights, it's advisable to review the specific contents or supplementary materials provided to ascertain if additional resources or data are available.
14. How can I stay updated on further developments or reports in the Oilfield Services Industry?
To stay informed about further developments, trends, and reports in the Oilfield Services Industry, consider subscribing to industry newsletters, following relevant companies and organizations, or regularly checking reputable industry news sources and publications.
Methodology
Step 1 - Identification of Relevant Samples Size from Population Database


Step 2 - Approaches for Defining Global Market Size (Value, Volume* & Price*)

Note*: In applicable scenarios
Step 3 - Data Sources
Primary Research
- Web Analytics
- Survey Reports
- Research Institute
- Latest Research Reports
- Opinion Leaders
Secondary Research
- Annual Reports
- White Paper
- Latest Press Release
- Industry Association
- Paid Database
- Investor Presentations

Step 4 - Data Triangulation
Involves using different sources of information in order to increase the validity of a study
These sources are likely to be stakeholders in a program - participants, other researchers, program staff, other community members, and so on.
Then we put all data in single framework & apply various statistical tools to find out the dynamic on the market.
During the analysis stage, feedback from the stakeholder groups would be compared to determine areas of agreement as well as areas of divergence
