

Key Insights
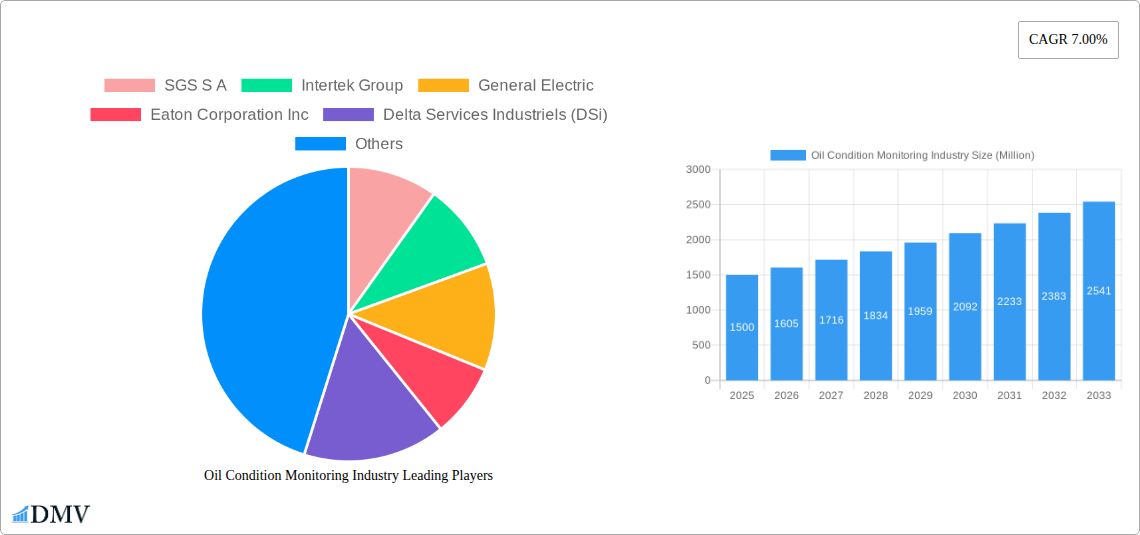
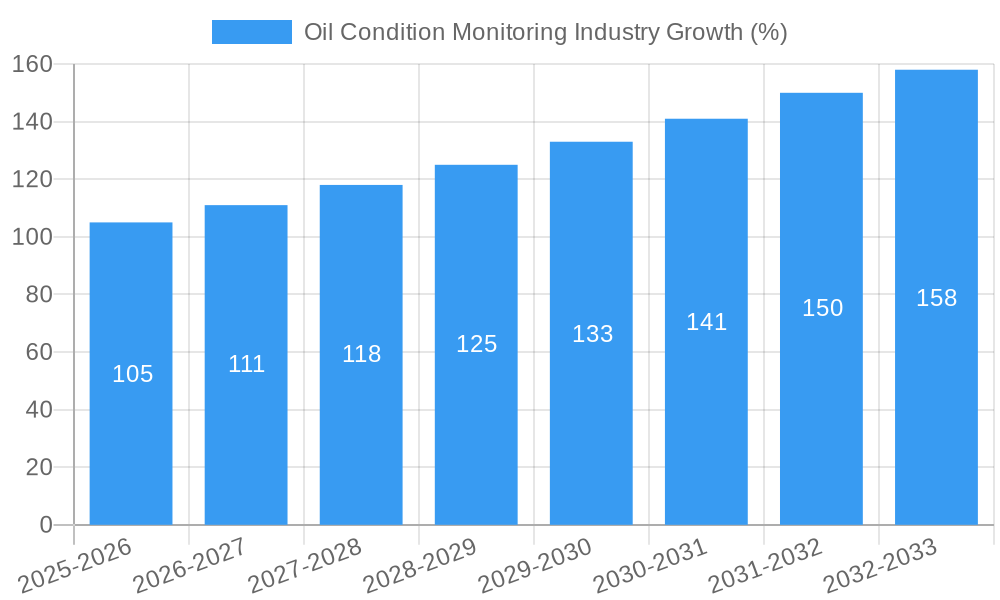
The global oil condition monitoring (OCM) market is experiencing robust growth, driven by the increasing need for enhanced equipment reliability, reduced operational costs, and proactive maintenance strategies across diverse industries. The market's value, estimated at $XX million in 2025, is projected to grow at a Compound Annual Growth Rate (CAGR) of 7% from 2025 to 2033, reaching a significant market size by the end of the forecast period. This expansion is fueled by several key factors. The rising adoption of advanced technologies, such as sensors and data analytics, provides more accurate and timely insights into equipment health, enabling predictive maintenance and minimizing costly downtime. Stringent environmental regulations are also playing a crucial role, pushing industries to optimize oil usage and reduce waste, thereby increasing demand for OCM solutions. Furthermore, the growing complexity of machinery in sectors like oil & gas and transportation necessitates effective monitoring systems to prevent catastrophic failures. On-site monitoring, particularly fixed continuous monitoring, is gaining traction due to its real-time capabilities, surpassing off-site methods in many applications. Among the product types, turbine and engine monitoring systems command a significant share, followed by gear and hydraulic system monitoring. Key players like SGS, Intertek, and General Electric are driving innovation and expanding their market presence through strategic partnerships, technological advancements, and acquisitions.
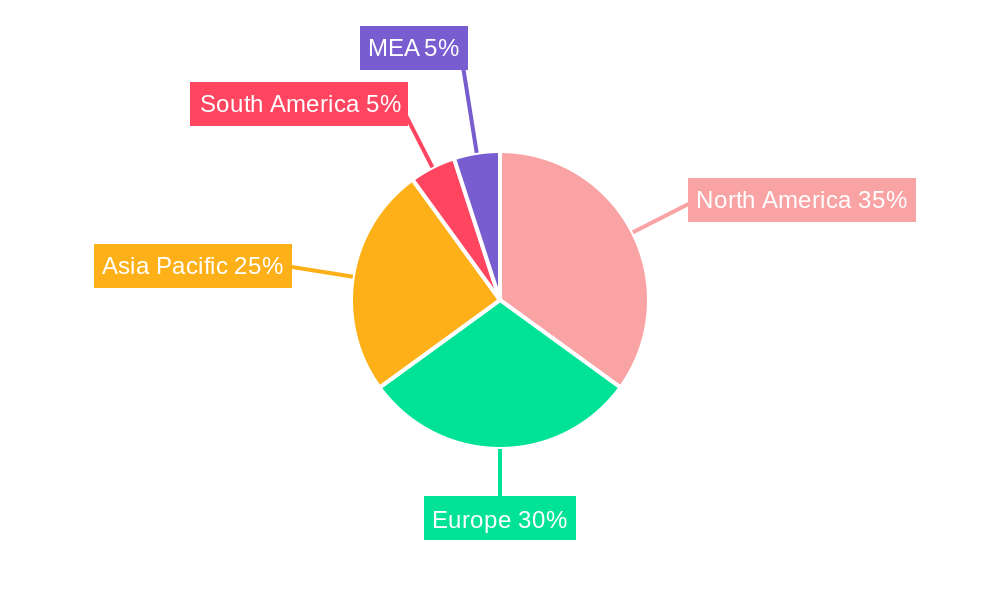
Growth in the OCM market is geographically diverse. North America and Europe currently hold substantial market shares, driven by high technological adoption and stringent regulatory compliance. However, the Asia-Pacific region is poised for significant growth due to increasing industrialization, particularly in countries like China and India. The expansion of the oil and gas sector in the Middle East and Africa also presents substantial opportunities for OCM providers. While the market faces certain restraints, such as the high initial investment costs of implementing OCM systems and the need for skilled personnel for data analysis and interpretation, the long-term benefits of reduced operational expenditure and enhanced safety are expected to outweigh these challenges, ensuring continued market growth throughout the forecast period. The ongoing digital transformation within industries and the increasing integration of IoT (Internet of Things) technologies are further expected to bolster market expansion in the coming years.
Oil Condition Monitoring Industry Market Report: 2019-2033
This comprehensive report provides a detailed analysis of the global Oil Condition Monitoring market, offering invaluable insights for stakeholders across the value chain. The study period spans 2019-2033, with a base year of 2025 and a forecast period of 2025-2033. The report reveals a market poised for significant growth, driven by technological advancements and increasing demand across diverse end-user industries. The market is estimated to be worth $xx Million in 2025 and is projected to reach $xx Million by 2033, exhibiting a robust CAGR. This in-depth analysis covers market segmentation, key players, emerging trends, and future opportunities, equipping businesses with the knowledge needed to navigate this dynamic landscape.
Oil Condition Monitoring Industry Market Composition & Trends
The global oil condition monitoring market is characterized by a moderately concentrated landscape, with major players such as SGS S A, Intertek Group, General Electric, and Eaton Corporation Inc holding significant market share. The market share distribution in 2025 is estimated as follows: SGS S A (15%), Intertek Group (12%), General Electric (10%), Eaton Corporation Inc (8%), and others (55%). This signifies opportunities for both established players and emerging companies to expand their footprint.
Innovation in sensor technology, predictive analytics, and cloud-based data management systems is driving market growth. Stringent environmental regulations and the increasing focus on operational efficiency are also key catalysts. Substitute products, such as visual inspections, are limited due to the accuracy and cost-effectiveness of oil condition monitoring systems.
The end-user profile spans diverse sectors, including transportation, oil & gas, industrial, mining, and power generation, each with unique monitoring requirements. The past five years have witnessed several mergers and acquisitions (M&A) activities in the oil condition monitoring market, with deal values exceeding $xx Million. These strategic alliances have facilitated technological integration and market expansion for participating companies.
- Market Concentration: Moderately concentrated, with top players holding significant shares.
- Innovation Catalysts: Advanced sensor technologies, predictive analytics, cloud-based solutions.
- Regulatory Landscape: Stringent environmental regulations driving adoption.
- Substitute Products: Limited due to accuracy and efficiency advantages of oil condition monitoring.
- M&A Activity: Significant M&A activity in the past five years, exceeding $xx Million in deal value.
Oil Condition Monitoring Industry Industry Evolution
The oil condition monitoring industry has witnessed remarkable growth over the historical period (2019-2024), with an average annual growth rate of xx%. This growth is attributed to several factors, including the increasing adoption of sophisticated diagnostic tools and predictive maintenance strategies. The integration of advanced technologies, such as machine learning and artificial intelligence, has significantly enhanced the accuracy and efficiency of oil condition monitoring systems. This has led to a shift in consumer demand, with a preference for proactive maintenance and reduced downtime. The market is experiencing a transition from reactive maintenance to preventative maintenance, leading to substantial cost savings and increased operational reliability for end users. Furthermore, the rising adoption of Industry 4.0 principles and the growing need for real-time data analysis are propelling market expansion. The forecast period (2025-2033) is expected to witness even more significant growth, propelled by increasing digitalization and the growing focus on optimizing asset utilization across various industries.
Leading Regions, Countries, or Segments in Oil Condition Monitoring Industry
The North American region is currently the leading market for oil condition monitoring, driven by substantial investments in infrastructure development and a strong focus on operational efficiency across various industries. This dominance is attributed to several factors:
- High Adoption of Advanced Technologies: North America has witnessed high adoption rates of advanced oil condition monitoring technologies such as sensors, data analytics, and cloud platforms.
- Stringent Regulations: Strict environmental regulations in the region necessitate the implementation of proactive maintenance strategies.
- Focus on Preventative Maintenance: The region demonstrates a higher preference for preventative maintenance, thereby boosting the demand for oil condition monitoring services.
- Significant Investments: Substantial investments in infrastructure and industrial projects are driving the adoption of oil condition monitoring systems.
Within the segments, On-Site (on-board, fixed continuous monitoring) sampling types hold a significant market share due to their real-time capabilities and ability to provide immediate alerts regarding equipment health. The Oil & Gas end-user industry remains the dominant segment, reflecting the critical need to avoid downtime in resource-intensive operations. Furthermore, the Turbine product type exhibits high growth due to their high cost and importance in power generation and industrial processes.
Oil Condition Monitoring Industry Product Innovations
Recent innovations include the development of sophisticated sensor technologies capable of detecting minute changes in oil properties, enabling earlier detection of potential equipment failures. Advancements in data analytics algorithms allow for more precise predictive maintenance scheduling, minimizing downtime and optimizing maintenance costs. The integration of cloud-based platforms facilitates real-time data monitoring and remote diagnostics, further improving operational efficiency. These innovations offer unique selling propositions (USPs) including enhanced accuracy, real-time monitoring, and proactive maintenance capabilities, all significantly impacting equipment reliability and cost optimization.
Propelling Factors for Oil Condition Monitoring Industry Growth
Technological advancements in sensor technology, data analytics, and cloud computing are key drivers. The increasing focus on predictive maintenance across various sectors, especially in asset-intensive industries like oil & gas and power generation, also fuels growth. Furthermore, stringent environmental regulations mandate regular monitoring, driving market expansion. Lastly, the decreasing cost of oil condition monitoring equipment is making it more accessible to a wider range of industries.
Obstacles in the Oil Condition Monitoring Industry Market
High initial investment costs for advanced systems can present a barrier to entry, particularly for smaller companies. Supply chain disruptions, particularly of critical components such as sensors, can impact market growth. Lastly, intense competition amongst established and emerging players can lead to price pressures and reduced profitability. The estimated impact of these factors on the market growth is a reduction of xx% in the forecast period.
Future Opportunities in Oil Condition Monitoring Industry
The expansion of oil condition monitoring into emerging markets presents significant opportunities. The integration of advanced technologies like AI and machine learning holds significant potential for enhancing predictive capabilities. Furthermore, increasing demand for real-time monitoring and remote diagnostics continues to expand this market. The development of more sustainable and environmentally friendly oil condition monitoring solutions is also a significant upcoming opportunity.
Major Players in the Oil Condition Monitoring Industry Ecosystem
- SGS S A
- Intertek Group
- General Electric
- Eaton Corporation Inc
- Delta Services Industriels (DSi)
- Parker-Hannifin Corporation
- Techenomics International
- Test Oil
- Chevron Corporation
- Royal Dutch Shell PLC
- Bureau Veritas
- Total S A
Key Developments in Oil Condition Monitoring Industry Industry
- 2022 Q3: SGS S A launched a new cloud-based oil condition monitoring platform.
- 2023 Q1: Intertek Group acquired a smaller oil condition monitoring company specializing in AI-powered diagnostics.
- 2024 Q2: General Electric released a new line of advanced sensors for turbine oil monitoring. (Further developments can be added here as needed).
Strategic Oil Condition Monitoring Industry Market Forecast
The oil condition monitoring market is poised for continued robust growth driven by ongoing technological advancements, increasing demand for proactive maintenance, and the growing adoption of digitalization strategies across various industries. The expanding focus on operational efficiency, particularly in asset-intensive sectors, will continue to fuel demand for advanced monitoring solutions. Furthermore, the entrance of new players and strategic partnerships will further contribute to market expansion, ensuring that this critical sector remains dynamic and competitive throughout the forecast period.
Oil Condition Monitoring Industry Segmentation
-
1. Sampling Type
- 1.1. On-Site (on-board,fixed continous monitoring)
- 1.2. Off-Site
-
2. Product Type
- 2.1. Turbine
- 2.2. engines
- 2.3. Gear System
- 2.4. Hydraulic System
- 2.5. Compressors
-
3. End-user Industry
- 3.1. Transportation
- 3.2. Oil & Gas
- 3.3. Industrial
- 3.4. Mining
- 3.5. Power Generation
Oil Condition Monitoring Industry Segmentation By Geography
-
1. North America
- 1.1. United States
- 1.2. Canada
-
2. Europe
- 2.1. Germany
- 2.2. United Kingdom
- 2.3. France
- 2.4. Rest of Europe
-
3. Asia Pacific
- 3.1. India
- 3.2. China
- 3.3. Japan
- 3.4. Rest of Asia Pacific
-
4. Latin America
- 4.1. Brazil
- 4.2. Argentina
- 4.3. Rest of Latin America
-
5. Middle East and Africa
- 5.1. United Arab Emirates
- 5.2. Saudi Arabia
- 5.3. Rest of Middle East and Africa
Oil Condition Monitoring Industry REPORT HIGHLIGHTS
| Aspects | Details |
|---|---|
| Study Period | 2019-2033 |
| Base Year | 2024 |
| Estimated Year | 2025 |
| Forecast Period | 2025-2033 |
| Historical Period | 2019-2024 |
| Growth Rate | CAGR of 7.00% from 2019-2033 |
| Segmentation |
|
Table of Contents
- 1. Introduction
- 1.1. Research Scope
- 1.2. Market Segmentation
- 1.3. Research Methodology
- 1.4. Definitions and Assumptions
- 2. Executive Summary
- 2.1. Introduction
- 3. Market Dynamics
- 3.1. Introduction
- 3.2. Market Drivers
- 3.2.1. Growing demand for Smart Consumer Electronics and Next Generation Technologies; Increasing Industrial Applications of the Technology
- 3.3. Market Restrains
- 3.3.1. High Manufacturing and Fabricating Costs
- 3.4. Market Trends
- 3.4.1. Transportation Industry to hold major market share
- 4. Market Factor Analysis
- 4.1. Porters Five Forces
- 4.2. Supply/Value Chain
- 4.3. PESTEL analysis
- 4.4. Market Entropy
- 4.5. Patent/Trademark Analysis
- 5. Global Oil Condition Monitoring Industry Analysis, Insights and Forecast, 2019-2031
- 5.1. Market Analysis, Insights and Forecast - by Sampling Type
- 5.1.1. On-Site (on-board,fixed continous monitoring)
- 5.1.2. Off-Site
- 5.2. Market Analysis, Insights and Forecast - by Product Type
- 5.2.1. Turbine
- 5.2.2. engines
- 5.2.3. Gear System
- 5.2.4. Hydraulic System
- 5.2.5. Compressors
- 5.3. Market Analysis, Insights and Forecast - by End-user Industry
- 5.3.1. Transportation
- 5.3.2. Oil & Gas
- 5.3.3. Industrial
- 5.3.4. Mining
- 5.3.5. Power Generation
- 5.4. Market Analysis, Insights and Forecast - by Region
- 5.4.1. North America
- 5.4.2. Europe
- 5.4.3. Asia Pacific
- 5.4.4. Latin America
- 5.4.5. Middle East and Africa
- 5.1. Market Analysis, Insights and Forecast - by Sampling Type
- 6. North America Oil Condition Monitoring Industry Analysis, Insights and Forecast, 2019-2031
- 6.1. Market Analysis, Insights and Forecast - by Sampling Type
- 6.1.1. On-Site (on-board,fixed continous monitoring)
- 6.1.2. Off-Site
- 6.2. Market Analysis, Insights and Forecast - by Product Type
- 6.2.1. Turbine
- 6.2.2. engines
- 6.2.3. Gear System
- 6.2.4. Hydraulic System
- 6.2.5. Compressors
- 6.3. Market Analysis, Insights and Forecast - by End-user Industry
- 6.3.1. Transportation
- 6.3.2. Oil & Gas
- 6.3.3. Industrial
- 6.3.4. Mining
- 6.3.5. Power Generation
- 6.1. Market Analysis, Insights and Forecast - by Sampling Type
- 7. Europe Oil Condition Monitoring Industry Analysis, Insights and Forecast, 2019-2031
- 7.1. Market Analysis, Insights and Forecast - by Sampling Type
- 7.1.1. On-Site (on-board,fixed continous monitoring)
- 7.1.2. Off-Site
- 7.2. Market Analysis, Insights and Forecast - by Product Type
- 7.2.1. Turbine
- 7.2.2. engines
- 7.2.3. Gear System
- 7.2.4. Hydraulic System
- 7.2.5. Compressors
- 7.3. Market Analysis, Insights and Forecast - by End-user Industry
- 7.3.1. Transportation
- 7.3.2. Oil & Gas
- 7.3.3. Industrial
- 7.3.4. Mining
- 7.3.5. Power Generation
- 7.1. Market Analysis, Insights and Forecast - by Sampling Type
- 8. Asia Pacific Oil Condition Monitoring Industry Analysis, Insights and Forecast, 2019-2031
- 8.1. Market Analysis, Insights and Forecast - by Sampling Type
- 8.1.1. On-Site (on-board,fixed continous monitoring)
- 8.1.2. Off-Site
- 8.2. Market Analysis, Insights and Forecast - by Product Type
- 8.2.1. Turbine
- 8.2.2. engines
- 8.2.3. Gear System
- 8.2.4. Hydraulic System
- 8.2.5. Compressors
- 8.3. Market Analysis, Insights and Forecast - by End-user Industry
- 8.3.1. Transportation
- 8.3.2. Oil & Gas
- 8.3.3. Industrial
- 8.3.4. Mining
- 8.3.5. Power Generation
- 8.1. Market Analysis, Insights and Forecast - by Sampling Type
- 9. Latin America Oil Condition Monitoring Industry Analysis, Insights and Forecast, 2019-2031
- 9.1. Market Analysis, Insights and Forecast - by Sampling Type
- 9.1.1. On-Site (on-board,fixed continous monitoring)
- 9.1.2. Off-Site
- 9.2. Market Analysis, Insights and Forecast - by Product Type
- 9.2.1. Turbine
- 9.2.2. engines
- 9.2.3. Gear System
- 9.2.4. Hydraulic System
- 9.2.5. Compressors
- 9.3. Market Analysis, Insights and Forecast - by End-user Industry
- 9.3.1. Transportation
- 9.3.2. Oil & Gas
- 9.3.3. Industrial
- 9.3.4. Mining
- 9.3.5. Power Generation
- 9.1. Market Analysis, Insights and Forecast - by Sampling Type
- 10. Middle East and Africa Oil Condition Monitoring Industry Analysis, Insights and Forecast, 2019-2031
- 10.1. Market Analysis, Insights and Forecast - by Sampling Type
- 10.1.1. On-Site (on-board,fixed continous monitoring)
- 10.1.2. Off-Site
- 10.2. Market Analysis, Insights and Forecast - by Product Type
- 10.2.1. Turbine
- 10.2.2. engines
- 10.2.3. Gear System
- 10.2.4. Hydraulic System
- 10.2.5. Compressors
- 10.3. Market Analysis, Insights and Forecast - by End-user Industry
- 10.3.1. Transportation
- 10.3.2. Oil & Gas
- 10.3.3. Industrial
- 10.3.4. Mining
- 10.3.5. Power Generation
- 10.1. Market Analysis, Insights and Forecast - by Sampling Type
- 11. North America Oil Condition Monitoring Industry Analysis, Insights and Forecast, 2019-2031
- 11.1. Market Analysis, Insights and Forecast - By Country/Sub-region
- 11.1.1 United States
- 11.1.2 Canada
- 11.1.3 Mexico
- 12. Europe Oil Condition Monitoring Industry Analysis, Insights and Forecast, 2019-2031
- 12.1. Market Analysis, Insights and Forecast - By Country/Sub-region
- 12.1.1 Germany
- 12.1.2 United Kingdom
- 12.1.3 France
- 12.1.4 Spain
- 12.1.5 Italy
- 12.1.6 Spain
- 12.1.7 Belgium
- 12.1.8 Netherland
- 12.1.9 Nordics
- 12.1.10 Rest of Europe
- 13. Asia Pacific Oil Condition Monitoring Industry Analysis, Insights and Forecast, 2019-2031
- 13.1. Market Analysis, Insights and Forecast - By Country/Sub-region
- 13.1.1 China
- 13.1.2 Japan
- 13.1.3 India
- 13.1.4 South Korea
- 13.1.5 Southeast Asia
- 13.1.6 Australia
- 13.1.7 Indonesia
- 13.1.8 Phillipes
- 13.1.9 Singapore
- 13.1.10 Thailandc
- 13.1.11 Rest of Asia Pacific
- 14. South America Oil Condition Monitoring Industry Analysis, Insights and Forecast, 2019-2031
- 14.1. Market Analysis, Insights and Forecast - By Country/Sub-region
- 14.1.1 Brazil
- 14.1.2 Argentina
- 14.1.3 Peru
- 14.1.4 Chile
- 14.1.5 Colombia
- 14.1.6 Ecuador
- 14.1.7 Venezuela
- 14.1.8 Rest of South America
- 15. North America Oil Condition Monitoring Industry Analysis, Insights and Forecast, 2019-2031
- 15.1. Market Analysis, Insights and Forecast - By Country/Sub-region
- 15.1.1 United States
- 15.1.2 Canada
- 15.1.3 Mexico
- 16. MEA Oil Condition Monitoring Industry Analysis, Insights and Forecast, 2019-2031
- 16.1. Market Analysis, Insights and Forecast - By Country/Sub-region
- 16.1.1 United Arab Emirates
- 16.1.2 Saudi Arabia
- 16.1.3 South Africa
- 16.1.4 Rest of Middle East and Africa
- 17. Competitive Analysis
- 17.1. Global Market Share Analysis 2024
- 17.2. Company Profiles
- 17.2.1 SGS S A
- 17.2.1.1. Overview
- 17.2.1.2. Products
- 17.2.1.3. SWOT Analysis
- 17.2.1.4. Recent Developments
- 17.2.1.5. Financials (Based on Availability)
- 17.2.2 Intertek Group
- 17.2.2.1. Overview
- 17.2.2.2. Products
- 17.2.2.3. SWOT Analysis
- 17.2.2.4. Recent Developments
- 17.2.2.5. Financials (Based on Availability)
- 17.2.3 General Electric
- 17.2.3.1. Overview
- 17.2.3.2. Products
- 17.2.3.3. SWOT Analysis
- 17.2.3.4. Recent Developments
- 17.2.3.5. Financials (Based on Availability)
- 17.2.4 Eaton Corporation Inc
- 17.2.4.1. Overview
- 17.2.4.2. Products
- 17.2.4.3. SWOT Analysis
- 17.2.4.4. Recent Developments
- 17.2.4.5. Financials (Based on Availability)
- 17.2.5 Delta Services Industriels (DSi)
- 17.2.5.1. Overview
- 17.2.5.2. Products
- 17.2.5.3. SWOT Analysis
- 17.2.5.4. Recent Developments
- 17.2.5.5. Financials (Based on Availability)
- 17.2.6 Parker-Hannifin Corporation
- 17.2.6.1. Overview
- 17.2.6.2. Products
- 17.2.6.3. SWOT Analysis
- 17.2.6.4. Recent Developments
- 17.2.6.5. Financials (Based on Availability)
- 17.2.7 Techenomics International
- 17.2.7.1. Overview
- 17.2.7.2. Products
- 17.2.7.3. SWOT Analysis
- 17.2.7.4. Recent Developments
- 17.2.7.5. Financials (Based on Availability)
- 17.2.8 Test Oil
- 17.2.8.1. Overview
- 17.2.8.2. Products
- 17.2.8.3. SWOT Analysis
- 17.2.8.4. Recent Developments
- 17.2.8.5. Financials (Based on Availability)
- 17.2.9 Chevron Corporation
- 17.2.9.1. Overview
- 17.2.9.2. Products
- 17.2.9.3. SWOT Analysis
- 17.2.9.4. Recent Developments
- 17.2.9.5. Financials (Based on Availability)
- 17.2.10 Royal Dutch Shell PLC
- 17.2.10.1. Overview
- 17.2.10.2. Products
- 17.2.10.3. SWOT Analysis
- 17.2.10.4. Recent Developments
- 17.2.10.5. Financials (Based on Availability)
- 17.2.11 Bureau Veritas
- 17.2.11.1. Overview
- 17.2.11.2. Products
- 17.2.11.3. SWOT Analysis
- 17.2.11.4. Recent Developments
- 17.2.11.5. Financials (Based on Availability)
- 17.2.12 Total S A
- 17.2.12.1. Overview
- 17.2.12.2. Products
- 17.2.12.3. SWOT Analysis
- 17.2.12.4. Recent Developments
- 17.2.12.5. Financials (Based on Availability)
- 17.2.1 SGS S A
List of Figures
- Figure 1: Global Oil Condition Monitoring Industry Revenue Breakdown (Million, %) by Region 2024 & 2032
- Figure 2: North America Oil Condition Monitoring Industry Revenue (Million), by Country 2024 & 2032
- Figure 3: North America Oil Condition Monitoring Industry Revenue Share (%), by Country 2024 & 2032
- Figure 4: Europe Oil Condition Monitoring Industry Revenue (Million), by Country 2024 & 2032
- Figure 5: Europe Oil Condition Monitoring Industry Revenue Share (%), by Country 2024 & 2032
- Figure 6: Asia Pacific Oil Condition Monitoring Industry Revenue (Million), by Country 2024 & 2032
- Figure 7: Asia Pacific Oil Condition Monitoring Industry Revenue Share (%), by Country 2024 & 2032
- Figure 8: South America Oil Condition Monitoring Industry Revenue (Million), by Country 2024 & 2032
- Figure 9: South America Oil Condition Monitoring Industry Revenue Share (%), by Country 2024 & 2032
- Figure 10: North America Oil Condition Monitoring Industry Revenue (Million), by Country 2024 & 2032
- Figure 11: North America Oil Condition Monitoring Industry Revenue Share (%), by Country 2024 & 2032
- Figure 12: MEA Oil Condition Monitoring Industry Revenue (Million), by Country 2024 & 2032
- Figure 13: MEA Oil Condition Monitoring Industry Revenue Share (%), by Country 2024 & 2032
- Figure 14: North America Oil Condition Monitoring Industry Revenue (Million), by Sampling Type 2024 & 2032
- Figure 15: North America Oil Condition Monitoring Industry Revenue Share (%), by Sampling Type 2024 & 2032
- Figure 16: North America Oil Condition Monitoring Industry Revenue (Million), by Product Type 2024 & 2032
- Figure 17: North America Oil Condition Monitoring Industry Revenue Share (%), by Product Type 2024 & 2032
- Figure 18: North America Oil Condition Monitoring Industry Revenue (Million), by End-user Industry 2024 & 2032
- Figure 19: North America Oil Condition Monitoring Industry Revenue Share (%), by End-user Industry 2024 & 2032
- Figure 20: North America Oil Condition Monitoring Industry Revenue (Million), by Country 2024 & 2032
- Figure 21: North America Oil Condition Monitoring Industry Revenue Share (%), by Country 2024 & 2032
- Figure 22: Europe Oil Condition Monitoring Industry Revenue (Million), by Sampling Type 2024 & 2032
- Figure 23: Europe Oil Condition Monitoring Industry Revenue Share (%), by Sampling Type 2024 & 2032
- Figure 24: Europe Oil Condition Monitoring Industry Revenue (Million), by Product Type 2024 & 2032
- Figure 25: Europe Oil Condition Monitoring Industry Revenue Share (%), by Product Type 2024 & 2032
- Figure 26: Europe Oil Condition Monitoring Industry Revenue (Million), by End-user Industry 2024 & 2032
- Figure 27: Europe Oil Condition Monitoring Industry Revenue Share (%), by End-user Industry 2024 & 2032
- Figure 28: Europe Oil Condition Monitoring Industry Revenue (Million), by Country 2024 & 2032
- Figure 29: Europe Oil Condition Monitoring Industry Revenue Share (%), by Country 2024 & 2032
- Figure 30: Asia Pacific Oil Condition Monitoring Industry Revenue (Million), by Sampling Type 2024 & 2032
- Figure 31: Asia Pacific Oil Condition Monitoring Industry Revenue Share (%), by Sampling Type 2024 & 2032
- Figure 32: Asia Pacific Oil Condition Monitoring Industry Revenue (Million), by Product Type 2024 & 2032
- Figure 33: Asia Pacific Oil Condition Monitoring Industry Revenue Share (%), by Product Type 2024 & 2032
- Figure 34: Asia Pacific Oil Condition Monitoring Industry Revenue (Million), by End-user Industry 2024 & 2032
- Figure 35: Asia Pacific Oil Condition Monitoring Industry Revenue Share (%), by End-user Industry 2024 & 2032
- Figure 36: Asia Pacific Oil Condition Monitoring Industry Revenue (Million), by Country 2024 & 2032
- Figure 37: Asia Pacific Oil Condition Monitoring Industry Revenue Share (%), by Country 2024 & 2032
- Figure 38: Latin America Oil Condition Monitoring Industry Revenue (Million), by Sampling Type 2024 & 2032
- Figure 39: Latin America Oil Condition Monitoring Industry Revenue Share (%), by Sampling Type 2024 & 2032
- Figure 40: Latin America Oil Condition Monitoring Industry Revenue (Million), by Product Type 2024 & 2032
- Figure 41: Latin America Oil Condition Monitoring Industry Revenue Share (%), by Product Type 2024 & 2032
- Figure 42: Latin America Oil Condition Monitoring Industry Revenue (Million), by End-user Industry 2024 & 2032
- Figure 43: Latin America Oil Condition Monitoring Industry Revenue Share (%), by End-user Industry 2024 & 2032
- Figure 44: Latin America Oil Condition Monitoring Industry Revenue (Million), by Country 2024 & 2032
- Figure 45: Latin America Oil Condition Monitoring Industry Revenue Share (%), by Country 2024 & 2032
- Figure 46: Middle East and Africa Oil Condition Monitoring Industry Revenue (Million), by Sampling Type 2024 & 2032
- Figure 47: Middle East and Africa Oil Condition Monitoring Industry Revenue Share (%), by Sampling Type 2024 & 2032
- Figure 48: Middle East and Africa Oil Condition Monitoring Industry Revenue (Million), by Product Type 2024 & 2032
- Figure 49: Middle East and Africa Oil Condition Monitoring Industry Revenue Share (%), by Product Type 2024 & 2032
- Figure 50: Middle East and Africa Oil Condition Monitoring Industry Revenue (Million), by End-user Industry 2024 & 2032
- Figure 51: Middle East and Africa Oil Condition Monitoring Industry Revenue Share (%), by End-user Industry 2024 & 2032
- Figure 52: Middle East and Africa Oil Condition Monitoring Industry Revenue (Million), by Country 2024 & 2032
- Figure 53: Middle East and Africa Oil Condition Monitoring Industry Revenue Share (%), by Country 2024 & 2032
List of Tables
- Table 1: Global Oil Condition Monitoring Industry Revenue Million Forecast, by Region 2019 & 2032
- Table 2: Global Oil Condition Monitoring Industry Revenue Million Forecast, by Sampling Type 2019 & 2032
- Table 3: Global Oil Condition Monitoring Industry Revenue Million Forecast, by Product Type 2019 & 2032
- Table 4: Global Oil Condition Monitoring Industry Revenue Million Forecast, by End-user Industry 2019 & 2032
- Table 5: Global Oil Condition Monitoring Industry Revenue Million Forecast, by Region 2019 & 2032
- Table 6: Global Oil Condition Monitoring Industry Revenue Million Forecast, by Country 2019 & 2032
- Table 7: United States Oil Condition Monitoring Industry Revenue (Million) Forecast, by Application 2019 & 2032
- Table 8: Canada Oil Condition Monitoring Industry Revenue (Million) Forecast, by Application 2019 & 2032
- Table 9: Mexico Oil Condition Monitoring Industry Revenue (Million) Forecast, by Application 2019 & 2032
- Table 10: Global Oil Condition Monitoring Industry Revenue Million Forecast, by Country 2019 & 2032
- Table 11: Germany Oil Condition Monitoring Industry Revenue (Million) Forecast, by Application 2019 & 2032
- Table 12: United Kingdom Oil Condition Monitoring Industry Revenue (Million) Forecast, by Application 2019 & 2032
- Table 13: France Oil Condition Monitoring Industry Revenue (Million) Forecast, by Application 2019 & 2032
- Table 14: Spain Oil Condition Monitoring Industry Revenue (Million) Forecast, by Application 2019 & 2032
- Table 15: Italy Oil Condition Monitoring Industry Revenue (Million) Forecast, by Application 2019 & 2032
- Table 16: Spain Oil Condition Monitoring Industry Revenue (Million) Forecast, by Application 2019 & 2032
- Table 17: Belgium Oil Condition Monitoring Industry Revenue (Million) Forecast, by Application 2019 & 2032
- Table 18: Netherland Oil Condition Monitoring Industry Revenue (Million) Forecast, by Application 2019 & 2032
- Table 19: Nordics Oil Condition Monitoring Industry Revenue (Million) Forecast, by Application 2019 & 2032
- Table 20: Rest of Europe Oil Condition Monitoring Industry Revenue (Million) Forecast, by Application 2019 & 2032
- Table 21: Global Oil Condition Monitoring Industry Revenue Million Forecast, by Country 2019 & 2032
- Table 22: China Oil Condition Monitoring Industry Revenue (Million) Forecast, by Application 2019 & 2032
- Table 23: Japan Oil Condition Monitoring Industry Revenue (Million) Forecast, by Application 2019 & 2032
- Table 24: India Oil Condition Monitoring Industry Revenue (Million) Forecast, by Application 2019 & 2032
- Table 25: South Korea Oil Condition Monitoring Industry Revenue (Million) Forecast, by Application 2019 & 2032
- Table 26: Southeast Asia Oil Condition Monitoring Industry Revenue (Million) Forecast, by Application 2019 & 2032
- Table 27: Australia Oil Condition Monitoring Industry Revenue (Million) Forecast, by Application 2019 & 2032
- Table 28: Indonesia Oil Condition Monitoring Industry Revenue (Million) Forecast, by Application 2019 & 2032
- Table 29: Phillipes Oil Condition Monitoring Industry Revenue (Million) Forecast, by Application 2019 & 2032
- Table 30: Singapore Oil Condition Monitoring Industry Revenue (Million) Forecast, by Application 2019 & 2032
- Table 31: Thailandc Oil Condition Monitoring Industry Revenue (Million) Forecast, by Application 2019 & 2032
- Table 32: Rest of Asia Pacific Oil Condition Monitoring Industry Revenue (Million) Forecast, by Application 2019 & 2032
- Table 33: Global Oil Condition Monitoring Industry Revenue Million Forecast, by Country 2019 & 2032
- Table 34: Brazil Oil Condition Monitoring Industry Revenue (Million) Forecast, by Application 2019 & 2032
- Table 35: Argentina Oil Condition Monitoring Industry Revenue (Million) Forecast, by Application 2019 & 2032
- Table 36: Peru Oil Condition Monitoring Industry Revenue (Million) Forecast, by Application 2019 & 2032
- Table 37: Chile Oil Condition Monitoring Industry Revenue (Million) Forecast, by Application 2019 & 2032
- Table 38: Colombia Oil Condition Monitoring Industry Revenue (Million) Forecast, by Application 2019 & 2032
- Table 39: Ecuador Oil Condition Monitoring Industry Revenue (Million) Forecast, by Application 2019 & 2032
- Table 40: Venezuela Oil Condition Monitoring Industry Revenue (Million) Forecast, by Application 2019 & 2032
- Table 41: Rest of South America Oil Condition Monitoring Industry Revenue (Million) Forecast, by Application 2019 & 2032
- Table 42: Global Oil Condition Monitoring Industry Revenue Million Forecast, by Country 2019 & 2032
- Table 43: United States Oil Condition Monitoring Industry Revenue (Million) Forecast, by Application 2019 & 2032
- Table 44: Canada Oil Condition Monitoring Industry Revenue (Million) Forecast, by Application 2019 & 2032
- Table 45: Mexico Oil Condition Monitoring Industry Revenue (Million) Forecast, by Application 2019 & 2032
- Table 46: Global Oil Condition Monitoring Industry Revenue Million Forecast, by Country 2019 & 2032
- Table 47: United Arab Emirates Oil Condition Monitoring Industry Revenue (Million) Forecast, by Application 2019 & 2032
- Table 48: Saudi Arabia Oil Condition Monitoring Industry Revenue (Million) Forecast, by Application 2019 & 2032
- Table 49: South Africa Oil Condition Monitoring Industry Revenue (Million) Forecast, by Application 2019 & 2032
- Table 50: Rest of Middle East and Africa Oil Condition Monitoring Industry Revenue (Million) Forecast, by Application 2019 & 2032
- Table 51: Global Oil Condition Monitoring Industry Revenue Million Forecast, by Sampling Type 2019 & 2032
- Table 52: Global Oil Condition Monitoring Industry Revenue Million Forecast, by Product Type 2019 & 2032
- Table 53: Global Oil Condition Monitoring Industry Revenue Million Forecast, by End-user Industry 2019 & 2032
- Table 54: Global Oil Condition Monitoring Industry Revenue Million Forecast, by Country 2019 & 2032
- Table 55: United States Oil Condition Monitoring Industry Revenue (Million) Forecast, by Application 2019 & 2032
- Table 56: Canada Oil Condition Monitoring Industry Revenue (Million) Forecast, by Application 2019 & 2032
- Table 57: Global Oil Condition Monitoring Industry Revenue Million Forecast, by Sampling Type 2019 & 2032
- Table 58: Global Oil Condition Monitoring Industry Revenue Million Forecast, by Product Type 2019 & 2032
- Table 59: Global Oil Condition Monitoring Industry Revenue Million Forecast, by End-user Industry 2019 & 2032
- Table 60: Global Oil Condition Monitoring Industry Revenue Million Forecast, by Country 2019 & 2032
- Table 61: Germany Oil Condition Monitoring Industry Revenue (Million) Forecast, by Application 2019 & 2032
- Table 62: United Kingdom Oil Condition Monitoring Industry Revenue (Million) Forecast, by Application 2019 & 2032
- Table 63: France Oil Condition Monitoring Industry Revenue (Million) Forecast, by Application 2019 & 2032
- Table 64: Rest of Europe Oil Condition Monitoring Industry Revenue (Million) Forecast, by Application 2019 & 2032
- Table 65: Global Oil Condition Monitoring Industry Revenue Million Forecast, by Sampling Type 2019 & 2032
- Table 66: Global Oil Condition Monitoring Industry Revenue Million Forecast, by Product Type 2019 & 2032
- Table 67: Global Oil Condition Monitoring Industry Revenue Million Forecast, by End-user Industry 2019 & 2032
- Table 68: Global Oil Condition Monitoring Industry Revenue Million Forecast, by Country 2019 & 2032
- Table 69: India Oil Condition Monitoring Industry Revenue (Million) Forecast, by Application 2019 & 2032
- Table 70: China Oil Condition Monitoring Industry Revenue (Million) Forecast, by Application 2019 & 2032
- Table 71: Japan Oil Condition Monitoring Industry Revenue (Million) Forecast, by Application 2019 & 2032
- Table 72: Rest of Asia Pacific Oil Condition Monitoring Industry Revenue (Million) Forecast, by Application 2019 & 2032
- Table 73: Global Oil Condition Monitoring Industry Revenue Million Forecast, by Sampling Type 2019 & 2032
- Table 74: Global Oil Condition Monitoring Industry Revenue Million Forecast, by Product Type 2019 & 2032
- Table 75: Global Oil Condition Monitoring Industry Revenue Million Forecast, by End-user Industry 2019 & 2032
- Table 76: Global Oil Condition Monitoring Industry Revenue Million Forecast, by Country 2019 & 2032
- Table 77: Brazil Oil Condition Monitoring Industry Revenue (Million) Forecast, by Application 2019 & 2032
- Table 78: Argentina Oil Condition Monitoring Industry Revenue (Million) Forecast, by Application 2019 & 2032
- Table 79: Rest of Latin America Oil Condition Monitoring Industry Revenue (Million) Forecast, by Application 2019 & 2032
- Table 80: Global Oil Condition Monitoring Industry Revenue Million Forecast, by Sampling Type 2019 & 2032
- Table 81: Global Oil Condition Monitoring Industry Revenue Million Forecast, by Product Type 2019 & 2032
- Table 82: Global Oil Condition Monitoring Industry Revenue Million Forecast, by End-user Industry 2019 & 2032
- Table 83: Global Oil Condition Monitoring Industry Revenue Million Forecast, by Country 2019 & 2032
- Table 84: United Arab Emirates Oil Condition Monitoring Industry Revenue (Million) Forecast, by Application 2019 & 2032
- Table 85: Saudi Arabia Oil Condition Monitoring Industry Revenue (Million) Forecast, by Application 2019 & 2032
- Table 86: Rest of Middle East and Africa Oil Condition Monitoring Industry Revenue (Million) Forecast, by Application 2019 & 2032
Frequently Asked Questions
1. What is the projected Compound Annual Growth Rate (CAGR) of the Oil Condition Monitoring Industry?
The projected CAGR is approximately 7.00%.
2. Which companies are prominent players in the Oil Condition Monitoring Industry?
Key companies in the market include SGS S A, Intertek Group, General Electric, Eaton Corporation Inc, Delta Services Industriels (DSi), Parker-Hannifin Corporation, Techenomics International, Test Oil, Chevron Corporation, Royal Dutch Shell PLC, Bureau Veritas, Total S A.
3. What are the main segments of the Oil Condition Monitoring Industry?
The market segments include Sampling Type, Product Type, End-user Industry.
4. Can you provide details about the market size?
The market size is estimated to be USD XX Million as of 2022.
5. What are some drivers contributing to market growth?
Growing demand for Smart Consumer Electronics and Next Generation Technologies; Increasing Industrial Applications of the Technology.
6. What are the notable trends driving market growth?
Transportation Industry to hold major market share.
7. Are there any restraints impacting market growth?
High Manufacturing and Fabricating Costs.
8. Can you provide examples of recent developments in the market?
N/A
9. What pricing options are available for accessing the report?
Pricing options include single-user, multi-user, and enterprise licenses priced at USD 4750, USD 5250, and USD 8750 respectively.
10. Is the market size provided in terms of value or volume?
The market size is provided in terms of value, measured in Million.
11. Are there any specific market keywords associated with the report?
Yes, the market keyword associated with the report is "Oil Condition Monitoring Industry," which aids in identifying and referencing the specific market segment covered.
12. How do I determine which pricing option suits my needs best?
The pricing options vary based on user requirements and access needs. Individual users may opt for single-user licenses, while businesses requiring broader access may choose multi-user or enterprise licenses for cost-effective access to the report.
13. Are there any additional resources or data provided in the Oil Condition Monitoring Industry report?
While the report offers comprehensive insights, it's advisable to review the specific contents or supplementary materials provided to ascertain if additional resources or data are available.
14. How can I stay updated on further developments or reports in the Oil Condition Monitoring Industry?
To stay informed about further developments, trends, and reports in the Oil Condition Monitoring Industry, consider subscribing to industry newsletters, following relevant companies and organizations, or regularly checking reputable industry news sources and publications.
Methodology
Step 1 - Identification of Relevant Samples Size from Population Database


Step 2 - Approaches for Defining Global Market Size (Value, Volume* & Price*)

Note*: In applicable scenarios
Step 3 - Data Sources
Primary Research
- Web Analytics
- Survey Reports
- Research Institute
- Latest Research Reports
- Opinion Leaders
Secondary Research
- Annual Reports
- White Paper
- Latest Press Release
- Industry Association
- Paid Database
- Investor Presentations

Step 4 - Data Triangulation
Involves using different sources of information in order to increase the validity of a study
These sources are likely to be stakeholders in a program - participants, other researchers, program staff, other community members, and so on.
Then we put all data in single framework & apply various statistical tools to find out the dynamic on the market.
During the analysis stage, feedback from the stakeholder groups would be compared to determine areas of agreement as well as areas of divergence
