

Key Insights
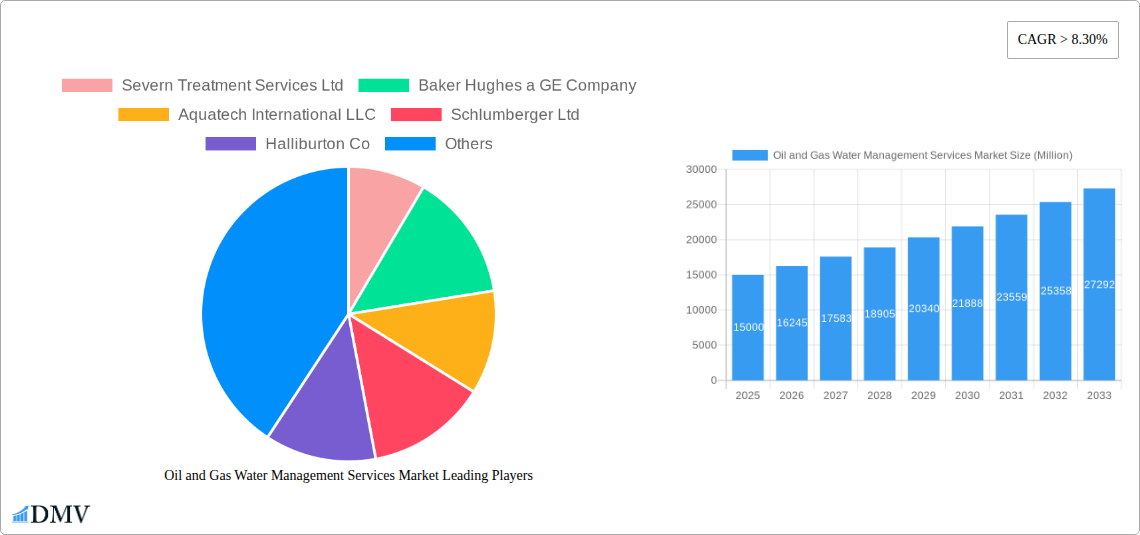
The Oil and Gas Water Management Services market is experiencing robust growth, projected to maintain a CAGR exceeding 8.3% from 2025 to 2033. This expansion is fueled by several key drivers. Stringent environmental regulations globally are pushing oil and gas companies to adopt more sustainable water management practices, significantly increasing demand for treatment and disposal services. Furthermore, the rising complexity of oil and gas extraction operations, particularly in unconventional resources like shale gas, necessitates sophisticated water management solutions. Increased exploration and production activities in various regions, coupled with a growing focus on reducing water footprints and minimizing environmental impact, further contribute to market growth. The market is segmented into upstream, downstream, and services (water disposal, hauling, treatment, and others). Upstream activities, primarily focused on efficient water usage during drilling and production, are expected to witness substantial growth alongside the increasing demand for produced water management. The downstream segment, encompassing refinery operations and related water management needs, shows a steady growth trajectory. Key players like Baker Hughes, Schlumberger, Halliburton, and Veolia are actively investing in technological advancements and strategic acquisitions to consolidate their market positions and capitalize on the growing demand. Competitive intensity is high, with companies focusing on innovative solutions and expanding service offerings to cater to the evolving needs of the industry. Geographic expansion, particularly in regions with burgeoning oil and gas activities such as the Asia-Pacific and Middle East & Africa, presents significant opportunities for market players.
However, the market faces challenges. Fluctuations in oil and gas prices directly impact investment decisions in water management infrastructure. The high capital expenditure required for advanced water treatment technologies can act as a restraint, particularly for smaller operators. Furthermore, the geographical dispersion of oil and gas operations can pose logistical challenges, impacting the cost-effectiveness of service delivery. Despite these challenges, the long-term outlook for the Oil and Gas Water Management Services market remains positive, driven by the inherent need for sustainable water management practices within the industry and the ongoing expansion of global energy production. The market's growth trajectory will continue to be shaped by technological innovation, regulatory developments, and fluctuating energy prices.
Oil and Gas Water Management Services Market: A Comprehensive Report (2019-2033)
This insightful report provides a comprehensive analysis of the Oil and Gas Water Management Services market, offering valuable insights for stakeholders seeking to navigate this dynamic industry. The study covers the period 2019-2033, with 2025 as the base and estimated year, and forecasts extending to 2033. The report delves into market segmentation, competitive landscape, technological advancements, and future growth potential, equipping readers with the knowledge to make informed business decisions. The market size is projected to reach xx Million by 2033, exhibiting a robust CAGR of xx% during the forecast period.
Oil and Gas Water Management Services Market Composition & Trends
This section provides a detailed overview of the Oil and Gas Water Management Services market, analyzing its structure, dynamics, and key influencing factors. We examine market concentration, identifying the leading players and their respective market share. For instance, the top 5 companies – Schlumberger Ltd, Halliburton Co, Baker Hughes a GE Company, Veolia Environnement SA, and Nuverra Environmental Solutions – collectively hold an estimated xx% market share in 2025. The report also explores the role of innovation, highlighting key technological advancements driving market growth, such as improved produced water treatment technologies and the adoption of automation in water hauling services. Furthermore, we assess the regulatory landscape, including environmental regulations and their impact on market participants. The increasing stringency of environmental regulations is pushing companies to adopt more sustainable water management practices, opening avenues for growth in the produced water treatment segment. The report also details the impact of substitute products, end-user profiles (upstream, downstream), and recent M&A activities, analyzing deal values and their implications for market consolidation. Examples of M&A activities include (but are not limited to) the xx Million acquisition of Company X by Company Y in 2024, showcasing the significant consolidation within the sector.
- Market Concentration: High, with top 5 players holding xx% market share (2025).
- Innovation Catalysts: Advanced water treatment technologies, automation, and digitalization.
- Regulatory Landscape: Increasingly stringent environmental regulations driving sustainable solutions.
- Substitute Products: Limited viable substitutes, primarily focusing on water reuse and recycling.
- End-User Profiles: Primarily upstream and downstream oil and gas operators.
- M&A Activities: Significant consolidation through mergers and acquisitions, with deal values exceeding xx Million in recent years.
Oil and Gas Water Management Services Market Industry Evolution
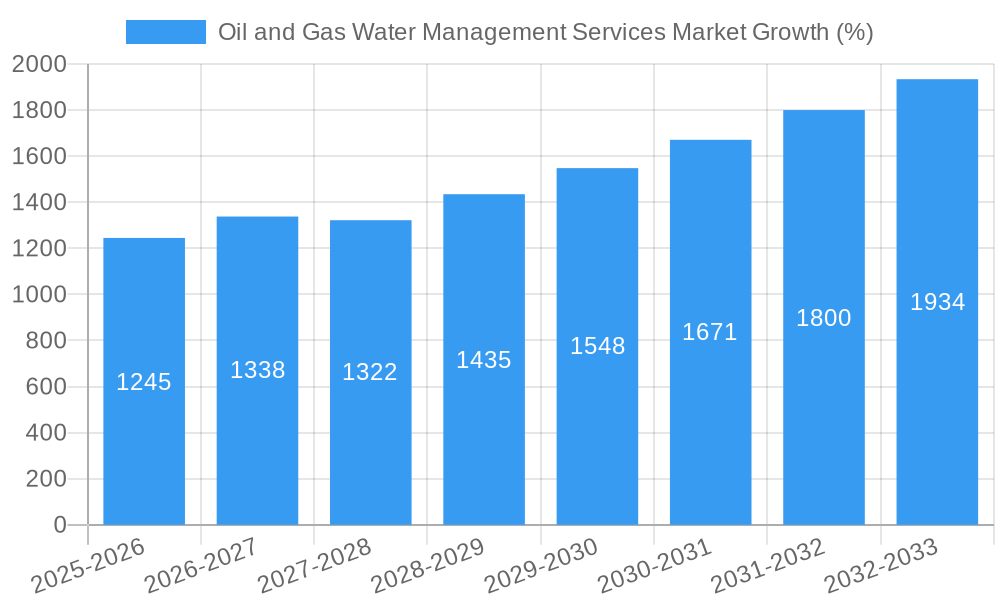
This section meticulously traces the evolution of the Oil and Gas Water Management Services market, analyzing its growth trajectory, technological advancements, and evolving consumer demands. From 2019 to 2024, the market experienced a CAGR of xx%, largely driven by increased oil and gas production and stringent environmental regulations. The forecast period (2025-2033) anticipates continued growth, propelled by factors such as the rising adoption of advanced water treatment technologies and increasing focus on water recycling and reuse. The market is witnessing a shift towards more sustainable and efficient water management practices, with a growing emphasis on reducing water footprint and minimizing environmental impact. Technological advancements, such as membrane filtration, reverse osmosis, and advanced oxidation processes, are improving the efficiency and effectiveness of produced water treatment. Furthermore, the adoption of digital technologies, including IoT sensors and data analytics, is optimizing water management operations and reducing costs. Consumer demand is increasingly focused on environmentally responsible practices, pushing companies to adopt sustainable water management solutions. This evolution towards sustainability is expected to accelerate in the coming years, driving further market growth. Specific data points, including growth rates and adoption metrics for various technologies, are included throughout this section.
Leading Regions, Countries, or Segments in Oil and Gas Water Management Services Market
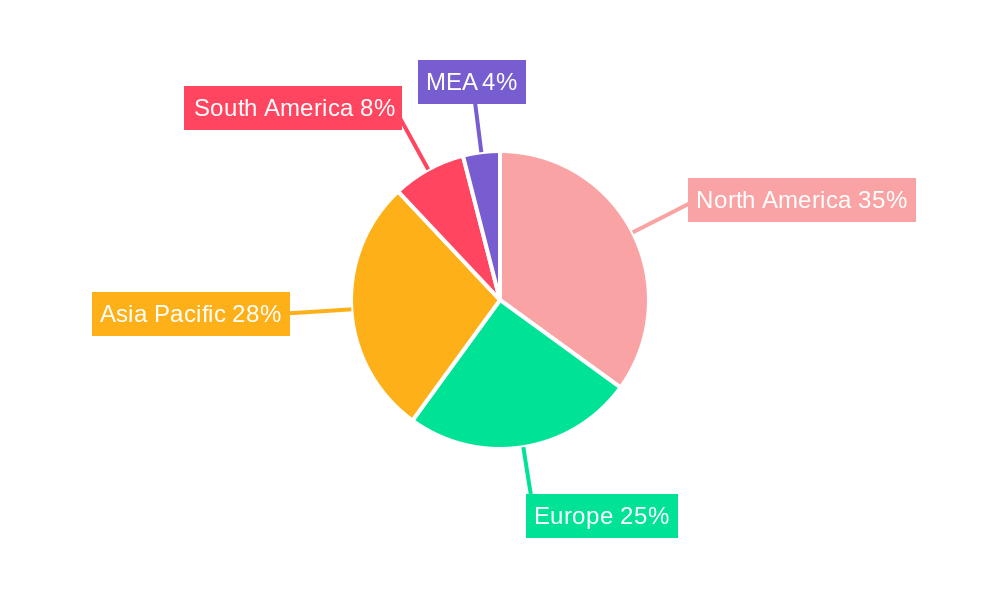
This section identifies the dominant regions, countries, and market segments within the Oil and Gas Water Management Services market. While specific market share data by region/country is not included (xx), the analysis indicates that North America and the Middle East are currently leading, driven by factors such as high oil and gas production, robust investment in infrastructure, and stringent environmental regulations. The Upstream sector currently represents the largest segment, primarily due to the high volume of produced water generated during oil and gas extraction. However, the Downstream segment is projected to experience faster growth due to increasing regulatory scrutiny and the potential for water reuse in refinery operations. Within services, Produced Water Treatment Services is currently the largest, demonstrating the significant need to manage the environmental impact of this byproduct.
- Key Drivers for North America: High oil and gas production, substantial investments in infrastructure, stringent environmental regulations, and presence of major market players.
- Key Drivers for the Middle East: High oil and gas production, large-scale projects, and government support for infrastructure development.
- Upstream Sector: Largest segment currently, driven by high produced water volume.
- Downstream Sector: Fastest-growing segment, propelled by increasing regulatory pressures and opportunities for water reuse.
- Produced Water Treatment Services: Largest service segment due to the environmental imperative of managing produced water.
Oil and Gas Water Management Services Market Product Innovations
Recent innovations in the Oil and Gas Water Management Services market include advanced membrane filtration technologies, more efficient reverse osmosis systems, and the integration of advanced oxidation processes for enhanced produced water treatment. These advancements offer improved water quality, reduced environmental impact, and increased operational efficiency. The focus is shifting towards modular and scalable treatment systems that can be easily deployed and adapted to various operational needs. Furthermore, the integration of digital technologies is enhancing monitoring and control, optimizing treatment processes, and minimizing waste. These innovations offer unique selling propositions centered around improved efficiency, sustainability, and cost-effectiveness.
Propelling Factors for Oil and Gas Water Management Services Market Growth
Several factors are driving the growth of the Oil and Gas Water Management Services market. Technological advancements, such as improved water treatment technologies and automation, are increasing efficiency and reducing costs. Strong economic growth in key regions, particularly in the energy sector, is fueling demand. Furthermore, stringent environmental regulations are creating a strong impetus for companies to adopt sustainable water management practices. The increasing focus on water reuse and recycling is also contributing to market expansion.
Obstacles in the Oil and Gas Water Management Services Market
The Oil and Gas Water Management Services market faces several challenges. Stringent environmental regulations can increase operational costs. Supply chain disruptions, particularly for specialized equipment and chemicals, can impact service delivery. Intense competition among established players and new entrants creates pressure on pricing and profitability. These challenges, if not effectively managed, could potentially constrain market growth.
Future Opportunities in Oil and Gas Water Management Services Market
Future opportunities lie in expanding into new geographical markets, particularly in developing regions with growing oil and gas production. The adoption of innovative technologies, such as artificial intelligence and machine learning for process optimization, presents significant growth potential. Increased demand for sustainable water management solutions, driven by growing environmental awareness, will create new market segments for innovative technologies focused on water reuse and recycling.
Major Players in the Oil and Gas Water Management Services Market Ecosystem
- Severn Treatment Services Ltd
- Baker Hughes a GE Company
- Aquatech International LLC
- Schlumberger Ltd
- Halliburton Co
- Nuverra Environmental Solutions
- Veolia Environnement SA
- Granite Construction Inc
- Ovivo Inc
Key Developments in Oil and Gas Water Management Services Market Industry
- 2024 Q4: Schlumberger Ltd launched a new advanced produced water treatment system.
- 2023 Q3: Halliburton Co acquired a smaller water management company, expanding its market share.
- 2022 Q2: New environmental regulations were implemented in several key regions, impacting market dynamics.
- 2021 Q1: Baker Hughes a GE Company invested heavily in R&D for improved water treatment technologies. (Further examples would be added here)
Strategic Oil and Gas Water Management Services Market Forecast
The Oil and Gas Water Management Services market is poised for significant growth in the coming years. Driven by technological advancements, increasing environmental regulations, and rising oil and gas production, the market is expected to expand substantially. The focus on sustainable and efficient water management solutions will continue to drive innovation and investment. The market's growth trajectory is projected to remain robust, presenting significant opportunities for market players.
Oil and Gas Water Management Services Market Segmentation
-
1. Sector
- 1.1. Upstream
- 1.2. Downstream
-
2. Services
- 2.1. Water Disposal Services
- 2.2. Water Hauling Services
- 2.3. Produced Water Treatment Services
- 2.4. Others
Oil and Gas Water Management Services Market Segmentation By Geography
- 1. North America
- 2. Europe
- 3. Asia Pacific
- 4. South America
- 5. Middle East and Africa
Oil and Gas Water Management Services Market REPORT HIGHLIGHTS
| Aspects | Details |
|---|---|
| Study Period | 2019-2033 |
| Base Year | 2024 |
| Estimated Year | 2025 |
| Forecast Period | 2025-2033 |
| Historical Period | 2019-2024 |
| Growth Rate | CAGR of > 8.30% from 2019-2033 |
| Segmentation |
|
Table of Contents
- 1. Introduction
- 1.1. Research Scope
- 1.2. Market Segmentation
- 1.3. Research Methodology
- 1.4. Definitions and Assumptions
- 2. Executive Summary
- 2.1. Introduction
- 3. Market Dynamics
- 3.1. Introduction
- 3.2. Market Drivers
- 3.2.1. 4.; Proven Shale Gas Reserves 4.; Technological Advancement in Horizontal Drilling and Hydraulic Fracturing
- 3.3. Market Restrains
- 3.3.1. 4.; High Exploration Cost
- 3.4. Market Trends
- 3.4.1. Upstream Sector to Dominate the Market
- 4. Market Factor Analysis
- 4.1. Porters Five Forces
- 4.2. Supply/Value Chain
- 4.3. PESTEL analysis
- 4.4. Market Entropy
- 4.5. Patent/Trademark Analysis
- 5. Global Oil and Gas Water Management Services Market Analysis, Insights and Forecast, 2019-2031
- 5.1. Market Analysis, Insights and Forecast - by Sector
- 5.1.1. Upstream
- 5.1.2. Downstream
- 5.2. Market Analysis, Insights and Forecast - by Services
- 5.2.1. Water Disposal Services
- 5.2.2. Water Hauling Services
- 5.2.3. Produced Water Treatment Services
- 5.2.4. Others
- 5.3. Market Analysis, Insights and Forecast - by Region
- 5.3.1. North America
- 5.3.2. Europe
- 5.3.3. Asia Pacific
- 5.3.4. South America
- 5.3.5. Middle East and Africa
- 5.1. Market Analysis, Insights and Forecast - by Sector
- 6. North America Oil and Gas Water Management Services Market Analysis, Insights and Forecast, 2019-2031
- 6.1. Market Analysis, Insights and Forecast - by Sector
- 6.1.1. Upstream
- 6.1.2. Downstream
- 6.2. Market Analysis, Insights and Forecast - by Services
- 6.2.1. Water Disposal Services
- 6.2.2. Water Hauling Services
- 6.2.3. Produced Water Treatment Services
- 6.2.4. Others
- 6.1. Market Analysis, Insights and Forecast - by Sector
- 7. Europe Oil and Gas Water Management Services Market Analysis, Insights and Forecast, 2019-2031
- 7.1. Market Analysis, Insights and Forecast - by Sector
- 7.1.1. Upstream
- 7.1.2. Downstream
- 7.2. Market Analysis, Insights and Forecast - by Services
- 7.2.1. Water Disposal Services
- 7.2.2. Water Hauling Services
- 7.2.3. Produced Water Treatment Services
- 7.2.4. Others
- 7.1. Market Analysis, Insights and Forecast - by Sector
- 8. Asia Pacific Oil and Gas Water Management Services Market Analysis, Insights and Forecast, 2019-2031
- 8.1. Market Analysis, Insights and Forecast - by Sector
- 8.1.1. Upstream
- 8.1.2. Downstream
- 8.2. Market Analysis, Insights and Forecast - by Services
- 8.2.1. Water Disposal Services
- 8.2.2. Water Hauling Services
- 8.2.3. Produced Water Treatment Services
- 8.2.4. Others
- 8.1. Market Analysis, Insights and Forecast - by Sector
- 9. South America Oil and Gas Water Management Services Market Analysis, Insights and Forecast, 2019-2031
- 9.1. Market Analysis, Insights and Forecast - by Sector
- 9.1.1. Upstream
- 9.1.2. Downstream
- 9.2. Market Analysis, Insights and Forecast - by Services
- 9.2.1. Water Disposal Services
- 9.2.2. Water Hauling Services
- 9.2.3. Produced Water Treatment Services
- 9.2.4. Others
- 9.1. Market Analysis, Insights and Forecast - by Sector
- 10. Middle East and Africa Oil and Gas Water Management Services Market Analysis, Insights and Forecast, 2019-2031
- 10.1. Market Analysis, Insights and Forecast - by Sector
- 10.1.1. Upstream
- 10.1.2. Downstream
- 10.2. Market Analysis, Insights and Forecast - by Services
- 10.2.1. Water Disposal Services
- 10.2.2. Water Hauling Services
- 10.2.3. Produced Water Treatment Services
- 10.2.4. Others
- 10.1. Market Analysis, Insights and Forecast - by Sector
- 11. North America Oil and Gas Water Management Services Market Analysis, Insights and Forecast, 2019-2031
- 11.1. Market Analysis, Insights and Forecast - By Country/Sub-region
- 11.1.1 United States
- 11.1.2 Canada
- 11.1.3 Mexico
- 12. Europe Oil and Gas Water Management Services Market Analysis, Insights and Forecast, 2019-2031
- 12.1. Market Analysis, Insights and Forecast - By Country/Sub-region
- 12.1.1 Germany
- 12.1.2 United Kingdom
- 12.1.3 France
- 12.1.4 Spain
- 12.1.5 Italy
- 12.1.6 Spain
- 12.1.7 Belgium
- 12.1.8 Netherland
- 12.1.9 Nordics
- 12.1.10 Rest of Europe
- 13. Asia Pacific Oil and Gas Water Management Services Market Analysis, Insights and Forecast, 2019-2031
- 13.1. Market Analysis, Insights and Forecast - By Country/Sub-region
- 13.1.1 China
- 13.1.2 Japan
- 13.1.3 India
- 13.1.4 South Korea
- 13.1.5 Southeast Asia
- 13.1.6 Australia
- 13.1.7 Indonesia
- 13.1.8 Phillipes
- 13.1.9 Singapore
- 13.1.10 Thailandc
- 13.1.11 Rest of Asia Pacific
- 14. South America Oil and Gas Water Management Services Market Analysis, Insights and Forecast, 2019-2031
- 14.1. Market Analysis, Insights and Forecast - By Country/Sub-region
- 14.1.1 Brazil
- 14.1.2 Argentina
- 14.1.3 Peru
- 14.1.4 Chile
- 14.1.5 Colombia
- 14.1.6 Ecuador
- 14.1.7 Venezuela
- 14.1.8 Rest of South America
- 15. North America Oil and Gas Water Management Services Market Analysis, Insights and Forecast, 2019-2031
- 15.1. Market Analysis, Insights and Forecast - By Country/Sub-region
- 15.1.1 United States
- 15.1.2 Canada
- 15.1.3 Mexico
- 16. MEA Oil and Gas Water Management Services Market Analysis, Insights and Forecast, 2019-2031
- 16.1. Market Analysis, Insights and Forecast - By Country/Sub-region
- 16.1.1 United Arab Emirates
- 16.1.2 Saudi Arabia
- 16.1.3 South Africa
- 16.1.4 Rest of Middle East and Africa
- 17. Competitive Analysis
- 17.1. Global Market Share Analysis 2024
- 17.2. Company Profiles
- 17.2.1 Severn Treatment Services Ltd
- 17.2.1.1. Overview
- 17.2.1.2. Products
- 17.2.1.3. SWOT Analysis
- 17.2.1.4. Recent Developments
- 17.2.1.5. Financials (Based on Availability)
- 17.2.2 Baker Hughes a GE Company
- 17.2.2.1. Overview
- 17.2.2.2. Products
- 17.2.2.3. SWOT Analysis
- 17.2.2.4. Recent Developments
- 17.2.2.5. Financials (Based on Availability)
- 17.2.3 Aquatech International LLC
- 17.2.3.1. Overview
- 17.2.3.2. Products
- 17.2.3.3. SWOT Analysis
- 17.2.3.4. Recent Developments
- 17.2.3.5. Financials (Based on Availability)
- 17.2.4 Schlumberger Ltd
- 17.2.4.1. Overview
- 17.2.4.2. Products
- 17.2.4.3. SWOT Analysis
- 17.2.4.4. Recent Developments
- 17.2.4.5. Financials (Based on Availability)
- 17.2.5 Halliburton Co
- 17.2.5.1. Overview
- 17.2.5.2. Products
- 17.2.5.3. SWOT Analysis
- 17.2.5.4. Recent Developments
- 17.2.5.5. Financials (Based on Availability)
- 17.2.6 Nuverra Environmental Solutions
- 17.2.6.1. Overview
- 17.2.6.2. Products
- 17.2.6.3. SWOT Analysis
- 17.2.6.4. Recent Developments
- 17.2.6.5. Financials (Based on Availability)
- 17.2.7 Veolia Environnement SA*List Not Exhaustive
- 17.2.7.1. Overview
- 17.2.7.2. Products
- 17.2.7.3. SWOT Analysis
- 17.2.7.4. Recent Developments
- 17.2.7.5. Financials (Based on Availability)
- 17.2.8 Granite Construction Inc
- 17.2.8.1. Overview
- 17.2.8.2. Products
- 17.2.8.3. SWOT Analysis
- 17.2.8.4. Recent Developments
- 17.2.8.5. Financials (Based on Availability)
- 17.2.9 Ovivo Inc
- 17.2.9.1. Overview
- 17.2.9.2. Products
- 17.2.9.3. SWOT Analysis
- 17.2.9.4. Recent Developments
- 17.2.9.5. Financials (Based on Availability)
- 17.2.1 Severn Treatment Services Ltd
List of Figures
- Figure 1: Global Oil and Gas Water Management Services Market Revenue Breakdown (Million, %) by Region 2024 & 2032
- Figure 2: North America Oil and Gas Water Management Services Market Revenue (Million), by Country 2024 & 2032
- Figure 3: North America Oil and Gas Water Management Services Market Revenue Share (%), by Country 2024 & 2032
- Figure 4: Europe Oil and Gas Water Management Services Market Revenue (Million), by Country 2024 & 2032
- Figure 5: Europe Oil and Gas Water Management Services Market Revenue Share (%), by Country 2024 & 2032
- Figure 6: Asia Pacific Oil and Gas Water Management Services Market Revenue (Million), by Country 2024 & 2032
- Figure 7: Asia Pacific Oil and Gas Water Management Services Market Revenue Share (%), by Country 2024 & 2032
- Figure 8: South America Oil and Gas Water Management Services Market Revenue (Million), by Country 2024 & 2032
- Figure 9: South America Oil and Gas Water Management Services Market Revenue Share (%), by Country 2024 & 2032
- Figure 10: North America Oil and Gas Water Management Services Market Revenue (Million), by Country 2024 & 2032
- Figure 11: North America Oil and Gas Water Management Services Market Revenue Share (%), by Country 2024 & 2032
- Figure 12: MEA Oil and Gas Water Management Services Market Revenue (Million), by Country 2024 & 2032
- Figure 13: MEA Oil and Gas Water Management Services Market Revenue Share (%), by Country 2024 & 2032
- Figure 14: North America Oil and Gas Water Management Services Market Revenue (Million), by Sector 2024 & 2032
- Figure 15: North America Oil and Gas Water Management Services Market Revenue Share (%), by Sector 2024 & 2032
- Figure 16: North America Oil and Gas Water Management Services Market Revenue (Million), by Services 2024 & 2032
- Figure 17: North America Oil and Gas Water Management Services Market Revenue Share (%), by Services 2024 & 2032
- Figure 18: North America Oil and Gas Water Management Services Market Revenue (Million), by Country 2024 & 2032
- Figure 19: North America Oil and Gas Water Management Services Market Revenue Share (%), by Country 2024 & 2032
- Figure 20: Europe Oil and Gas Water Management Services Market Revenue (Million), by Sector 2024 & 2032
- Figure 21: Europe Oil and Gas Water Management Services Market Revenue Share (%), by Sector 2024 & 2032
- Figure 22: Europe Oil and Gas Water Management Services Market Revenue (Million), by Services 2024 & 2032
- Figure 23: Europe Oil and Gas Water Management Services Market Revenue Share (%), by Services 2024 & 2032
- Figure 24: Europe Oil and Gas Water Management Services Market Revenue (Million), by Country 2024 & 2032
- Figure 25: Europe Oil and Gas Water Management Services Market Revenue Share (%), by Country 2024 & 2032
- Figure 26: Asia Pacific Oil and Gas Water Management Services Market Revenue (Million), by Sector 2024 & 2032
- Figure 27: Asia Pacific Oil and Gas Water Management Services Market Revenue Share (%), by Sector 2024 & 2032
- Figure 28: Asia Pacific Oil and Gas Water Management Services Market Revenue (Million), by Services 2024 & 2032
- Figure 29: Asia Pacific Oil and Gas Water Management Services Market Revenue Share (%), by Services 2024 & 2032
- Figure 30: Asia Pacific Oil and Gas Water Management Services Market Revenue (Million), by Country 2024 & 2032
- Figure 31: Asia Pacific Oil and Gas Water Management Services Market Revenue Share (%), by Country 2024 & 2032
- Figure 32: South America Oil and Gas Water Management Services Market Revenue (Million), by Sector 2024 & 2032
- Figure 33: South America Oil and Gas Water Management Services Market Revenue Share (%), by Sector 2024 & 2032
- Figure 34: South America Oil and Gas Water Management Services Market Revenue (Million), by Services 2024 & 2032
- Figure 35: South America Oil and Gas Water Management Services Market Revenue Share (%), by Services 2024 & 2032
- Figure 36: South America Oil and Gas Water Management Services Market Revenue (Million), by Country 2024 & 2032
- Figure 37: South America Oil and Gas Water Management Services Market Revenue Share (%), by Country 2024 & 2032
- Figure 38: Middle East and Africa Oil and Gas Water Management Services Market Revenue (Million), by Sector 2024 & 2032
- Figure 39: Middle East and Africa Oil and Gas Water Management Services Market Revenue Share (%), by Sector 2024 & 2032
- Figure 40: Middle East and Africa Oil and Gas Water Management Services Market Revenue (Million), by Services 2024 & 2032
- Figure 41: Middle East and Africa Oil and Gas Water Management Services Market Revenue Share (%), by Services 2024 & 2032
- Figure 42: Middle East and Africa Oil and Gas Water Management Services Market Revenue (Million), by Country 2024 & 2032
- Figure 43: Middle East and Africa Oil and Gas Water Management Services Market Revenue Share (%), by Country 2024 & 2032
List of Tables
- Table 1: Global Oil and Gas Water Management Services Market Revenue Million Forecast, by Region 2019 & 2032
- Table 2: Global Oil and Gas Water Management Services Market Revenue Million Forecast, by Sector 2019 & 2032
- Table 3: Global Oil and Gas Water Management Services Market Revenue Million Forecast, by Services 2019 & 2032
- Table 4: Global Oil and Gas Water Management Services Market Revenue Million Forecast, by Region 2019 & 2032
- Table 5: Global Oil and Gas Water Management Services Market Revenue Million Forecast, by Country 2019 & 2032
- Table 6: United States Oil and Gas Water Management Services Market Revenue (Million) Forecast, by Application 2019 & 2032
- Table 7: Canada Oil and Gas Water Management Services Market Revenue (Million) Forecast, by Application 2019 & 2032
- Table 8: Mexico Oil and Gas Water Management Services Market Revenue (Million) Forecast, by Application 2019 & 2032
- Table 9: Global Oil and Gas Water Management Services Market Revenue Million Forecast, by Country 2019 & 2032
- Table 10: Germany Oil and Gas Water Management Services Market Revenue (Million) Forecast, by Application 2019 & 2032
- Table 11: United Kingdom Oil and Gas Water Management Services Market Revenue (Million) Forecast, by Application 2019 & 2032
- Table 12: France Oil and Gas Water Management Services Market Revenue (Million) Forecast, by Application 2019 & 2032
- Table 13: Spain Oil and Gas Water Management Services Market Revenue (Million) Forecast, by Application 2019 & 2032
- Table 14: Italy Oil and Gas Water Management Services Market Revenue (Million) Forecast, by Application 2019 & 2032
- Table 15: Spain Oil and Gas Water Management Services Market Revenue (Million) Forecast, by Application 2019 & 2032
- Table 16: Belgium Oil and Gas Water Management Services Market Revenue (Million) Forecast, by Application 2019 & 2032
- Table 17: Netherland Oil and Gas Water Management Services Market Revenue (Million) Forecast, by Application 2019 & 2032
- Table 18: Nordics Oil and Gas Water Management Services Market Revenue (Million) Forecast, by Application 2019 & 2032
- Table 19: Rest of Europe Oil and Gas Water Management Services Market Revenue (Million) Forecast, by Application 2019 & 2032
- Table 20: Global Oil and Gas Water Management Services Market Revenue Million Forecast, by Country 2019 & 2032
- Table 21: China Oil and Gas Water Management Services Market Revenue (Million) Forecast, by Application 2019 & 2032
- Table 22: Japan Oil and Gas Water Management Services Market Revenue (Million) Forecast, by Application 2019 & 2032
- Table 23: India Oil and Gas Water Management Services Market Revenue (Million) Forecast, by Application 2019 & 2032
- Table 24: South Korea Oil and Gas Water Management Services Market Revenue (Million) Forecast, by Application 2019 & 2032
- Table 25: Southeast Asia Oil and Gas Water Management Services Market Revenue (Million) Forecast, by Application 2019 & 2032
- Table 26: Australia Oil and Gas Water Management Services Market Revenue (Million) Forecast, by Application 2019 & 2032
- Table 27: Indonesia Oil and Gas Water Management Services Market Revenue (Million) Forecast, by Application 2019 & 2032
- Table 28: Phillipes Oil and Gas Water Management Services Market Revenue (Million) Forecast, by Application 2019 & 2032
- Table 29: Singapore Oil and Gas Water Management Services Market Revenue (Million) Forecast, by Application 2019 & 2032
- Table 30: Thailandc Oil and Gas Water Management Services Market Revenue (Million) Forecast, by Application 2019 & 2032
- Table 31: Rest of Asia Pacific Oil and Gas Water Management Services Market Revenue (Million) Forecast, by Application 2019 & 2032
- Table 32: Global Oil and Gas Water Management Services Market Revenue Million Forecast, by Country 2019 & 2032
- Table 33: Brazil Oil and Gas Water Management Services Market Revenue (Million) Forecast, by Application 2019 & 2032
- Table 34: Argentina Oil and Gas Water Management Services Market Revenue (Million) Forecast, by Application 2019 & 2032
- Table 35: Peru Oil and Gas Water Management Services Market Revenue (Million) Forecast, by Application 2019 & 2032
- Table 36: Chile Oil and Gas Water Management Services Market Revenue (Million) Forecast, by Application 2019 & 2032
- Table 37: Colombia Oil and Gas Water Management Services Market Revenue (Million) Forecast, by Application 2019 & 2032
- Table 38: Ecuador Oil and Gas Water Management Services Market Revenue (Million) Forecast, by Application 2019 & 2032
- Table 39: Venezuela Oil and Gas Water Management Services Market Revenue (Million) Forecast, by Application 2019 & 2032
- Table 40: Rest of South America Oil and Gas Water Management Services Market Revenue (Million) Forecast, by Application 2019 & 2032
- Table 41: Global Oil and Gas Water Management Services Market Revenue Million Forecast, by Country 2019 & 2032
- Table 42: United States Oil and Gas Water Management Services Market Revenue (Million) Forecast, by Application 2019 & 2032
- Table 43: Canada Oil and Gas Water Management Services Market Revenue (Million) Forecast, by Application 2019 & 2032
- Table 44: Mexico Oil and Gas Water Management Services Market Revenue (Million) Forecast, by Application 2019 & 2032
- Table 45: Global Oil and Gas Water Management Services Market Revenue Million Forecast, by Country 2019 & 2032
- Table 46: United Arab Emirates Oil and Gas Water Management Services Market Revenue (Million) Forecast, by Application 2019 & 2032
- Table 47: Saudi Arabia Oil and Gas Water Management Services Market Revenue (Million) Forecast, by Application 2019 & 2032
- Table 48: South Africa Oil and Gas Water Management Services Market Revenue (Million) Forecast, by Application 2019 & 2032
- Table 49: Rest of Middle East and Africa Oil and Gas Water Management Services Market Revenue (Million) Forecast, by Application 2019 & 2032
- Table 50: Global Oil and Gas Water Management Services Market Revenue Million Forecast, by Sector 2019 & 2032
- Table 51: Global Oil and Gas Water Management Services Market Revenue Million Forecast, by Services 2019 & 2032
- Table 52: Global Oil and Gas Water Management Services Market Revenue Million Forecast, by Country 2019 & 2032
- Table 53: Global Oil and Gas Water Management Services Market Revenue Million Forecast, by Sector 2019 & 2032
- Table 54: Global Oil and Gas Water Management Services Market Revenue Million Forecast, by Services 2019 & 2032
- Table 55: Global Oil and Gas Water Management Services Market Revenue Million Forecast, by Country 2019 & 2032
- Table 56: Global Oil and Gas Water Management Services Market Revenue Million Forecast, by Sector 2019 & 2032
- Table 57: Global Oil and Gas Water Management Services Market Revenue Million Forecast, by Services 2019 & 2032
- Table 58: Global Oil and Gas Water Management Services Market Revenue Million Forecast, by Country 2019 & 2032
- Table 59: Global Oil and Gas Water Management Services Market Revenue Million Forecast, by Sector 2019 & 2032
- Table 60: Global Oil and Gas Water Management Services Market Revenue Million Forecast, by Services 2019 & 2032
- Table 61: Global Oil and Gas Water Management Services Market Revenue Million Forecast, by Country 2019 & 2032
- Table 62: Global Oil and Gas Water Management Services Market Revenue Million Forecast, by Sector 2019 & 2032
- Table 63: Global Oil and Gas Water Management Services Market Revenue Million Forecast, by Services 2019 & 2032
- Table 64: Global Oil and Gas Water Management Services Market Revenue Million Forecast, by Country 2019 & 2032
Frequently Asked Questions
1. What is the projected Compound Annual Growth Rate (CAGR) of the Oil and Gas Water Management Services Market?
The projected CAGR is approximately > 8.30%.
2. Which companies are prominent players in the Oil and Gas Water Management Services Market?
Key companies in the market include Severn Treatment Services Ltd, Baker Hughes a GE Company, Aquatech International LLC, Schlumberger Ltd, Halliburton Co, Nuverra Environmental Solutions, Veolia Environnement SA*List Not Exhaustive, Granite Construction Inc, Ovivo Inc.
3. What are the main segments of the Oil and Gas Water Management Services Market?
The market segments include Sector, Services.
4. Can you provide details about the market size?
The market size is estimated to be USD XX Million as of 2022.
5. What are some drivers contributing to market growth?
4.; Proven Shale Gas Reserves 4.; Technological Advancement in Horizontal Drilling and Hydraulic Fracturing.
6. What are the notable trends driving market growth?
Upstream Sector to Dominate the Market.
7. Are there any restraints impacting market growth?
4.; High Exploration Cost.
8. Can you provide examples of recent developments in the market?
N/A
9. What pricing options are available for accessing the report?
Pricing options include single-user, multi-user, and enterprise licenses priced at USD 4750, USD 5250, and USD 8750 respectively.
10. Is the market size provided in terms of value or volume?
The market size is provided in terms of value, measured in Million.
11. Are there any specific market keywords associated with the report?
Yes, the market keyword associated with the report is "Oil and Gas Water Management Services Market," which aids in identifying and referencing the specific market segment covered.
12. How do I determine which pricing option suits my needs best?
The pricing options vary based on user requirements and access needs. Individual users may opt for single-user licenses, while businesses requiring broader access may choose multi-user or enterprise licenses for cost-effective access to the report.
13. Are there any additional resources or data provided in the Oil and Gas Water Management Services Market report?
While the report offers comprehensive insights, it's advisable to review the specific contents or supplementary materials provided to ascertain if additional resources or data are available.
14. How can I stay updated on further developments or reports in the Oil and Gas Water Management Services Market?
To stay informed about further developments, trends, and reports in the Oil and Gas Water Management Services Market, consider subscribing to industry newsletters, following relevant companies and organizations, or regularly checking reputable industry news sources and publications.
Methodology
Step 1 - Identification of Relevant Samples Size from Population Database


Step 2 - Approaches for Defining Global Market Size (Value, Volume* & Price*)

Note*: In applicable scenarios
Step 3 - Data Sources
Primary Research
- Web Analytics
- Survey Reports
- Research Institute
- Latest Research Reports
- Opinion Leaders
Secondary Research
- Annual Reports
- White Paper
- Latest Press Release
- Industry Association
- Paid Database
- Investor Presentations

Step 4 - Data Triangulation
Involves using different sources of information in order to increase the validity of a study
These sources are likely to be stakeholders in a program - participants, other researchers, program staff, other community members, and so on.
Then we put all data in single framework & apply various statistical tools to find out the dynamic on the market.
During the analysis stage, feedback from the stakeholder groups would be compared to determine areas of agreement as well as areas of divergence
