

Key Insights
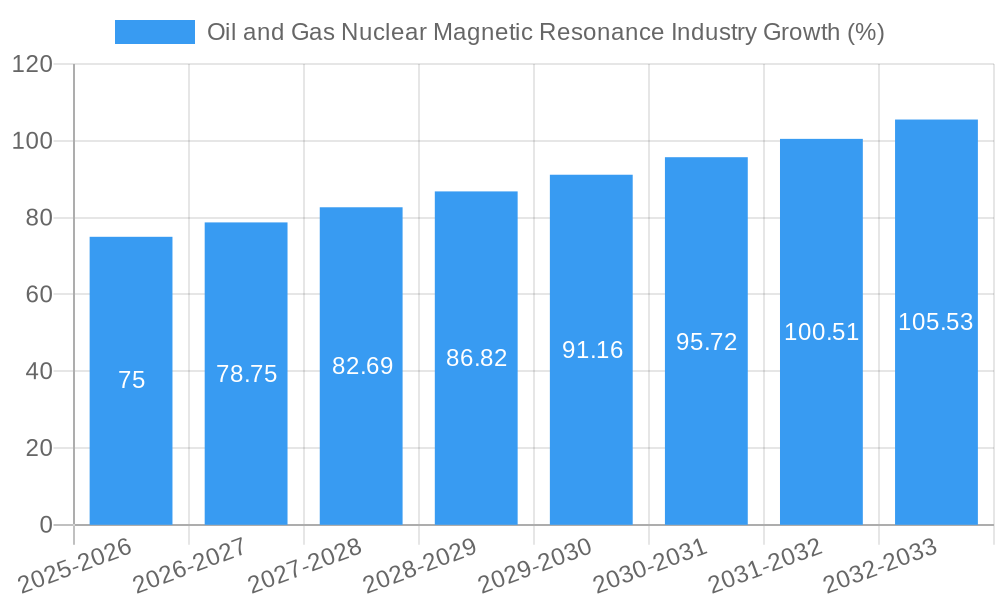
The Oil and Gas Nuclear Magnetic Resonance (NMR) industry is experiencing robust growth, driven by increasing demand for enhanced oil recovery (EOR) techniques and reservoir characterization. The market's Compound Annual Growth Rate (CAGR) exceeding 5% indicates a significant expansion projected through 2033. Key drivers include the need for improved reservoir understanding to optimize drilling and production strategies, the rising adoption of digital oilfield technologies incorporating NMR data, and stricter environmental regulations pushing for more efficient resource extraction. Technological advancements in NMR instruments, leading to improved resolution, portability, and data processing capabilities, further fuel market growth. The onshore segment is currently dominating, due to easier accessibility and established infrastructure, but offshore deployment is projected to witness significant growth driven by exploration in deeper water and the need for advanced reservoir management in challenging environments. North America and Europe currently hold substantial market shares, owing to mature oil and gas operations and strong technological infrastructure. However, the Asia-Pacific region, particularly China and India, is poised for substantial growth due to increasing investment in oil and gas exploration and production activities. Competitive pressures from established players and the emergence of innovative smaller companies are shaping the industry landscape, while potential restraints include the high initial investment costs associated with NMR technology and the fluctuating prices of oil and gas impacting investment decisions.
The segmentation of the market by geography (North America, Europe, Asia-Pacific, Middle East & Africa, South America) and location of deployment (onshore, offshore) provides valuable insights into regional growth patterns. North America maintains a significant lead due to the presence of major oil and gas companies and advanced technological capabilities. However, the Asia-Pacific region’s burgeoning oil and gas sector indicates substantial future growth potential. The onshore segment's dominance is expected to continue, driven by cost-effectiveness and accessibility, while offshore applications will see increased adoption as exploration expands into deeper and more challenging environments. The competitive landscape is characterized by a mix of established multinational corporations like Schlumberger and Baker Hughes, and specialized NMR equipment providers like Mount Sopris Instruments. This competitive dynamic fosters innovation and drives down costs, ultimately benefiting end-users.
Oil and Gas Nuclear Magnetic Resonance (NMR) Industry Market Report: 2019-2033
This comprehensive report provides an in-depth analysis of the Oil and Gas Nuclear Magnetic Resonance (NMR) industry, offering invaluable insights for stakeholders seeking to navigate this dynamic market. The study covers the period 2019-2033, with a focus on the 2025-2033 forecast period, and features detailed analysis of market trends, leading players, and future growth potential. The market is projected to reach xx Million by 2033, presenting significant opportunities for investment and expansion.

Oil and Gas Nuclear Magnetic Resonance Industry Market Composition & Trends
The Oil and Gas Nuclear Magnetic Resonance (NMR) market is characterized by moderate concentration, with key players like Mount Sopris Instruments Inc, Vista Clara Inc, Weatherford International plc, Baker Hughes Company, Halliburton Company, Qteq Pty Ltd, and Schlumberger Limited dominating the landscape. Market share distribution is currently estimated at xx%, with Mount Sopris Instruments Inc holding the largest share at approximately xx%. Innovation is driven by the need for enhanced reservoir characterization, improved drilling efficiency, and reduced operational costs. Regulatory landscapes vary across regions, impacting market access and operational practices. Substitute technologies, such as conventional logging methods, pose a competitive challenge. The end-user profile primarily consists of major oil and gas exploration and production companies. Mergers and acquisitions (M&A) activity has been relatively modest in recent years, with total deal values estimated at xx Million over the historical period (2019-2024). Future M&A activity is expected to increase driven by the need for technology expansion and market consolidation.
- Market Concentration: Moderately concentrated, with a few major players holding significant market share.
- Innovation Catalysts: Demand for enhanced reservoir characterization and improved operational efficiency.
- Regulatory Landscape: Varies across geographical regions, impacting market entry and operations.
- Substitute Products: Conventional logging methods present a competitive challenge.
- End-User Profile: Primarily major oil and gas exploration and production companies.
- M&A Activity: Total deal values estimated at xx Million (2019-2024), with increasing activity expected.
Oil and Gas Nuclear Magnetic Resonance Industry Industry Evolution
The Oil and Gas NMR industry has experienced steady growth over the historical period (2019-2024), driven by increasing demand for advanced reservoir characterization techniques. The market exhibited a Compound Annual Growth Rate (CAGR) of xx% during this period. Technological advancements, such as the development of more portable and robust NMR tools, have significantly improved data acquisition and interpretation. The shift towards digitalization and data analytics has also played a key role in enhancing the efficiency and accuracy of NMR applications. Consumer demand is primarily focused on improving drilling efficiency, reducing operational costs, and increasing production yield. The adoption rate of advanced NMR technologies is increasing, with xx% of oil and gas operators currently utilizing these tools in their operations. The market is expected to maintain robust growth momentum during the forecast period (2025-2033), with a projected CAGR of xx%, driven by factors such as increasing exploration and production activity in emerging markets and continued technological innovations.
Leading Regions, Countries, or Segments in Oil and Gas Nuclear Magnetic Resonance Industry
North America currently holds the largest market share in the Oil and Gas NMR industry, driven by significant investments in oil and gas exploration and production. The onshore segment dominates in terms of location of deployment.
- Key Drivers for North America's Dominance:
- High levels of oil and gas exploration and production activity.
- Significant investments in advanced technologies.
- Strong regulatory support for technological advancements in the oil and gas sector.
- Key Drivers for Onshore Dominance:
- Easier accessibility and lower operational costs compared to offshore deployments.
- Higher concentration of oil and gas reserves in onshore locations.
- Other Regions: Europe, Asia-Pacific, Middle East & Africa, and South America present significant growth opportunities, with increasing investments and regulatory support driving adoption rates.
Oil and Gas Nuclear Magnetic Resonance Industry Product Innovations
Recent innovations in Oil and Gas Nuclear Magnetic Resonance (NMR) technology have significantly advanced the capabilities of reservoir characterization and production optimization tools. These advancements focus on enhancing portability, robustness, and data processing efficiency. New NMR tools boast improved measurement accuracy, dramatically faster data acquisition times, and more sophisticated data interpretation algorithms. This translates to substantial gains in operational efficiency and cost savings for oil and gas companies. Key benefits include increased accuracy, faster turnaround times, and more reliable reservoir assessments, ultimately leading to improved decision-making throughout the exploration and production lifecycle. The enhanced data interpretation capabilities enable geologists and engineers to better understand reservoir properties such as porosity, permeability, and fluid saturation, leading to more effective well placement, completion strategies, and production optimization.
Propelling Factors for Oil and Gas Nuclear Magnetic Resonance Industry Growth
The Oil and Gas NMR industry is experiencing robust growth fueled by several converging factors. The development of more efficient and cost-effective NMR tools, driven by continuous technological advancements, is a primary driver. Increased exploration and production activities, particularly in regions like the Middle East, North America, and South America, are creating a significant demand for advanced reservoir characterization technologies. This heightened demand is further amplified by the increasing focus on enhanced oil recovery (EOR) techniques, where NMR plays a crucial role in optimizing fluid management. Furthermore, regulatory initiatives promoting sustainable and efficient oil and gas production, coupled with a growing emphasis on data-driven decision-making, are creating a supportive regulatory environment, bolstering industry growth.
Obstacles in the Oil and Gas Nuclear Magnetic Resonance Industry Market
Despite significant growth potential, the Oil and Gas NMR market faces certain challenges. The high initial investment required for NMR tools can present a barrier to entry for smaller operators. Market volatility, influenced by fluctuations in commodity prices and global economic conditions, can impact investment decisions. Supply chain disruptions and the availability of skilled personnel to operate and interpret NMR data are additional factors influencing market growth. Competition from alternative logging technologies and the need for continuous technological innovation to maintain a competitive edge also represent significant hurdles.
Future Opportunities in Oil and Gas Nuclear Magnetic Resonance Industry
Future opportunities for the Oil and Gas NMR industry lie in the expansion into emerging markets, especially in regions with substantial untapped oil and gas reserves. Technological advancements, such as the integration of artificial intelligence and machine learning in data interpretation, also present considerable potential.
Major Players in the Oil and Gas Nuclear Magnetic Resonance Industry Ecosystem
- Mount Sopris Instruments Inc
- Vista Clara Inc
- Weatherford International plc
- Baker Hughes Company
- Halliburton Company
- Qteq Pty Ltd
- Schlumberger Limited
Key Developments in Oil and Gas Nuclear Magnetic Resonance Industry Industry
- April 2022: Saipem's contract win from Eni for a drilling campaign in the Middle East and West Africa underscores the persistent demand for advanced technologies in challenging deep-water exploration environments. This highlights the value of NMR technology in optimizing well placement and production in complex reservoirs.
- February 2023: Saudi Aramco's ambitious plan to award contracts for 90 projects by 2025 reflects substantial investment in upstream capacity expansion. This significant investment will inevitably drive further demand for advanced reservoir characterization technologies, including NMR, to maximize efficiency and optimize production from these new assets.
- Ongoing Trends: The increasing adoption of digitalization and automation within the oil and gas sector is leading to the integration of NMR data with other subsurface data sources. This integrated approach allows for more comprehensive reservoir models and improved decision-making.
Strategic Oil and Gas Nuclear Magnetic Resonance Industry Market Forecast
The Oil and Gas NMR market is poised for robust growth over the forecast period, driven by technological innovation, increasing exploration and production activities, and supportive regulatory environments. The expanding application of NMR in unconventional reservoirs and the integration of advanced analytics will further fuel market expansion, creating significant opportunities for industry players.
Oil and Gas Nuclear Magnetic Resonance Industry Segmentation
-
1. Location of Deployment
- 1.1. Offshore
- 1.2. Onshore
-
2. Geogrpahy
- 2.1. North America
- 2.2. Europe
- 2.3. Asia-Pacific
- 2.4. Middle-East and Africa
- 2.5. South America
Oil and Gas Nuclear Magnetic Resonance Industry Segmentation By Geography
-
1. North America
- 1.1. United States
- 1.2. Canada
- 1.3. Mexico
-
2. South America
- 2.1. Brazil
- 2.2. Argentina
- 2.3. Rest of South America
-
3. Europe
- 3.1. United Kingdom
- 3.2. Germany
- 3.3. France
- 3.4. Italy
- 3.5. Spain
- 3.6. Russia
- 3.7. Benelux
- 3.8. Nordics
- 3.9. Rest of Europe
-
4. Middle East & Africa
- 4.1. Turkey
- 4.2. Israel
- 4.3. GCC
- 4.4. North Africa
- 4.5. South Africa
- 4.6. Rest of Middle East & Africa
-
5. Asia Pacific
- 5.1. China
- 5.2. India
- 5.3. Japan
- 5.4. South Korea
- 5.5. ASEAN
- 5.6. Oceania
- 5.7. Rest of Asia Pacific

Oil and Gas Nuclear Magnetic Resonance Industry REPORT HIGHLIGHTS
| Aspects | Details |
|---|---|
| Study Period | 2019-2033 |
| Base Year | 2024 |
| Estimated Year | 2025 |
| Forecast Period | 2025-2033 |
| Historical Period | 2019-2024 |
| Growth Rate | CAGR of > 5.00% from 2019-2033 |
| Segmentation |
|
Table of Contents
- 1. Introduction
- 1.1. Research Scope
- 1.2. Market Segmentation
- 1.3. Research Methodology
- 1.4. Definitions and Assumptions
- 2. Executive Summary
- 2.1. Introduction
- 3. Market Dynamics
- 3.1. Introduction
- 3.2. Market Drivers
- 3.2.1. 4.; Increasing Production from Unconventional Sources4.; Growing Energy Demand in the Region
- 3.3. Market Restrains
- 3.3.1. 4.; Environmental Concerns
- 3.4. Market Trends
- 3.4.1. Onshore Sector to Dominate the Demand
- 4. Market Factor Analysis
- 4.1. Porters Five Forces
- 4.2. Supply/Value Chain
- 4.3. PESTEL analysis
- 4.4. Market Entropy
- 4.5. Patent/Trademark Analysis
- 5. Global Oil and Gas Nuclear Magnetic Resonance Industry Analysis, Insights and Forecast, 2019-2031
- 5.1. Market Analysis, Insights and Forecast - by Location of Deployment
- 5.1.1. Offshore
- 5.1.2. Onshore
- 5.2. Market Analysis, Insights and Forecast - by Geogrpahy
- 5.2.1. North America
- 5.2.2. Europe
- 5.2.3. Asia-Pacific
- 5.2.4. Middle-East and Africa
- 5.2.5. South America
- 5.3. Market Analysis, Insights and Forecast - by Region
- 5.3.1. North America
- 5.3.2. South America
- 5.3.3. Europe
- 5.3.4. Middle East & Africa
- 5.3.5. Asia Pacific
- 5.1. Market Analysis, Insights and Forecast - by Location of Deployment
- 6. North America Oil and Gas Nuclear Magnetic Resonance Industry Analysis, Insights and Forecast, 2019-2031
- 6.1. Market Analysis, Insights and Forecast - by Location of Deployment
- 6.1.1. Offshore
- 6.1.2. Onshore
- 6.2. Market Analysis, Insights and Forecast - by Geogrpahy
- 6.2.1. North America
- 6.2.2. Europe
- 6.2.3. Asia-Pacific
- 6.2.4. Middle-East and Africa
- 6.2.5. South America
- 6.1. Market Analysis, Insights and Forecast - by Location of Deployment
- 7. South America Oil and Gas Nuclear Magnetic Resonance Industry Analysis, Insights and Forecast, 2019-2031
- 7.1. Market Analysis, Insights and Forecast - by Location of Deployment
- 7.1.1. Offshore
- 7.1.2. Onshore
- 7.2. Market Analysis, Insights and Forecast - by Geogrpahy
- 7.2.1. North America
- 7.2.2. Europe
- 7.2.3. Asia-Pacific
- 7.2.4. Middle-East and Africa
- 7.2.5. South America
- 7.1. Market Analysis, Insights and Forecast - by Location of Deployment
- 8. Europe Oil and Gas Nuclear Magnetic Resonance Industry Analysis, Insights and Forecast, 2019-2031
- 8.1. Market Analysis, Insights and Forecast - by Location of Deployment
- 8.1.1. Offshore
- 8.1.2. Onshore
- 8.2. Market Analysis, Insights and Forecast - by Geogrpahy
- 8.2.1. North America
- 8.2.2. Europe
- 8.2.3. Asia-Pacific
- 8.2.4. Middle-East and Africa
- 8.2.5. South America
- 8.1. Market Analysis, Insights and Forecast - by Location of Deployment
- 9. Middle East & Africa Oil and Gas Nuclear Magnetic Resonance Industry Analysis, Insights and Forecast, 2019-2031
- 9.1. Market Analysis, Insights and Forecast - by Location of Deployment
- 9.1.1. Offshore
- 9.1.2. Onshore
- 9.2. Market Analysis, Insights and Forecast - by Geogrpahy
- 9.2.1. North America
- 9.2.2. Europe
- 9.2.3. Asia-Pacific
- 9.2.4. Middle-East and Africa
- 9.2.5. South America
- 9.1. Market Analysis, Insights and Forecast - by Location of Deployment
- 10. Asia Pacific Oil and Gas Nuclear Magnetic Resonance Industry Analysis, Insights and Forecast, 2019-2031
- 10.1. Market Analysis, Insights and Forecast - by Location of Deployment
- 10.1.1. Offshore
- 10.1.2. Onshore
- 10.2. Market Analysis, Insights and Forecast - by Geogrpahy
- 10.2.1. North America
- 10.2.2. Europe
- 10.2.3. Asia-Pacific
- 10.2.4. Middle-East and Africa
- 10.2.5. South America
- 10.1. Market Analysis, Insights and Forecast - by Location of Deployment
- 11. North America Oil and Gas Nuclear Magnetic Resonance Industry Analysis, Insights and Forecast, 2019-2031
- 11.1. Market Analysis, Insights and Forecast - By Country/Sub-region
- 11.1.1 United States
- 11.1.2 Canada
- 11.1.3 Mexico
- 12. Europe Oil and Gas Nuclear Magnetic Resonance Industry Analysis, Insights and Forecast, 2019-2031
- 12.1. Market Analysis, Insights and Forecast - By Country/Sub-region
- 12.1.1 Germany
- 12.1.2 United Kingdom
- 12.1.3 France
- 12.1.4 Spain
- 12.1.5 Italy
- 12.1.6 Spain
- 12.1.7 Belgium
- 12.1.8 Netherland
- 12.1.9 Nordics
- 12.1.10 Rest of Europe
- 13. Asia Pacific Oil and Gas Nuclear Magnetic Resonance Industry Analysis, Insights and Forecast, 2019-2031
- 13.1. Market Analysis, Insights and Forecast - By Country/Sub-region
- 13.1.1 China
- 13.1.2 Japan
- 13.1.3 India
- 13.1.4 South Korea
- 13.1.5 Southeast Asia
- 13.1.6 Australia
- 13.1.7 Indonesia
- 13.1.8 Phillipes
- 13.1.9 Singapore
- 13.1.10 Thailandc
- 13.1.11 Rest of Asia Pacific
- 14. South America Oil and Gas Nuclear Magnetic Resonance Industry Analysis, Insights and Forecast, 2019-2031
- 14.1. Market Analysis, Insights and Forecast - By Country/Sub-region
- 14.1.1 Brazil
- 14.1.2 Argentina
- 14.1.3 Peru
- 14.1.4 Chile
- 14.1.5 Colombia
- 14.1.6 Ecuador
- 14.1.7 Venezuela
- 14.1.8 Rest of South America
- 15. MEA Oil and Gas Nuclear Magnetic Resonance Industry Analysis, Insights and Forecast, 2019-2031
- 15.1. Market Analysis, Insights and Forecast - By Country/Sub-region
- 15.1.1 United Arab Emirates
- 15.1.2 Saudi Arabia
- 15.1.3 South Africa
- 15.1.4 Rest of Middle East and Africa
- 16. Competitive Analysis
- 16.1. Global Market Share Analysis 2024
- 16.2. Company Profiles
- 16.2.1 Mount Sopris Instruments Inc
- 16.2.1.1. Overview
- 16.2.1.2. Products
- 16.2.1.3. SWOT Analysis
- 16.2.1.4. Recent Developments
- 16.2.1.5. Financials (Based on Availability)
- 16.2.2 Vista Clara Inc
- 16.2.2.1. Overview
- 16.2.2.2. Products
- 16.2.2.3. SWOT Analysis
- 16.2.2.4. Recent Developments
- 16.2.2.5. Financials (Based on Availability)
- 16.2.3 Weatherford International plc
- 16.2.3.1. Overview
- 16.2.3.2. Products
- 16.2.3.3. SWOT Analysis
- 16.2.3.4. Recent Developments
- 16.2.3.5. Financials (Based on Availability)
- 16.2.4 Baker Hughes Company
- 16.2.4.1. Overview
- 16.2.4.2. Products
- 16.2.4.3. SWOT Analysis
- 16.2.4.4. Recent Developments
- 16.2.4.5. Financials (Based on Availability)
- 16.2.5 Halliburton Company
- 16.2.5.1. Overview
- 16.2.5.2. Products
- 16.2.5.3. SWOT Analysis
- 16.2.5.4. Recent Developments
- 16.2.5.5. Financials (Based on Availability)
- 16.2.6 Qteq Pty Ltd
- 16.2.6.1. Overview
- 16.2.6.2. Products
- 16.2.6.3. SWOT Analysis
- 16.2.6.4. Recent Developments
- 16.2.6.5. Financials (Based on Availability)
- 16.2.7 Schlumberger Limited
- 16.2.7.1. Overview
- 16.2.7.2. Products
- 16.2.7.3. SWOT Analysis
- 16.2.7.4. Recent Developments
- 16.2.7.5. Financials (Based on Availability)
- 16.2.1 Mount Sopris Instruments Inc
List of Figures
- Figure 1: Global Oil and Gas Nuclear Magnetic Resonance Industry Revenue Breakdown (Million, %) by Region 2024 & 2032
- Figure 2: North America Oil and Gas Nuclear Magnetic Resonance Industry Revenue (Million), by Country 2024 & 2032
- Figure 3: North America Oil and Gas Nuclear Magnetic Resonance Industry Revenue Share (%), by Country 2024 & 2032
- Figure 4: Europe Oil and Gas Nuclear Magnetic Resonance Industry Revenue (Million), by Country 2024 & 2032
- Figure 5: Europe Oil and Gas Nuclear Magnetic Resonance Industry Revenue Share (%), by Country 2024 & 2032
- Figure 6: Asia Pacific Oil and Gas Nuclear Magnetic Resonance Industry Revenue (Million), by Country 2024 & 2032
- Figure 7: Asia Pacific Oil and Gas Nuclear Magnetic Resonance Industry Revenue Share (%), by Country 2024 & 2032
- Figure 8: South America Oil and Gas Nuclear Magnetic Resonance Industry Revenue (Million), by Country 2024 & 2032
- Figure 9: South America Oil and Gas Nuclear Magnetic Resonance Industry Revenue Share (%), by Country 2024 & 2032
- Figure 10: MEA Oil and Gas Nuclear Magnetic Resonance Industry Revenue (Million), by Country 2024 & 2032
- Figure 11: MEA Oil and Gas Nuclear Magnetic Resonance Industry Revenue Share (%), by Country 2024 & 2032
- Figure 12: North America Oil and Gas Nuclear Magnetic Resonance Industry Revenue (Million), by Location of Deployment 2024 & 2032
- Figure 13: North America Oil and Gas Nuclear Magnetic Resonance Industry Revenue Share (%), by Location of Deployment 2024 & 2032
- Figure 14: North America Oil and Gas Nuclear Magnetic Resonance Industry Revenue (Million), by Geogrpahy 2024 & 2032
- Figure 15: North America Oil and Gas Nuclear Magnetic Resonance Industry Revenue Share (%), by Geogrpahy 2024 & 2032
- Figure 16: North America Oil and Gas Nuclear Magnetic Resonance Industry Revenue (Million), by Country 2024 & 2032
- Figure 17: North America Oil and Gas Nuclear Magnetic Resonance Industry Revenue Share (%), by Country 2024 & 2032
- Figure 18: South America Oil and Gas Nuclear Magnetic Resonance Industry Revenue (Million), by Location of Deployment 2024 & 2032
- Figure 19: South America Oil and Gas Nuclear Magnetic Resonance Industry Revenue Share (%), by Location of Deployment 2024 & 2032
- Figure 20: South America Oil and Gas Nuclear Magnetic Resonance Industry Revenue (Million), by Geogrpahy 2024 & 2032
- Figure 21: South America Oil and Gas Nuclear Magnetic Resonance Industry Revenue Share (%), by Geogrpahy 2024 & 2032
- Figure 22: South America Oil and Gas Nuclear Magnetic Resonance Industry Revenue (Million), by Country 2024 & 2032
- Figure 23: South America Oil and Gas Nuclear Magnetic Resonance Industry Revenue Share (%), by Country 2024 & 2032
- Figure 24: Europe Oil and Gas Nuclear Magnetic Resonance Industry Revenue (Million), by Location of Deployment 2024 & 2032
- Figure 25: Europe Oil and Gas Nuclear Magnetic Resonance Industry Revenue Share (%), by Location of Deployment 2024 & 2032
- Figure 26: Europe Oil and Gas Nuclear Magnetic Resonance Industry Revenue (Million), by Geogrpahy 2024 & 2032
- Figure 27: Europe Oil and Gas Nuclear Magnetic Resonance Industry Revenue Share (%), by Geogrpahy 2024 & 2032
- Figure 28: Europe Oil and Gas Nuclear Magnetic Resonance Industry Revenue (Million), by Country 2024 & 2032
- Figure 29: Europe Oil and Gas Nuclear Magnetic Resonance Industry Revenue Share (%), by Country 2024 & 2032
- Figure 30: Middle East & Africa Oil and Gas Nuclear Magnetic Resonance Industry Revenue (Million), by Location of Deployment 2024 & 2032
- Figure 31: Middle East & Africa Oil and Gas Nuclear Magnetic Resonance Industry Revenue Share (%), by Location of Deployment 2024 & 2032
- Figure 32: Middle East & Africa Oil and Gas Nuclear Magnetic Resonance Industry Revenue (Million), by Geogrpahy 2024 & 2032
- Figure 33: Middle East & Africa Oil and Gas Nuclear Magnetic Resonance Industry Revenue Share (%), by Geogrpahy 2024 & 2032
- Figure 34: Middle East & Africa Oil and Gas Nuclear Magnetic Resonance Industry Revenue (Million), by Country 2024 & 2032
- Figure 35: Middle East & Africa Oil and Gas Nuclear Magnetic Resonance Industry Revenue Share (%), by Country 2024 & 2032
- Figure 36: Asia Pacific Oil and Gas Nuclear Magnetic Resonance Industry Revenue (Million), by Location of Deployment 2024 & 2032
- Figure 37: Asia Pacific Oil and Gas Nuclear Magnetic Resonance Industry Revenue Share (%), by Location of Deployment 2024 & 2032
- Figure 38: Asia Pacific Oil and Gas Nuclear Magnetic Resonance Industry Revenue (Million), by Geogrpahy 2024 & 2032
- Figure 39: Asia Pacific Oil and Gas Nuclear Magnetic Resonance Industry Revenue Share (%), by Geogrpahy 2024 & 2032
- Figure 40: Asia Pacific Oil and Gas Nuclear Magnetic Resonance Industry Revenue (Million), by Country 2024 & 2032
- Figure 41: Asia Pacific Oil and Gas Nuclear Magnetic Resonance Industry Revenue Share (%), by Country 2024 & 2032
List of Tables
- Table 1: Global Oil and Gas Nuclear Magnetic Resonance Industry Revenue Million Forecast, by Region 2019 & 2032
- Table 2: Global Oil and Gas Nuclear Magnetic Resonance Industry Revenue Million Forecast, by Location of Deployment 2019 & 2032
- Table 3: Global Oil and Gas Nuclear Magnetic Resonance Industry Revenue Million Forecast, by Geogrpahy 2019 & 2032
- Table 4: Global Oil and Gas Nuclear Magnetic Resonance Industry Revenue Million Forecast, by Region 2019 & 2032
- Table 5: Global Oil and Gas Nuclear Magnetic Resonance Industry Revenue Million Forecast, by Country 2019 & 2032
- Table 6: United States Oil and Gas Nuclear Magnetic Resonance Industry Revenue (Million) Forecast, by Application 2019 & 2032
- Table 7: Canada Oil and Gas Nuclear Magnetic Resonance Industry Revenue (Million) Forecast, by Application 2019 & 2032
- Table 8: Mexico Oil and Gas Nuclear Magnetic Resonance Industry Revenue (Million) Forecast, by Application 2019 & 2032
- Table 9: Global Oil and Gas Nuclear Magnetic Resonance Industry Revenue Million Forecast, by Country 2019 & 2032
- Table 10: Germany Oil and Gas Nuclear Magnetic Resonance Industry Revenue (Million) Forecast, by Application 2019 & 2032
- Table 11: United Kingdom Oil and Gas Nuclear Magnetic Resonance Industry Revenue (Million) Forecast, by Application 2019 & 2032
- Table 12: France Oil and Gas Nuclear Magnetic Resonance Industry Revenue (Million) Forecast, by Application 2019 & 2032
- Table 13: Spain Oil and Gas Nuclear Magnetic Resonance Industry Revenue (Million) Forecast, by Application 2019 & 2032
- Table 14: Italy Oil and Gas Nuclear Magnetic Resonance Industry Revenue (Million) Forecast, by Application 2019 & 2032
- Table 15: Spain Oil and Gas Nuclear Magnetic Resonance Industry Revenue (Million) Forecast, by Application 2019 & 2032
- Table 16: Belgium Oil and Gas Nuclear Magnetic Resonance Industry Revenue (Million) Forecast, by Application 2019 & 2032
- Table 17: Netherland Oil and Gas Nuclear Magnetic Resonance Industry Revenue (Million) Forecast, by Application 2019 & 2032
- Table 18: Nordics Oil and Gas Nuclear Magnetic Resonance Industry Revenue (Million) Forecast, by Application 2019 & 2032
- Table 19: Rest of Europe Oil and Gas Nuclear Magnetic Resonance Industry Revenue (Million) Forecast, by Application 2019 & 2032
- Table 20: Global Oil and Gas Nuclear Magnetic Resonance Industry Revenue Million Forecast, by Country 2019 & 2032
- Table 21: China Oil and Gas Nuclear Magnetic Resonance Industry Revenue (Million) Forecast, by Application 2019 & 2032
- Table 22: Japan Oil and Gas Nuclear Magnetic Resonance Industry Revenue (Million) Forecast, by Application 2019 & 2032
- Table 23: India Oil and Gas Nuclear Magnetic Resonance Industry Revenue (Million) Forecast, by Application 2019 & 2032
- Table 24: South Korea Oil and Gas Nuclear Magnetic Resonance Industry Revenue (Million) Forecast, by Application 2019 & 2032
- Table 25: Southeast Asia Oil and Gas Nuclear Magnetic Resonance Industry Revenue (Million) Forecast, by Application 2019 & 2032
- Table 26: Australia Oil and Gas Nuclear Magnetic Resonance Industry Revenue (Million) Forecast, by Application 2019 & 2032
- Table 27: Indonesia Oil and Gas Nuclear Magnetic Resonance Industry Revenue (Million) Forecast, by Application 2019 & 2032
- Table 28: Phillipes Oil and Gas Nuclear Magnetic Resonance Industry Revenue (Million) Forecast, by Application 2019 & 2032
- Table 29: Singapore Oil and Gas Nuclear Magnetic Resonance Industry Revenue (Million) Forecast, by Application 2019 & 2032
- Table 30: Thailandc Oil and Gas Nuclear Magnetic Resonance Industry Revenue (Million) Forecast, by Application 2019 & 2032
- Table 31: Rest of Asia Pacific Oil and Gas Nuclear Magnetic Resonance Industry Revenue (Million) Forecast, by Application 2019 & 2032
- Table 32: Global Oil and Gas Nuclear Magnetic Resonance Industry Revenue Million Forecast, by Country 2019 & 2032
- Table 33: Brazil Oil and Gas Nuclear Magnetic Resonance Industry Revenue (Million) Forecast, by Application 2019 & 2032
- Table 34: Argentina Oil and Gas Nuclear Magnetic Resonance Industry Revenue (Million) Forecast, by Application 2019 & 2032
- Table 35: Peru Oil and Gas Nuclear Magnetic Resonance Industry Revenue (Million) Forecast, by Application 2019 & 2032
- Table 36: Chile Oil and Gas Nuclear Magnetic Resonance Industry Revenue (Million) Forecast, by Application 2019 & 2032
- Table 37: Colombia Oil and Gas Nuclear Magnetic Resonance Industry Revenue (Million) Forecast, by Application 2019 & 2032
- Table 38: Ecuador Oil and Gas Nuclear Magnetic Resonance Industry Revenue (Million) Forecast, by Application 2019 & 2032
- Table 39: Venezuela Oil and Gas Nuclear Magnetic Resonance Industry Revenue (Million) Forecast, by Application 2019 & 2032
- Table 40: Rest of South America Oil and Gas Nuclear Magnetic Resonance Industry Revenue (Million) Forecast, by Application 2019 & 2032
- Table 41: Global Oil and Gas Nuclear Magnetic Resonance Industry Revenue Million Forecast, by Country 2019 & 2032
- Table 42: United Arab Emirates Oil and Gas Nuclear Magnetic Resonance Industry Revenue (Million) Forecast, by Application 2019 & 2032
- Table 43: Saudi Arabia Oil and Gas Nuclear Magnetic Resonance Industry Revenue (Million) Forecast, by Application 2019 & 2032
- Table 44: South Africa Oil and Gas Nuclear Magnetic Resonance Industry Revenue (Million) Forecast, by Application 2019 & 2032
- Table 45: Rest of Middle East and Africa Oil and Gas Nuclear Magnetic Resonance Industry Revenue (Million) Forecast, by Application 2019 & 2032
- Table 46: Global Oil and Gas Nuclear Magnetic Resonance Industry Revenue Million Forecast, by Location of Deployment 2019 & 2032
- Table 47: Global Oil and Gas Nuclear Magnetic Resonance Industry Revenue Million Forecast, by Geogrpahy 2019 & 2032
- Table 48: Global Oil and Gas Nuclear Magnetic Resonance Industry Revenue Million Forecast, by Country 2019 & 2032
- Table 49: United States Oil and Gas Nuclear Magnetic Resonance Industry Revenue (Million) Forecast, by Application 2019 & 2032
- Table 50: Canada Oil and Gas Nuclear Magnetic Resonance Industry Revenue (Million) Forecast, by Application 2019 & 2032
- Table 51: Mexico Oil and Gas Nuclear Magnetic Resonance Industry Revenue (Million) Forecast, by Application 2019 & 2032
- Table 52: Global Oil and Gas Nuclear Magnetic Resonance Industry Revenue Million Forecast, by Location of Deployment 2019 & 2032
- Table 53: Global Oil and Gas Nuclear Magnetic Resonance Industry Revenue Million Forecast, by Geogrpahy 2019 & 2032
- Table 54: Global Oil and Gas Nuclear Magnetic Resonance Industry Revenue Million Forecast, by Country 2019 & 2032
- Table 55: Brazil Oil and Gas Nuclear Magnetic Resonance Industry Revenue (Million) Forecast, by Application 2019 & 2032
- Table 56: Argentina Oil and Gas Nuclear Magnetic Resonance Industry Revenue (Million) Forecast, by Application 2019 & 2032
- Table 57: Rest of South America Oil and Gas Nuclear Magnetic Resonance Industry Revenue (Million) Forecast, by Application 2019 & 2032
- Table 58: Global Oil and Gas Nuclear Magnetic Resonance Industry Revenue Million Forecast, by Location of Deployment 2019 & 2032
- Table 59: Global Oil and Gas Nuclear Magnetic Resonance Industry Revenue Million Forecast, by Geogrpahy 2019 & 2032
- Table 60: Global Oil and Gas Nuclear Magnetic Resonance Industry Revenue Million Forecast, by Country 2019 & 2032
- Table 61: United Kingdom Oil and Gas Nuclear Magnetic Resonance Industry Revenue (Million) Forecast, by Application 2019 & 2032
- Table 62: Germany Oil and Gas Nuclear Magnetic Resonance Industry Revenue (Million) Forecast, by Application 2019 & 2032
- Table 63: France Oil and Gas Nuclear Magnetic Resonance Industry Revenue (Million) Forecast, by Application 2019 & 2032
- Table 64: Italy Oil and Gas Nuclear Magnetic Resonance Industry Revenue (Million) Forecast, by Application 2019 & 2032
- Table 65: Spain Oil and Gas Nuclear Magnetic Resonance Industry Revenue (Million) Forecast, by Application 2019 & 2032
- Table 66: Russia Oil and Gas Nuclear Magnetic Resonance Industry Revenue (Million) Forecast, by Application 2019 & 2032
- Table 67: Benelux Oil and Gas Nuclear Magnetic Resonance Industry Revenue (Million) Forecast, by Application 2019 & 2032
- Table 68: Nordics Oil and Gas Nuclear Magnetic Resonance Industry Revenue (Million) Forecast, by Application 2019 & 2032
- Table 69: Rest of Europe Oil and Gas Nuclear Magnetic Resonance Industry Revenue (Million) Forecast, by Application 2019 & 2032
- Table 70: Global Oil and Gas Nuclear Magnetic Resonance Industry Revenue Million Forecast, by Location of Deployment 2019 & 2032
- Table 71: Global Oil and Gas Nuclear Magnetic Resonance Industry Revenue Million Forecast, by Geogrpahy 2019 & 2032
- Table 72: Global Oil and Gas Nuclear Magnetic Resonance Industry Revenue Million Forecast, by Country 2019 & 2032
- Table 73: Turkey Oil and Gas Nuclear Magnetic Resonance Industry Revenue (Million) Forecast, by Application 2019 & 2032
- Table 74: Israel Oil and Gas Nuclear Magnetic Resonance Industry Revenue (Million) Forecast, by Application 2019 & 2032
- Table 75: GCC Oil and Gas Nuclear Magnetic Resonance Industry Revenue (Million) Forecast, by Application 2019 & 2032
- Table 76: North Africa Oil and Gas Nuclear Magnetic Resonance Industry Revenue (Million) Forecast, by Application 2019 & 2032
- Table 77: South Africa Oil and Gas Nuclear Magnetic Resonance Industry Revenue (Million) Forecast, by Application 2019 & 2032
- Table 78: Rest of Middle East & Africa Oil and Gas Nuclear Magnetic Resonance Industry Revenue (Million) Forecast, by Application 2019 & 2032
- Table 79: Global Oil and Gas Nuclear Magnetic Resonance Industry Revenue Million Forecast, by Location of Deployment 2019 & 2032
- Table 80: Global Oil and Gas Nuclear Magnetic Resonance Industry Revenue Million Forecast, by Geogrpahy 2019 & 2032
- Table 81: Global Oil and Gas Nuclear Magnetic Resonance Industry Revenue Million Forecast, by Country 2019 & 2032
- Table 82: China Oil and Gas Nuclear Magnetic Resonance Industry Revenue (Million) Forecast, by Application 2019 & 2032
- Table 83: India Oil and Gas Nuclear Magnetic Resonance Industry Revenue (Million) Forecast, by Application 2019 & 2032
- Table 84: Japan Oil and Gas Nuclear Magnetic Resonance Industry Revenue (Million) Forecast, by Application 2019 & 2032
- Table 85: South Korea Oil and Gas Nuclear Magnetic Resonance Industry Revenue (Million) Forecast, by Application 2019 & 2032
- Table 86: ASEAN Oil and Gas Nuclear Magnetic Resonance Industry Revenue (Million) Forecast, by Application 2019 & 2032
- Table 87: Oceania Oil and Gas Nuclear Magnetic Resonance Industry Revenue (Million) Forecast, by Application 2019 & 2032
- Table 88: Rest of Asia Pacific Oil and Gas Nuclear Magnetic Resonance Industry Revenue (Million) Forecast, by Application 2019 & 2032
Frequently Asked Questions
1. What is the projected Compound Annual Growth Rate (CAGR) of the Oil and Gas Nuclear Magnetic Resonance Industry?
The projected CAGR is approximately > 5.00%.
2. Which companies are prominent players in the Oil and Gas Nuclear Magnetic Resonance Industry?
Key companies in the market include Mount Sopris Instruments Inc, Vista Clara Inc, Weatherford International plc, Baker Hughes Company, Halliburton Company, Qteq Pty Ltd, Schlumberger Limited.
3. What are the main segments of the Oil and Gas Nuclear Magnetic Resonance Industry?
The market segments include Location of Deployment, Geogrpahy.
4. Can you provide details about the market size?
The market size is estimated to be USD XX Million as of 2022.
5. What are some drivers contributing to market growth?
4.; Increasing Production from Unconventional Sources4.; Growing Energy Demand in the Region.
6. What are the notable trends driving market growth?
Onshore Sector to Dominate the Demand.
7. Are there any restraints impacting market growth?
4.; Environmental Concerns.
8. Can you provide examples of recent developments in the market?
February 2023: Saudi Aramco expects to award contracts for some 90 projects by 2025 as it presses ahead with major upstream oil and gas capacity expansions.
9. What pricing options are available for accessing the report?
Pricing options include single-user, multi-user, and enterprise licenses priced at USD 4750, USD 5250, and USD 8750 respectively.
10. Is the market size provided in terms of value or volume?
The market size is provided in terms of value, measured in Million.
11. Are there any specific market keywords associated with the report?
Yes, the market keyword associated with the report is "Oil and Gas Nuclear Magnetic Resonance Industry," which aids in identifying and referencing the specific market segment covered.
12. How do I determine which pricing option suits my needs best?
The pricing options vary based on user requirements and access needs. Individual users may opt for single-user licenses, while businesses requiring broader access may choose multi-user or enterprise licenses for cost-effective access to the report.
13. Are there any additional resources or data provided in the Oil and Gas Nuclear Magnetic Resonance Industry report?
While the report offers comprehensive insights, it's advisable to review the specific contents or supplementary materials provided to ascertain if additional resources or data are available.
14. How can I stay updated on further developments or reports in the Oil and Gas Nuclear Magnetic Resonance Industry?
To stay informed about further developments, trends, and reports in the Oil and Gas Nuclear Magnetic Resonance Industry, consider subscribing to industry newsletters, following relevant companies and organizations, or regularly checking reputable industry news sources and publications.
Methodology
Step 1 - Identification of Relevant Samples Size from Population Database


Step 2 - Approaches for Defining Global Market Size (Value, Volume* & Price*)

Note*: In applicable scenarios
Step 3 - Data Sources
Primary Research
- Web Analytics
- Survey Reports
- Research Institute
- Latest Research Reports
- Opinion Leaders
Secondary Research
- Annual Reports
- White Paper
- Latest Press Release
- Industry Association
- Paid Database
- Investor Presentations

Step 4 - Data Triangulation
Involves using different sources of information in order to increase the validity of a study
These sources are likely to be stakeholders in a program - participants, other researchers, program staff, other community members, and so on.
Then we put all data in single framework & apply various statistical tools to find out the dynamic on the market.
During the analysis stage, feedback from the stakeholder groups would be compared to determine areas of agreement as well as areas of divergence
