

Key Insights
The global nuclear reactor construction industry is experiencing steady growth, projected to maintain a Compound Annual Growth Rate (CAGR) exceeding 1.95% from 2025 to 2033. This expansion is driven by several key factors. Firstly, the increasing global demand for clean and reliable energy sources is pushing nations to invest in nuclear power, particularly those seeking to diversify their energy portfolios and reduce carbon emissions. Secondly, advancements in reactor technology, such as the development of smaller, modular reactors (SMRs) and improved safety features, are making nuclear power more attractive and economically viable. Technological advancements are also streamlining the construction process, improving efficiency, and reducing overall costs. However, the industry faces challenges, including the high capital costs associated with nuclear power plant construction, stringent regulatory hurdles, and public concerns related to nuclear safety and waste disposal. These factors can influence the pace of growth and necessitate careful planning and investment strategies from industry stakeholders.
The market segmentation reveals a diverse landscape. Service segments, encompassing equipment and auxiliary equipment installation, represent significant revenue streams. Reactor types, including Pressurized Water Reactors (PWRs), Pressurized Heavy Water Reactors (PHWRs), Boiling Water Reactors (BWRs), High-Temperature Gas-Cooled Reactors (HTGRs), and Liquid-Metal Fast-Breeder Reactors (LMFBRs), each contribute uniquely to market size, with PWRs and BWRs currently dominating. Geographical distribution shows strong representation in North America, Europe, and Asia-Pacific, reflecting significant investments in these regions. Key players in the market, such as Dongfang Electric, SKODA JS, Larsen & Toubro, Bilfinger SE, Doosan Corporation, and others, are strategically positioned to capitalize on growth opportunities. Competitive pressures, technological innovation, and government policies will continue to shape the industry's trajectory over the forecast period. The market is expected to show consistent growth, though the exact pace will depend on a successful mitigation of the challenges faced.

Nuclear Reactor Construction Industry: A Comprehensive Market Report (2019-2033)
This insightful report provides a comprehensive analysis of the Nuclear Reactor Construction Industry, encompassing market trends, technological advancements, leading players, and future growth prospects. With a study period spanning 2019-2033, a base year of 2025, and a forecast period of 2025-2033, this report offers invaluable data for stakeholders seeking to navigate this dynamic sector. The report's detailed analysis covers key reactor types, including Pressurized Water Reactor (PWR), Pressurized Heavy Water Reactor (PHWR), Boiling Water Reactor (BWR), High-Temperature Gas-Cooled Reactor (HTGR), and Liquid-Metal Fast-Breeder Reactor (LMFBR), alongside crucial service segments like Equipment and Auxiliary Equipment Installation. The total market value is projected to reach xx Million by 2033.
Nuclear Reactor Construction Industry Market Composition & Trends
The Nuclear Reactor Construction Industry exhibits a moderately concentrated market structure, with key players such as Dongfang Electric Corporation Limited, SKODA JS a.s., Larsen & Toubro Limited, Bilfinger SE, Doosan Corporation, China National Nuclear Corporation, Shanghai Electric Group Company Limited, KEPCO Engineering & Construction, Westinghouse Electric Company LLC (Toshiba), Rosatom Corp, Mitsubishi Heavy Industries Ltd, and GE-Hitchito Nuclear Energy Inc holding significant market share. Market share distribution varies across reactor types and geographical regions. Innovation is driven by the need for enhanced safety features, improved efficiency, and the development of Small Modular Reactors (SMRs). Regulatory landscapes vary significantly across countries, influencing project timelines and costs. Substitute energy sources, such as renewables, pose a competitive pressure, albeit one currently limited by intermittency concerns and energy security needs. End-users primarily include governments and national power utilities. M&A activity has been relatively modest in recent years, with deal values averaging xx Million per transaction in the historical period (2019-2024).
- Market Concentration: Moderately concentrated, with top 10 players holding approximately xx% market share.
- Innovation Catalysts: SMR development, enhanced safety features, and improved efficiency.
- Regulatory Landscape: Highly variable across nations, impacting project approvals and costs.
- Substitute Products: Renewable energy sources (solar, wind), posing a long-term competitive threat.
- End-User Profile: Primarily government entities and national power utilities.
- M&A Activity: Average deal value: xx Million (2019-2024), xx deals completed.
Nuclear Reactor Construction Industry Industry Evolution
The nuclear reactor construction industry has experienced fluctuating growth trajectories over the historical period (2019-2024), influenced by factors like political decisions, economic conditions, and public perception. However, a renewed focus on energy security and climate change mitigation is driving renewed interest in nuclear power. Growth is expected to accelerate in the forecast period (2025-2033), with a compound annual growth rate (CAGR) projected at xx%. Technological advancements, particularly in SMR design and digitalization of construction processes, are significantly improving efficiency and reducing construction times. Consumer demand is largely driven by the need for reliable, low-carbon baseload electricity. The adoption of advanced reactor designs, including SMRs, is gaining traction, although the rate of adoption is subject to regulatory hurdles and public perception. Specific growth rates vary by region and reactor type, with PWR and PHWR technologies dominating the market. The increasing focus on sustainability is driving technological advancements in waste management and reactor safety, further increasing market demand.
Leading Regions, Countries, or Segments in Nuclear Reactor Construction Industry
While specific market share data across regions and segments necessitates further detailed research, existing information suggests that Asia (specifically China and India) and certain European countries have led the industry in recent years. PWR and PHWR technologies remain dominant owing to their established track record and technological maturity.
Key Drivers for Dominant Regions/Segments:
- Asia (China & India): Significant government investment in nuclear power expansion, strong domestic manufacturing capabilities, and large energy demands.
- Europe: Existing nuclear power infrastructure, ongoing upgrades and replacement projects, and government support for nuclear as a low-carbon energy source.
- PWR & PHWR: Technological maturity, established supply chains, and relative cost-effectiveness.
Factors Contributing to Dominance:
- Government Policies: Supportive policies and financial incentives in several countries are critical for driving investment in nuclear power projects.
- Energy Demand: Growing global energy needs fuel the demand for reliable and low-carbon baseload power generation, making nuclear power increasingly attractive.
- Technological Advancements: Continuous improvements in reactor design and construction methods contribute to improved safety, efficiency, and cost-effectiveness.
Nuclear Reactor Construction Industry Product Innovations
Recent innovations include advanced reactor designs such as SMRs, focusing on enhanced safety features, modular construction for reduced costs and timelines, and improved waste management. The incorporation of digital technologies, including advanced simulation and AI-powered monitoring systems, has improved operational efficiency and predictive maintenance. These innovations offer unique selling propositions such as reduced construction time, improved safety profiles, and optimized operational performance, leading to a compelling value proposition for end-users.
Propelling Factors for Nuclear Reactor Construction Industry Growth
Several factors drive the industry's growth. Firstly, the increasing focus on energy security and diversification away from fossil fuels fuels nuclear energy's appeal. Secondly, the urgency of climate change mitigation, along with commitments to net-zero targets by many countries, positions nuclear as a significant low-carbon energy source. Lastly, government support, through funding, regulatory approvals, and favorable policies, acts as a powerful catalyst for market expansion. The successful deployment of SMRs promises further acceleration of this growth.
Obstacles in the Nuclear Reactor Construction Industry Market
Significant barriers impede industry growth. Stringent regulatory requirements, including licensing and safety protocols, add complexity and increase project timelines and costs. Supply chain disruptions, particularly concerning specialized materials and components, create project delays and cost overruns. Finally, intense competition among established and emerging players adds to the complexity of the market. The overall impact of these obstacles, in terms of market growth and profitability, is estimated to be xx%.
Future Opportunities in Nuclear Reactor Construction Industry
Future opportunities lie in the growing demand for SMRs, the development of advanced reactor designs with improved safety features, and expansion into emerging markets, particularly in developing nations. Further innovations in digitalization, including AI-driven automation and predictive maintenance, will significantly improve efficiency. The application of nuclear technology for desalination is also a promising avenue.
Major Players in the Nuclear Reactor Construction Industry Ecosystem
- Dongfang Electric Corporation Limited
- SKODA JS a.s.
- Larsen & Toubro Limited
- Bilfinger SE
- Doosan Corporation
- China National Nuclear Corporation
- Shanghai Electric Group Company Limited
- KEPCO Engineering & Construction
- Westinghouse Electric Company LLC (Toshiba)
- Rosatom Corp
- Mitsubishi Heavy Industries Ltd
- GE-Hitachi Nuclear Energy Inc
Key Developments in Nuclear Reactor Construction Industry Industry
- October 2022: The US and Japan partnered with Ghana to support SMR deployment, signaling growing international collaboration and interest in advanced reactor technology.
- March 2022: India announced plans for "fleet mode" reactor construction, indicating a significant increase in investment and project activity.
Strategic Nuclear Reactor Construction Industry Market Forecast
The nuclear reactor construction industry is poised for significant growth in the forecast period (2025-2033), driven by increasing energy demands, a renewed focus on energy security and climate change mitigation, and technological advancements in reactor design and construction. The expansion into new markets and the successful deployment of SMR technologies will further accelerate market growth, creating significant opportunities for established players and new entrants alike. The total market value is projected to reach xx Million by 2033, indicating a substantial market potential for the coming decade.
Nuclear Reactor Construction Industry Segmentation
-
1. Service
-
1.1. Equipment
- 1.1.1. Island Equipment
- 1.1.2. Auxiliary Equipment
- 1.2. Installation
-
1.1. Equipment
-
2. Reactor Type
- 2.1. Pressuri
- 2.2. Boiling Water Reactor
- 2.3. High-temperature Gas Cooled Reactor
- 2.4. Liquid-metal Fast-Breeder Reactor
Nuclear Reactor Construction Industry Segmentation By Geography
- 1. North America
- 2. Europe
- 3. Asia Pacific
- 4. South America
- 5. Middle East and Africa

Nuclear Reactor Construction Industry REPORT HIGHLIGHTS
| Aspects | Details |
|---|---|
| Study Period | 2019-2033 |
| Base Year | 2024 |
| Estimated Year | 2025 |
| Forecast Period | 2025-2033 |
| Historical Period | 2019-2024 |
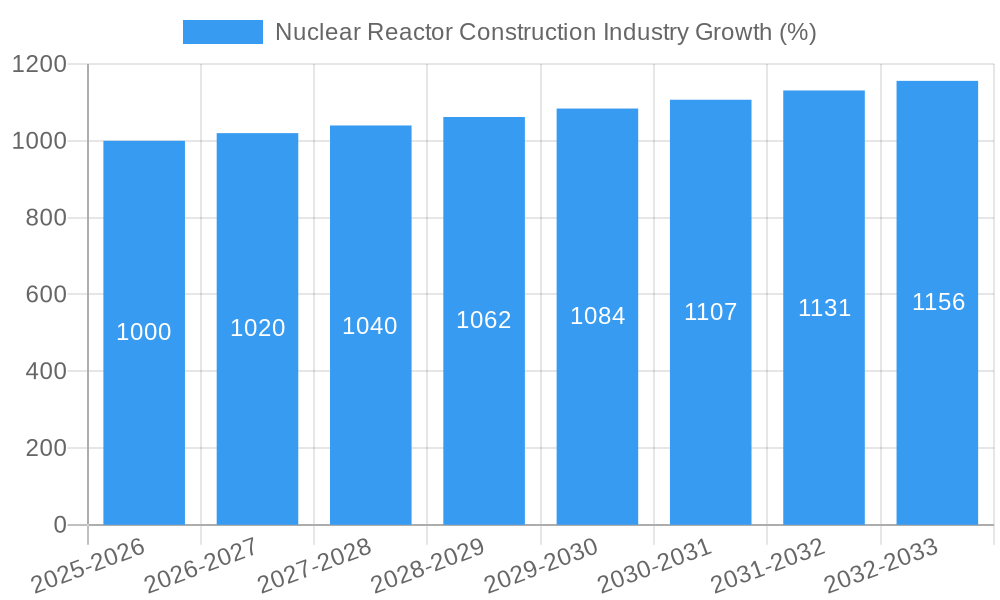
| Growth Rate | CAGR of > 1.95% from 2019-2033 |
| Segmentation |
|
Table of Contents
- 1. Introduction
- 1.1. Research Scope
- 1.2. Market Segmentation
- 1.3. Research Methodology
- 1.4. Definitions and Assumptions
- 2. Executive Summary
- 2.1. Introduction
- 3. Market Dynamics
- 3.1. Introduction
- 3.2. Market Drivers
- 3.2.1. 4.; Rising Demand for Reliable Electricity4.; Increasing Government Support for Hydropower Gneeration
- 3.3. Market Restrains
- 3.3.1. 4.; Negative Environmental Consequences of Hydropower Projects
- 3.4. Market Trends
- 3.4.1. Pressurized Water Reactor to Dominate the Market
- 4. Market Factor Analysis
- 4.1. Porters Five Forces
- 4.2. Supply/Value Chain
- 4.3. PESTEL analysis
- 4.4. Market Entropy
- 4.5. Patent/Trademark Analysis
- 5. Global Nuclear Reactor Construction Industry Analysis, Insights and Forecast, 2019-2031
- 5.1. Market Analysis, Insights and Forecast - by Service
- 5.1.1. Equipment
- 5.1.1.1. Island Equipment
- 5.1.1.2. Auxiliary Equipment
- 5.1.2. Installation
- 5.1.1. Equipment
- 5.2. Market Analysis, Insights and Forecast - by Reactor Type
- 5.2.1. Pressuri
- 5.2.2. Boiling Water Reactor
- 5.2.3. High-temperature Gas Cooled Reactor
- 5.2.4. Liquid-metal Fast-Breeder Reactor
- 5.3. Market Analysis, Insights and Forecast - by Region
- 5.3.1. North America
- 5.3.2. Europe
- 5.3.3. Asia Pacific
- 5.3.4. South America
- 5.3.5. Middle East and Africa
- 5.1. Market Analysis, Insights and Forecast - by Service
- 6. North America Nuclear Reactor Construction Industry Analysis, Insights and Forecast, 2019-2031
- 6.1. Market Analysis, Insights and Forecast - by Service
- 6.1.1. Equipment
- 6.1.1.1. Island Equipment
- 6.1.1.2. Auxiliary Equipment
- 6.1.2. Installation
- 6.1.1. Equipment
- 6.2. Market Analysis, Insights and Forecast - by Reactor Type
- 6.2.1. Pressuri
- 6.2.2. Boiling Water Reactor
- 6.2.3. High-temperature Gas Cooled Reactor
- 6.2.4. Liquid-metal Fast-Breeder Reactor
- 6.1. Market Analysis, Insights and Forecast - by Service
- 7. Europe Nuclear Reactor Construction Industry Analysis, Insights and Forecast, 2019-2031
- 7.1. Market Analysis, Insights and Forecast - by Service
- 7.1.1. Equipment
- 7.1.1.1. Island Equipment
- 7.1.1.2. Auxiliary Equipment
- 7.1.2. Installation
- 7.1.1. Equipment
- 7.2. Market Analysis, Insights and Forecast - by Reactor Type
- 7.2.1. Pressuri
- 7.2.2. Boiling Water Reactor
- 7.2.3. High-temperature Gas Cooled Reactor
- 7.2.4. Liquid-metal Fast-Breeder Reactor
- 7.1. Market Analysis, Insights and Forecast - by Service
- 8. Asia Pacific Nuclear Reactor Construction Industry Analysis, Insights and Forecast, 2019-2031
- 8.1. Market Analysis, Insights and Forecast - by Service
- 8.1.1. Equipment
- 8.1.1.1. Island Equipment
- 8.1.1.2. Auxiliary Equipment
- 8.1.2. Installation
- 8.1.1. Equipment
- 8.2. Market Analysis, Insights and Forecast - by Reactor Type
- 8.2.1. Pressuri
- 8.2.2. Boiling Water Reactor
- 8.2.3. High-temperature Gas Cooled Reactor
- 8.2.4. Liquid-metal Fast-Breeder Reactor
- 8.1. Market Analysis, Insights and Forecast - by Service
- 9. South America Nuclear Reactor Construction Industry Analysis, Insights and Forecast, 2019-2031
- 9.1. Market Analysis, Insights and Forecast - by Service
- 9.1.1. Equipment
- 9.1.1.1. Island Equipment
- 9.1.1.2. Auxiliary Equipment
- 9.1.2. Installation
- 9.1.1. Equipment
- 9.2. Market Analysis, Insights and Forecast - by Reactor Type
- 9.2.1. Pressuri
- 9.2.2. Boiling Water Reactor
- 9.2.3. High-temperature Gas Cooled Reactor
- 9.2.4. Liquid-metal Fast-Breeder Reactor
- 9.1. Market Analysis, Insights and Forecast - by Service
- 10. Middle East and Africa Nuclear Reactor Construction Industry Analysis, Insights and Forecast, 2019-2031
- 10.1. Market Analysis, Insights and Forecast - by Service
- 10.1.1. Equipment
- 10.1.1.1. Island Equipment
- 10.1.1.2. Auxiliary Equipment
- 10.1.2. Installation
- 10.1.1. Equipment
- 10.2. Market Analysis, Insights and Forecast - by Reactor Type
- 10.2.1. Pressuri
- 10.2.2. Boiling Water Reactor
- 10.2.3. High-temperature Gas Cooled Reactor
- 10.2.4. Liquid-metal Fast-Breeder Reactor
- 10.1. Market Analysis, Insights and Forecast - by Service
- 11. North America Nuclear Reactor Construction Industry Analysis, Insights and Forecast, 2019-2031
- 11.1. Market Analysis, Insights and Forecast - By Country/Sub-region
- 11.1.1 United States
- 11.1.2 Canada
- 11.1.3 Mexico
- 12. Europe Nuclear Reactor Construction Industry Analysis, Insights and Forecast, 2019-2031
- 12.1. Market Analysis, Insights and Forecast - By Country/Sub-region
- 12.1.1 Germany
- 12.1.2 United Kingdom
- 12.1.3 France
- 12.1.4 Spain
- 12.1.5 Italy
- 12.1.6 Spain
- 12.1.7 Belgium
- 12.1.8 Netherland
- 12.1.9 Nordics
- 12.1.10 Rest of Europe
- 13. Asia Pacific Nuclear Reactor Construction Industry Analysis, Insights and Forecast, 2019-2031
- 13.1. Market Analysis, Insights and Forecast - By Country/Sub-region
- 13.1.1 China
- 13.1.2 Japan
- 13.1.3 India
- 13.1.4 South Korea
- 13.1.5 Southeast Asia
- 13.1.6 Australia
- 13.1.7 Indonesia
- 13.1.8 Phillipes
- 13.1.9 Singapore
- 13.1.10 Thailandc
- 13.1.11 Rest of Asia Pacific
- 14. South America Nuclear Reactor Construction Industry Analysis, Insights and Forecast, 2019-2031
- 14.1. Market Analysis, Insights and Forecast - By Country/Sub-region
- 14.1.1 Brazil
- 14.1.2 Argentina
- 14.1.3 Peru
- 14.1.4 Chile
- 14.1.5 Colombia
- 14.1.6 Ecuador
- 14.1.7 Venezuela
- 14.1.8 Rest of South America
- 15. North America Nuclear Reactor Construction Industry Analysis, Insights and Forecast, 2019-2031
- 15.1. Market Analysis, Insights and Forecast - By Country/Sub-region
- 15.1.1 United States
- 15.1.2 Canada
- 15.1.3 Mexico
- 16. MEA Nuclear Reactor Construction Industry Analysis, Insights and Forecast, 2019-2031
- 16.1. Market Analysis, Insights and Forecast - By Country/Sub-region
- 16.1.1 United Arab Emirates
- 16.1.2 Saudi Arabia
- 16.1.3 South Africa
- 16.1.4 Rest of Middle East and Africa
- 17. Competitive Analysis
- 17.1. Global Market Share Analysis 2024
- 17.2. Company Profiles
- 17.2.1 Dongfang Electric Corporation Limited
- 17.2.1.1. Overview
- 17.2.1.2. Products
- 17.2.1.3. SWOT Analysis
- 17.2.1.4. Recent Developments
- 17.2.1.5. Financials (Based on Availability)
- 17.2.2 SKODA JS a s
- 17.2.2.1. Overview
- 17.2.2.2. Products
- 17.2.2.3. SWOT Analysis
- 17.2.2.4. Recent Developments
- 17.2.2.5. Financials (Based on Availability)
- 17.2.3 Larsen & Toubro Limited
- 17.2.3.1. Overview
- 17.2.3.2. Products
- 17.2.3.3. SWOT Analysis
- 17.2.3.4. Recent Developments
- 17.2.3.5. Financials (Based on Availability)
- 17.2.4 Bilfinger SE
- 17.2.4.1. Overview
- 17.2.4.2. Products
- 17.2.4.3. SWOT Analysis
- 17.2.4.4. Recent Developments
- 17.2.4.5. Financials (Based on Availability)
- 17.2.5 Doosan Corporation
- 17.2.5.1. Overview
- 17.2.5.2. Products
- 17.2.5.3. SWOT Analysis
- 17.2.5.4. Recent Developments
- 17.2.5.5. Financials (Based on Availability)
- 17.2.6 China National Nuclear Corporation
- 17.2.6.1. Overview
- 17.2.6.2. Products
- 17.2.6.3. SWOT Analysis
- 17.2.6.4. Recent Developments
- 17.2.6.5. Financials (Based on Availability)
- 17.2.7 Shanghai Electric Group Company Limited
- 17.2.7.1. Overview
- 17.2.7.2. Products
- 17.2.7.3. SWOT Analysis
- 17.2.7.4. Recent Developments
- 17.2.7.5. Financials (Based on Availability)
- 17.2.8 KEPCO Engineering & Construction
- 17.2.8.1. Overview
- 17.2.8.2. Products
- 17.2.8.3. SWOT Analysis
- 17.2.8.4. Recent Developments
- 17.2.8.5. Financials (Based on Availability)
- 17.2.9 Westinghouse Electric Company LLC (Toshiba)
- 17.2.9.1. Overview
- 17.2.9.2. Products
- 17.2.9.3. SWOT Analysis
- 17.2.9.4. Recent Developments
- 17.2.9.5. Financials (Based on Availability)
- 17.2.10 Rosatom Corp*List Not Exhaustive
- 17.2.10.1. Overview
- 17.2.10.2. Products
- 17.2.10.3. SWOT Analysis
- 17.2.10.4. Recent Developments
- 17.2.10.5. Financials (Based on Availability)
- 17.2.11 Mitsubishi Heavy Industries Ltd
- 17.2.11.1. Overview
- 17.2.11.2. Products
- 17.2.11.3. SWOT Analysis
- 17.2.11.4. Recent Developments
- 17.2.11.5. Financials (Based on Availability)
- 17.2.12 GE-Hitachi Nuclear Energy Inc
- 17.2.12.1. Overview
- 17.2.12.2. Products
- 17.2.12.3. SWOT Analysis
- 17.2.12.4. Recent Developments
- 17.2.12.5. Financials (Based on Availability)
- 17.2.1 Dongfang Electric Corporation Limited
List of Figures
- Figure 1: Global Nuclear Reactor Construction Industry Revenue Breakdown (Million, %) by Region 2024 & 2032
- Figure 2: North America Nuclear Reactor Construction Industry Revenue (Million), by Country 2024 & 2032
- Figure 3: North America Nuclear Reactor Construction Industry Revenue Share (%), by Country 2024 & 2032
- Figure 4: Europe Nuclear Reactor Construction Industry Revenue (Million), by Country 2024 & 2032
- Figure 5: Europe Nuclear Reactor Construction Industry Revenue Share (%), by Country 2024 & 2032
- Figure 6: Asia Pacific Nuclear Reactor Construction Industry Revenue (Million), by Country 2024 & 2032
- Figure 7: Asia Pacific Nuclear Reactor Construction Industry Revenue Share (%), by Country 2024 & 2032
- Figure 8: South America Nuclear Reactor Construction Industry Revenue (Million), by Country 2024 & 2032
- Figure 9: South America Nuclear Reactor Construction Industry Revenue Share (%), by Country 2024 & 2032
- Figure 10: North America Nuclear Reactor Construction Industry Revenue (Million), by Country 2024 & 2032
- Figure 11: North America Nuclear Reactor Construction Industry Revenue Share (%), by Country 2024 & 2032
- Figure 12: MEA Nuclear Reactor Construction Industry Revenue (Million), by Country 2024 & 2032
- Figure 13: MEA Nuclear Reactor Construction Industry Revenue Share (%), by Country 2024 & 2032
- Figure 14: North America Nuclear Reactor Construction Industry Revenue (Million), by Service 2024 & 2032
- Figure 15: North America Nuclear Reactor Construction Industry Revenue Share (%), by Service 2024 & 2032
- Figure 16: North America Nuclear Reactor Construction Industry Revenue (Million), by Reactor Type 2024 & 2032
- Figure 17: North America Nuclear Reactor Construction Industry Revenue Share (%), by Reactor Type 2024 & 2032
- Figure 18: North America Nuclear Reactor Construction Industry Revenue (Million), by Country 2024 & 2032
- Figure 19: North America Nuclear Reactor Construction Industry Revenue Share (%), by Country 2024 & 2032
- Figure 20: Europe Nuclear Reactor Construction Industry Revenue (Million), by Service 2024 & 2032
- Figure 21: Europe Nuclear Reactor Construction Industry Revenue Share (%), by Service 2024 & 2032
- Figure 22: Europe Nuclear Reactor Construction Industry Revenue (Million), by Reactor Type 2024 & 2032
- Figure 23: Europe Nuclear Reactor Construction Industry Revenue Share (%), by Reactor Type 2024 & 2032
- Figure 24: Europe Nuclear Reactor Construction Industry Revenue (Million), by Country 2024 & 2032
- Figure 25: Europe Nuclear Reactor Construction Industry Revenue Share (%), by Country 2024 & 2032
- Figure 26: Asia Pacific Nuclear Reactor Construction Industry Revenue (Million), by Service 2024 & 2032
- Figure 27: Asia Pacific Nuclear Reactor Construction Industry Revenue Share (%), by Service 2024 & 2032
- Figure 28: Asia Pacific Nuclear Reactor Construction Industry Revenue (Million), by Reactor Type 2024 & 2032
- Figure 29: Asia Pacific Nuclear Reactor Construction Industry Revenue Share (%), by Reactor Type 2024 & 2032
- Figure 30: Asia Pacific Nuclear Reactor Construction Industry Revenue (Million), by Country 2024 & 2032
- Figure 31: Asia Pacific Nuclear Reactor Construction Industry Revenue Share (%), by Country 2024 & 2032
- Figure 32: South America Nuclear Reactor Construction Industry Revenue (Million), by Service 2024 & 2032
- Figure 33: South America Nuclear Reactor Construction Industry Revenue Share (%), by Service 2024 & 2032
- Figure 34: South America Nuclear Reactor Construction Industry Revenue (Million), by Reactor Type 2024 & 2032
- Figure 35: South America Nuclear Reactor Construction Industry Revenue Share (%), by Reactor Type 2024 & 2032
- Figure 36: South America Nuclear Reactor Construction Industry Revenue (Million), by Country 2024 & 2032
- Figure 37: South America Nuclear Reactor Construction Industry Revenue Share (%), by Country 2024 & 2032
- Figure 38: Middle East and Africa Nuclear Reactor Construction Industry Revenue (Million), by Service 2024 & 2032
- Figure 39: Middle East and Africa Nuclear Reactor Construction Industry Revenue Share (%), by Service 2024 & 2032
- Figure 40: Middle East and Africa Nuclear Reactor Construction Industry Revenue (Million), by Reactor Type 2024 & 2032
- Figure 41: Middle East and Africa Nuclear Reactor Construction Industry Revenue Share (%), by Reactor Type 2024 & 2032
- Figure 42: Middle East and Africa Nuclear Reactor Construction Industry Revenue (Million), by Country 2024 & 2032
- Figure 43: Middle East and Africa Nuclear Reactor Construction Industry Revenue Share (%), by Country 2024 & 2032
List of Tables
- Table 1: Global Nuclear Reactor Construction Industry Revenue Million Forecast, by Region 2019 & 2032
- Table 2: Global Nuclear Reactor Construction Industry Revenue Million Forecast, by Service 2019 & 2032
- Table 3: Global Nuclear Reactor Construction Industry Revenue Million Forecast, by Reactor Type 2019 & 2032
- Table 4: Global Nuclear Reactor Construction Industry Revenue Million Forecast, by Region 2019 & 2032
- Table 5: Global Nuclear Reactor Construction Industry Revenue Million Forecast, by Country 2019 & 2032
- Table 6: United States Nuclear Reactor Construction Industry Revenue (Million) Forecast, by Application 2019 & 2032
- Table 7: Canada Nuclear Reactor Construction Industry Revenue (Million) Forecast, by Application 2019 & 2032
- Table 8: Mexico Nuclear Reactor Construction Industry Revenue (Million) Forecast, by Application 2019 & 2032
- Table 9: Global Nuclear Reactor Construction Industry Revenue Million Forecast, by Country 2019 & 2032
- Table 10: Germany Nuclear Reactor Construction Industry Revenue (Million) Forecast, by Application 2019 & 2032
- Table 11: United Kingdom Nuclear Reactor Construction Industry Revenue (Million) Forecast, by Application 2019 & 2032
- Table 12: France Nuclear Reactor Construction Industry Revenue (Million) Forecast, by Application 2019 & 2032
- Table 13: Spain Nuclear Reactor Construction Industry Revenue (Million) Forecast, by Application 2019 & 2032
- Table 14: Italy Nuclear Reactor Construction Industry Revenue (Million) Forecast, by Application 2019 & 2032
- Table 15: Spain Nuclear Reactor Construction Industry Revenue (Million) Forecast, by Application 2019 & 2032
- Table 16: Belgium Nuclear Reactor Construction Industry Revenue (Million) Forecast, by Application 2019 & 2032
- Table 17: Netherland Nuclear Reactor Construction Industry Revenue (Million) Forecast, by Application 2019 & 2032
- Table 18: Nordics Nuclear Reactor Construction Industry Revenue (Million) Forecast, by Application 2019 & 2032
- Table 19: Rest of Europe Nuclear Reactor Construction Industry Revenue (Million) Forecast, by Application 2019 & 2032
- Table 20: Global Nuclear Reactor Construction Industry Revenue Million Forecast, by Country 2019 & 2032
- Table 21: China Nuclear Reactor Construction Industry Revenue (Million) Forecast, by Application 2019 & 2032
- Table 22: Japan Nuclear Reactor Construction Industry Revenue (Million) Forecast, by Application 2019 & 2032
- Table 23: India Nuclear Reactor Construction Industry Revenue (Million) Forecast, by Application 2019 & 2032
- Table 24: South Korea Nuclear Reactor Construction Industry Revenue (Million) Forecast, by Application 2019 & 2032
- Table 25: Southeast Asia Nuclear Reactor Construction Industry Revenue (Million) Forecast, by Application 2019 & 2032
- Table 26: Australia Nuclear Reactor Construction Industry Revenue (Million) Forecast, by Application 2019 & 2032
- Table 27: Indonesia Nuclear Reactor Construction Industry Revenue (Million) Forecast, by Application 2019 & 2032
- Table 28: Phillipes Nuclear Reactor Construction Industry Revenue (Million) Forecast, by Application 2019 & 2032
- Table 29: Singapore Nuclear Reactor Construction Industry Revenue (Million) Forecast, by Application 2019 & 2032
- Table 30: Thailandc Nuclear Reactor Construction Industry Revenue (Million) Forecast, by Application 2019 & 2032
- Table 31: Rest of Asia Pacific Nuclear Reactor Construction Industry Revenue (Million) Forecast, by Application 2019 & 2032
- Table 32: Global Nuclear Reactor Construction Industry Revenue Million Forecast, by Country 2019 & 2032
- Table 33: Brazil Nuclear Reactor Construction Industry Revenue (Million) Forecast, by Application 2019 & 2032
- Table 34: Argentina Nuclear Reactor Construction Industry Revenue (Million) Forecast, by Application 2019 & 2032
- Table 35: Peru Nuclear Reactor Construction Industry Revenue (Million) Forecast, by Application 2019 & 2032
- Table 36: Chile Nuclear Reactor Construction Industry Revenue (Million) Forecast, by Application 2019 & 2032
- Table 37: Colombia Nuclear Reactor Construction Industry Revenue (Million) Forecast, by Application 2019 & 2032
- Table 38: Ecuador Nuclear Reactor Construction Industry Revenue (Million) Forecast, by Application 2019 & 2032
- Table 39: Venezuela Nuclear Reactor Construction Industry Revenue (Million) Forecast, by Application 2019 & 2032
- Table 40: Rest of South America Nuclear Reactor Construction Industry Revenue (Million) Forecast, by Application 2019 & 2032
- Table 41: Global Nuclear Reactor Construction Industry Revenue Million Forecast, by Country 2019 & 2032
- Table 42: United States Nuclear Reactor Construction Industry Revenue (Million) Forecast, by Application 2019 & 2032
- Table 43: Canada Nuclear Reactor Construction Industry Revenue (Million) Forecast, by Application 2019 & 2032
- Table 44: Mexico Nuclear Reactor Construction Industry Revenue (Million) Forecast, by Application 2019 & 2032
- Table 45: Global Nuclear Reactor Construction Industry Revenue Million Forecast, by Country 2019 & 2032
- Table 46: United Arab Emirates Nuclear Reactor Construction Industry Revenue (Million) Forecast, by Application 2019 & 2032
- Table 47: Saudi Arabia Nuclear Reactor Construction Industry Revenue (Million) Forecast, by Application 2019 & 2032
- Table 48: South Africa Nuclear Reactor Construction Industry Revenue (Million) Forecast, by Application 2019 & 2032
- Table 49: Rest of Middle East and Africa Nuclear Reactor Construction Industry Revenue (Million) Forecast, by Application 2019 & 2032
- Table 50: Global Nuclear Reactor Construction Industry Revenue Million Forecast, by Service 2019 & 2032
- Table 51: Global Nuclear Reactor Construction Industry Revenue Million Forecast, by Reactor Type 2019 & 2032
- Table 52: Global Nuclear Reactor Construction Industry Revenue Million Forecast, by Country 2019 & 2032
- Table 53: Global Nuclear Reactor Construction Industry Revenue Million Forecast, by Service 2019 & 2032
- Table 54: Global Nuclear Reactor Construction Industry Revenue Million Forecast, by Reactor Type 2019 & 2032
- Table 55: Global Nuclear Reactor Construction Industry Revenue Million Forecast, by Country 2019 & 2032
- Table 56: Global Nuclear Reactor Construction Industry Revenue Million Forecast, by Service 2019 & 2032
- Table 57: Global Nuclear Reactor Construction Industry Revenue Million Forecast, by Reactor Type 2019 & 2032
- Table 58: Global Nuclear Reactor Construction Industry Revenue Million Forecast, by Country 2019 & 2032
- Table 59: Global Nuclear Reactor Construction Industry Revenue Million Forecast, by Service 2019 & 2032
- Table 60: Global Nuclear Reactor Construction Industry Revenue Million Forecast, by Reactor Type 2019 & 2032
- Table 61: Global Nuclear Reactor Construction Industry Revenue Million Forecast, by Country 2019 & 2032
- Table 62: Global Nuclear Reactor Construction Industry Revenue Million Forecast, by Service 2019 & 2032
- Table 63: Global Nuclear Reactor Construction Industry Revenue Million Forecast, by Reactor Type 2019 & 2032
- Table 64: Global Nuclear Reactor Construction Industry Revenue Million Forecast, by Country 2019 & 2032
Frequently Asked Questions
1. What is the projected Compound Annual Growth Rate (CAGR) of the Nuclear Reactor Construction Industry?
The projected CAGR is approximately > 1.95%.
2. Which companies are prominent players in the Nuclear Reactor Construction Industry?
Key companies in the market include Dongfang Electric Corporation Limited, SKODA JS a s, Larsen & Toubro Limited, Bilfinger SE, Doosan Corporation, China National Nuclear Corporation, Shanghai Electric Group Company Limited, KEPCO Engineering & Construction, Westinghouse Electric Company LLC (Toshiba), Rosatom Corp*List Not Exhaustive, Mitsubishi Heavy Industries Ltd, GE-Hitachi Nuclear Energy Inc.
3. What are the main segments of the Nuclear Reactor Construction Industry?
The market segments include Service, Reactor Type.
4. Can you provide details about the market size?
The market size is estimated to be USD XX Million as of 2022.
5. What are some drivers contributing to market growth?
4.; Rising Demand for Reliable Electricity4.; Increasing Government Support for Hydropower Gneeration.
6. What are the notable trends driving market growth?
Pressurized Water Reactor to Dominate the Market.
7. Are there any restraints impacting market growth?
4.; Negative Environmental Consequences of Hydropower Projects.
8. Can you provide examples of recent developments in the market?
October 2022: The United States and Japan announced a partnership with Ghana at the International Atomic Energy Agency Nuclear Power Ministerial Conference in Washington, DC, to support its goal of leading Africa to deploy small modular reactors. Since Ghana's nuclear power program is currently technology neutral, the collaboration will facilitate the deployment of Small Modular Reactor (SMR) technology in Ghana.
9. What pricing options are available for accessing the report?
Pricing options include single-user, multi-user, and enterprise licenses priced at USD 4750, USD 5250, and USD 8750 respectively.
10. Is the market size provided in terms of value or volume?
The market size is provided in terms of value, measured in Million.
11. Are there any specific market keywords associated with the report?
Yes, the market keyword associated with the report is "Nuclear Reactor Construction Industry," which aids in identifying and referencing the specific market segment covered.
12. How do I determine which pricing option suits my needs best?
The pricing options vary based on user requirements and access needs. Individual users may opt for single-user licenses, while businesses requiring broader access may choose multi-user or enterprise licenses for cost-effective access to the report.
13. Are there any additional resources or data provided in the Nuclear Reactor Construction Industry report?
While the report offers comprehensive insights, it's advisable to review the specific contents or supplementary materials provided to ascertain if additional resources or data are available.
14. How can I stay updated on further developments or reports in the Nuclear Reactor Construction Industry?
To stay informed about further developments, trends, and reports in the Nuclear Reactor Construction Industry, consider subscribing to industry newsletters, following relevant companies and organizations, or regularly checking reputable industry news sources and publications.
Methodology
Step 1 - Identification of Relevant Samples Size from Population Database


Step 2 - Approaches for Defining Global Market Size (Value, Volume* & Price*)

Note*: In applicable scenarios
Step 3 - Data Sources
Primary Research
- Web Analytics
- Survey Reports
- Research Institute
- Latest Research Reports
- Opinion Leaders
Secondary Research
- Annual Reports
- White Paper
- Latest Press Release
- Industry Association
- Paid Database
- Investor Presentations

Step 4 - Data Triangulation
Involves using different sources of information in order to increase the validity of a study
These sources are likely to be stakeholders in a program - participants, other researchers, program staff, other community members, and so on.
Then we put all data in single framework & apply various statistical tools to find out the dynamic on the market.
During the analysis stage, feedback from the stakeholder groups would be compared to determine areas of agreement as well as areas of divergence
