

Key Insights
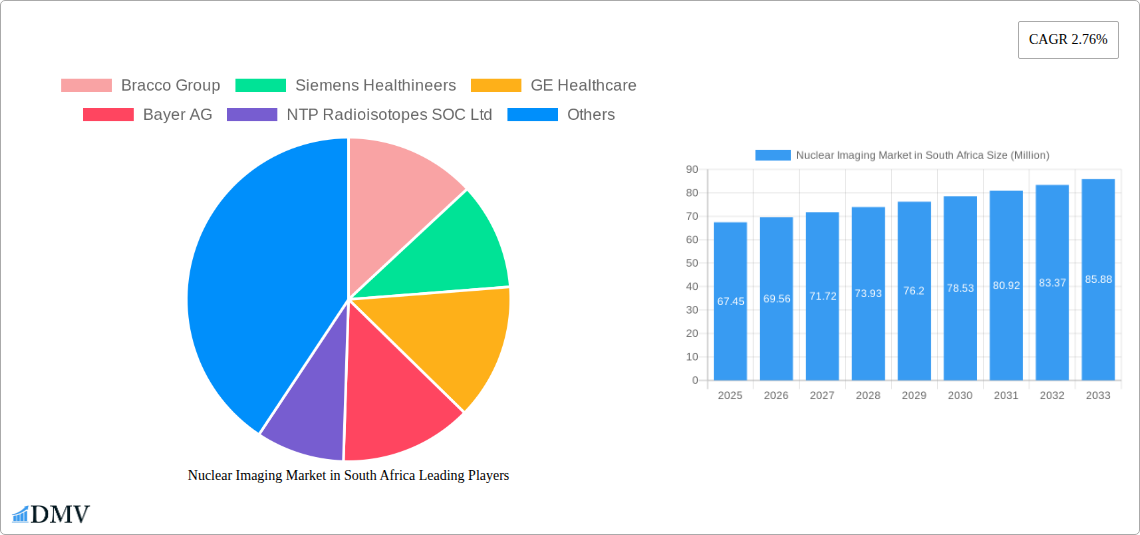
The South African nuclear imaging market, valued at approximately $67.45 million in 2025, is projected to experience steady growth driven by increasing prevalence of chronic diseases like cancer, cardiovascular diseases, and neurological disorders requiring accurate diagnosis. Technological advancements in SPECT and PET imaging, leading to improved image quality, faster scan times, and reduced radiation exposure, are further fueling market expansion. The demand for sophisticated diagnostic tools is also boosted by government initiatives promoting healthcare infrastructure development and increased healthcare expenditure. However, the market faces challenges including high equipment costs, limited skilled professionals, and the need for robust regulatory frameworks to ensure safe and effective radioisotope handling. The market segmentation shows a significant share held by equipment sales, followed by diagnostic radioisotopes. SPECT applications currently dominate, but PET applications are witnessing substantial growth due to their superior diagnostic capabilities. Key players like Bracco Group, Siemens Healthineers, and GE Healthcare are actively competing to capture market share, focusing on strategic partnerships, technology advancements, and distribution network expansion.
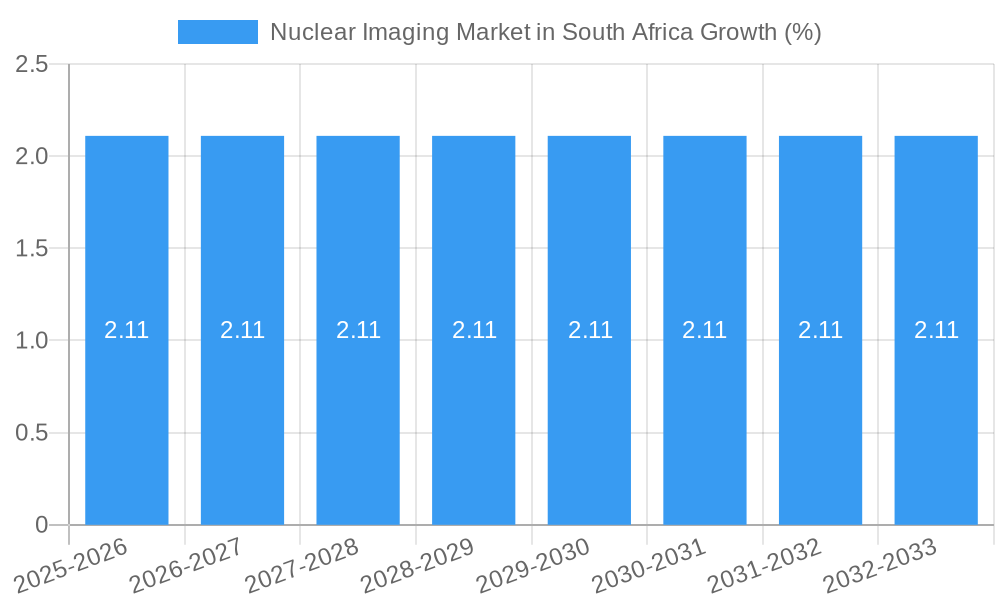
Within the South African context, the market's growth is intertwined with the nation's broader healthcare investments and improvements in diagnostic capabilities. The increasing prevalence of diseases necessitating nuclear imaging, combined with a growing awareness among healthcare professionals and patients regarding the benefits of these advanced imaging techniques, are driving market expansion. Furthermore, the involvement of international players in the market contributes to the availability of sophisticated equipment and expertise, although challenges remain regarding accessibility and affordability for a large segment of the population. Future growth will likely depend on successful strategies addressing affordability concerns, bolstering healthcare infrastructure, and fostering professional training to ensure sustainable market expansion in the long term. The forecast period (2025-2033) suggests a sustained, albeit modest, growth trajectory reflecting the interplay of market drivers and restraints.
Nuclear Imaging Market in South Africa: A Comprehensive Report (2019-2033)
This insightful report provides a detailed analysis of the Nuclear Imaging Market in South Africa, covering the period 2019-2033, with a focus on market trends, competitive landscape, and future growth prospects. The study incorporates extensive market research, leveraging data from 2019-2024 (historical period) and projecting market trends until 2033 (forecast period), with 2025 serving as the base and estimated year. The report is invaluable for stakeholders including manufacturers, distributors, healthcare providers, and investors seeking to understand this dynamic market.
Nuclear Imaging Market in South Africa Market Composition & Trends
This section delves into the intricate structure of South Africa's nuclear imaging market. We analyze market concentration, revealing the market share distribution amongst key players like Bracco Group, Siemens Healthineers, GE Healthcare, and Bayer AG, along with local players such as NTP Radioisotopes SOC Ltd. The report also examines innovation drivers, such as the increasing adoption of advanced imaging technologies like PET and SPECT, and regulatory influences impacting market access and reimbursement policies. Further, the analysis considers the presence and influence of substitute products, end-user profiles across various healthcare settings (hospitals, clinics, research facilities), and the impact of mergers and acquisitions (M&A) activities on market dynamics. We provide quantitative data on M&A deal values (xx Million) and their influence on market concentration during the historical period. The competitive landscape is dissected using Porter’s Five Forces to determine the intensity of rivalry and industry attractiveness.
- Market Share Distribution: Siemens Healthineers (xx%), GE Healthcare (xx%), Bracco Group (xx%), Others (xx%).
- M&A Activity: Analysis of deal values and their impact on market consolidation (xx Million in total deal value during 2019-2024).
- Regulatory Landscape: Detailed overview of relevant regulations and their impact on market growth.
Nuclear Imaging Market in South Africa Industry Evolution
This section offers a comprehensive analysis of the South African nuclear imaging market's evolutionary path from 2019 to 2033. We explore growth trajectories, pinpointing compound annual growth rates (CAGR) for both the historical and forecast periods (Historical CAGR: xx%, Forecast CAGR: xx%). Technological advancements like the introduction of hybrid imaging systems and improved radiotracers are critically examined, along with their impact on market adoption rates. The evolution of consumer demands, driven by factors such as improved diagnostic accuracy and minimally invasive procedures, is also analyzed. The influence of government initiatives aimed at improving healthcare infrastructure and access to advanced medical technologies is also considered, highlighting the interplay between technological advancements, shifting consumer preferences, and governmental policies in shaping the market's trajectory. We examine the impact of the COVID-19 pandemic on market growth, as well as the recovery and subsequent growth projections.
Leading Regions, Countries, or Segments in Nuclear Imaging Market in South Africa
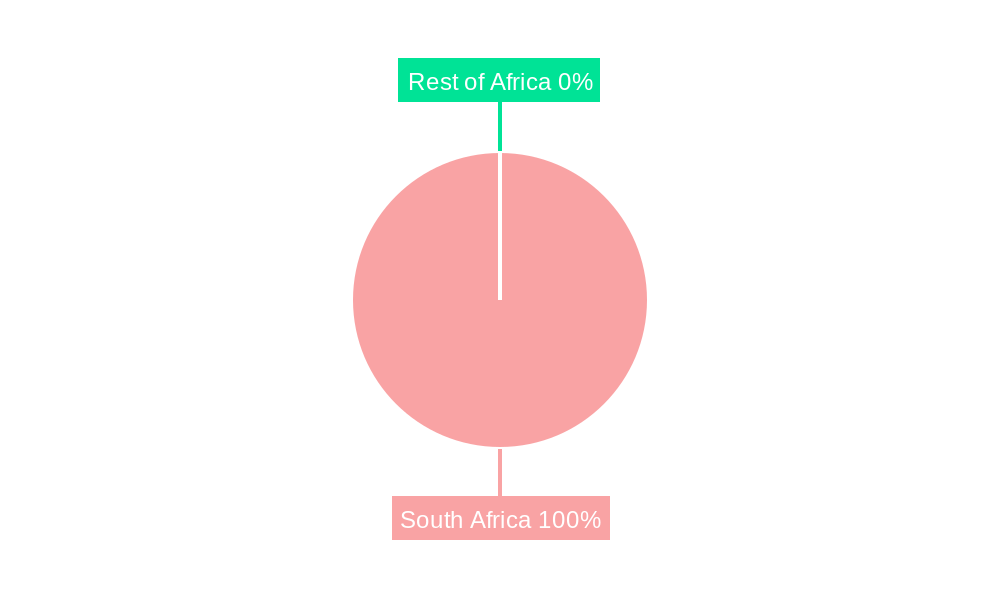
This section identifies the dominant regions, countries, or segments within the South African nuclear imaging market. While South Africa is a single country, regional variations in market performance are considered based on healthcare infrastructure and economic development levels. The analysis includes a detailed breakdown of the market by product type (Equipment, Diagnostic Radioisotope) and application (SPECT Applications, PET Applications, Other SPECT Applications). The dominant segment is analyzed in detail to identify key success factors.
- Dominant Segment: Equipment (xx% market share), driven by increasing demand for advanced imaging systems.
- Key Drivers (Equipment Segment):
- Increasing government investment in healthcare infrastructure.
- Rising prevalence of chronic diseases necessitating advanced diagnostic tools.
- Technological advancements leading to improved image quality and reduced radiation exposure.
- Key Drivers (Diagnostic Radioisotope Segment):
- Growing demand for accurate and timely diagnosis of various diseases.
- Increased availability and affordability of radioisotopes.
- Advancements in radiopharmaceutical development.
Nuclear Imaging Market in South Africa Product Innovations
This section highlights recent product innovations in the South African nuclear imaging market, focusing on improvements in equipment design, radiotracer development, and data analysis capabilities. Specific examples of novel technologies, their unique selling propositions (USPs), and associated performance metrics (e.g., improved image resolution, reduced scan times) are provided. The impact of these innovations on improving diagnostic accuracy and patient care is also emphasized.
Propelling Factors for Nuclear Imaging Market in South Africa Growth
Several factors are driving growth in the South African nuclear imaging market. Technological advancements, particularly in PET/CT and SPECT/CT hybrid systems, provide enhanced diagnostic capabilities. Economic growth and increased healthcare expenditure create a favorable environment for market expansion. Furthermore, supportive government policies and initiatives aimed at improving healthcare access and infrastructure are significant catalysts.
Obstacles in the Nuclear Imaging Market in South Africa Market
Despite the positive outlook, challenges hinder market growth. Regulatory hurdles related to licensing and reimbursement policies can create delays in market entry for new technologies. Supply chain disruptions, particularly concerning the availability of radioisotopes, impact market stability. Furthermore, intensifying competition among established players limits profitability and necessitates continuous innovation for survival. The high cost of equipment and procedures also restricts market access, particularly in underserved communities.
Future Opportunities in Nuclear Imaging Market in South Africa
The South African nuclear imaging market presents several promising opportunities. Expansion into underserved areas with increased access to quality care is a key potential growth driver. Advancements in molecular imaging and personalized medicine offer further opportunities for market expansion. Finally, collaboration between public and private sectors can improve market access and encourage technology adoption.
Major Players in the Nuclear Imaging Market in South Africa Ecosystem
- Bracco Group
- Siemens Healthineers [Siemens Healthineers]
- GE Healthcare [GE Healthcare]
- Bayer AG [Bayer AG]
- NTP Radioisotopes SOC Ltd
- Koninklijke Philips NV [Koninklijke Philips NV]
- Klydon
- Canon Medical Systems Corporation [Canon Medical Systems Corporation]
- Curium [Curium]
- Fujifilm Holdings Corporation [Fujifilm Holdings Corporation]
Key Developments in Nuclear Imaging Market in South Africa Industry
- November 2021: Life Healthcare Group and AXIM Group formed a joint venture to establish a cyclotron-based radiopharmacy business in South and Southern Africa. This significantly enhances access to radioisotopes and potentially accelerates market growth.
- May 2021: Partnership between GE Healthcare, NSIA, Banque Côte d'Ivoire, and IFC's Africa Medical Equipment Facility to provide essential medical equipment, including potentially nuclear imaging equipment, in the region. This demonstrates increasing private-public partnerships aimed at improving healthcare infrastructure.
Strategic Nuclear Imaging Market in South Africa Market Forecast
The South African nuclear imaging market is poised for substantial growth over the forecast period (2025-2033). Continued technological advancements, increasing government investment in healthcare, and a growing prevalence of chronic diseases will drive demand for advanced imaging technologies. Opportunities lie in expanding market access to underserved areas, promoting adoption of innovative technologies, and fostering public-private partnerships. The market’s long-term growth trajectory is expected to remain positive, with a significant increase in market value by 2033 (xx Million).
Nuclear Imaging Market in South Africa Segmentation
-
1. Product
- 1.1. Equipment
-
1.2. Diagnostic Radioisotope
- 1.2.1. SPECT Radioisotopes
- 1.2.2. PET Radioisotopes
-
2. Application
-
2.1. SPECT Applications
- 2.1.1. Cardiology
- 2.1.2. Neurology
- 2.1.3. Thyroid
- 2.1.4. Other SPECT Applications
-
2.2. PET Applications
- 2.2.1. Oncology
- 2.2.2. Other PET Applications
-
2.1. SPECT Applications
Nuclear Imaging Market in South Africa Segmentation By Geography
-
1. North America
- 1.1. United States
- 1.2. Canada
- 1.3. Mexico
-
2. South America
- 2.1. Brazil
- 2.2. Argentina
- 2.3. Rest of South America
-
3. Europe
- 3.1. United Kingdom
- 3.2. Germany
- 3.3. France
- 3.4. Italy
- 3.5. Spain
- 3.6. Russia
- 3.7. Benelux
- 3.8. Nordics
- 3.9. Rest of Europe
-
4. Middle East & Africa
- 4.1. Turkey
- 4.2. Israel
- 4.3. GCC
- 4.4. North Africa
- 4.5. South Africa
- 4.6. Rest of Middle East & Africa
-
5. Asia Pacific
- 5.1. China
- 5.2. India
- 5.3. Japan
- 5.4. South Korea
- 5.5. ASEAN
- 5.6. Oceania
- 5.7. Rest of Asia Pacific
Nuclear Imaging Market in South Africa REPORT HIGHLIGHTS
| Aspects | Details |
|---|---|
| Study Period | 2019-2033 |
| Base Year | 2024 |
| Estimated Year | 2025 |
| Forecast Period | 2025-2033 |
| Historical Period | 2019-2024 |
| Growth Rate | CAGR of 2.76% from 2019-2033 |
| Segmentation |
|
Table of Contents
- 1. Introduction
- 1.1. Research Scope
- 1.2. Market Segmentation
- 1.3. Research Methodology
- 1.4. Definitions and Assumptions
- 2. Executive Summary
- 2.1. Introduction
- 3. Market Dynamics
- 3.1. Introduction
- 3.2. Market Drivers
- 3.2.1. Increasing Prevalence of Cancer and Cardiac Disorders; Technological Advancements in Nuclear Imaging
- 3.3. Market Restrains
- 3.3.1. Stringent Regulations
- 3.4. Market Trends
- 3.4.1. SPECT Radioisotopes are Expected to Witness Strong Growth Over the Forecast Period
- 4. Market Factor Analysis
- 4.1. Porters Five Forces
- 4.2. Supply/Value Chain
- 4.3. PESTEL analysis
- 4.4. Market Entropy
- 4.5. Patent/Trademark Analysis
- 5. Global Nuclear Imaging Market in South Africa Analysis, Insights and Forecast, 2019-2031
- 5.1. Market Analysis, Insights and Forecast - by Product
- 5.1.1. Equipment
- 5.1.2. Diagnostic Radioisotope
- 5.1.2.1. SPECT Radioisotopes
- 5.1.2.2. PET Radioisotopes
- 5.2. Market Analysis, Insights and Forecast - by Application
- 5.2.1. SPECT Applications
- 5.2.1.1. Cardiology
- 5.2.1.2. Neurology
- 5.2.1.3. Thyroid
- 5.2.1.4. Other SPECT Applications
- 5.2.2. PET Applications
- 5.2.2.1. Oncology
- 5.2.2.2. Other PET Applications
- 5.2.1. SPECT Applications
- 5.3. Market Analysis, Insights and Forecast - by Region
- 5.3.1. North America
- 5.3.2. South America
- 5.3.3. Europe
- 5.3.4. Middle East & Africa
- 5.3.5. Asia Pacific
- 5.1. Market Analysis, Insights and Forecast - by Product
- 6. North America Nuclear Imaging Market in South Africa Analysis, Insights and Forecast, 2019-2031
- 6.1. Market Analysis, Insights and Forecast - by Product
- 6.1.1. Equipment
- 6.1.2. Diagnostic Radioisotope
- 6.1.2.1. SPECT Radioisotopes
- 6.1.2.2. PET Radioisotopes
- 6.2. Market Analysis, Insights and Forecast - by Application
- 6.2.1. SPECT Applications
- 6.2.1.1. Cardiology
- 6.2.1.2. Neurology
- 6.2.1.3. Thyroid
- 6.2.1.4. Other SPECT Applications
- 6.2.2. PET Applications
- 6.2.2.1. Oncology
- 6.2.2.2. Other PET Applications
- 6.2.1. SPECT Applications
- 6.1. Market Analysis, Insights and Forecast - by Product
- 7. South America Nuclear Imaging Market in South Africa Analysis, Insights and Forecast, 2019-2031
- 7.1. Market Analysis, Insights and Forecast - by Product
- 7.1.1. Equipment
- 7.1.2. Diagnostic Radioisotope
- 7.1.2.1. SPECT Radioisotopes
- 7.1.2.2. PET Radioisotopes
- 7.2. Market Analysis, Insights and Forecast - by Application
- 7.2.1. SPECT Applications
- 7.2.1.1. Cardiology
- 7.2.1.2. Neurology
- 7.2.1.3. Thyroid
- 7.2.1.4. Other SPECT Applications
- 7.2.2. PET Applications
- 7.2.2.1. Oncology
- 7.2.2.2. Other PET Applications
- 7.2.1. SPECT Applications
- 7.1. Market Analysis, Insights and Forecast - by Product
- 8. Europe Nuclear Imaging Market in South Africa Analysis, Insights and Forecast, 2019-2031
- 8.1. Market Analysis, Insights and Forecast - by Product
- 8.1.1. Equipment
- 8.1.2. Diagnostic Radioisotope
- 8.1.2.1. SPECT Radioisotopes
- 8.1.2.2. PET Radioisotopes
- 8.2. Market Analysis, Insights and Forecast - by Application
- 8.2.1. SPECT Applications
- 8.2.1.1. Cardiology
- 8.2.1.2. Neurology
- 8.2.1.3. Thyroid
- 8.2.1.4. Other SPECT Applications
- 8.2.2. PET Applications
- 8.2.2.1. Oncology
- 8.2.2.2. Other PET Applications
- 8.2.1. SPECT Applications
- 8.1. Market Analysis, Insights and Forecast - by Product
- 9. Middle East & Africa Nuclear Imaging Market in South Africa Analysis, Insights and Forecast, 2019-2031
- 9.1. Market Analysis, Insights and Forecast - by Product
- 9.1.1. Equipment
- 9.1.2. Diagnostic Radioisotope
- 9.1.2.1. SPECT Radioisotopes
- 9.1.2.2. PET Radioisotopes
- 9.2. Market Analysis, Insights and Forecast - by Application
- 9.2.1. SPECT Applications
- 9.2.1.1. Cardiology
- 9.2.1.2. Neurology
- 9.2.1.3. Thyroid
- 9.2.1.4. Other SPECT Applications
- 9.2.2. PET Applications
- 9.2.2.1. Oncology
- 9.2.2.2. Other PET Applications
- 9.2.1. SPECT Applications
- 9.1. Market Analysis, Insights and Forecast - by Product
- 10. Asia Pacific Nuclear Imaging Market in South Africa Analysis, Insights and Forecast, 2019-2031
- 10.1. Market Analysis, Insights and Forecast - by Product
- 10.1.1. Equipment
- 10.1.2. Diagnostic Radioisotope
- 10.1.2.1. SPECT Radioisotopes
- 10.1.2.2. PET Radioisotopes
- 10.2. Market Analysis, Insights and Forecast - by Application
- 10.2.1. SPECT Applications
- 10.2.1.1. Cardiology
- 10.2.1.2. Neurology
- 10.2.1.3. Thyroid
- 10.2.1.4. Other SPECT Applications
- 10.2.2. PET Applications
- 10.2.2.1. Oncology
- 10.2.2.2. Other PET Applications
- 10.2.1. SPECT Applications
- 10.1. Market Analysis, Insights and Forecast - by Product
- 11. South Africa Nuclear Imaging Market in South Africa Analysis, Insights and Forecast, 2019-2031
- 12. Sudan Nuclear Imaging Market in South Africa Analysis, Insights and Forecast, 2019-2031
- 13. Uganda Nuclear Imaging Market in South Africa Analysis, Insights and Forecast, 2019-2031
- 14. Tanzania Nuclear Imaging Market in South Africa Analysis, Insights and Forecast, 2019-2031
- 15. Kenya Nuclear Imaging Market in South Africa Analysis, Insights and Forecast, 2019-2031
- 16. Rest of Africa Nuclear Imaging Market in South Africa Analysis, Insights and Forecast, 2019-2031
- 17. Competitive Analysis
- 17.1. Global Market Share Analysis 2024
- 17.2. Company Profiles
- 17.2.1 Bracco Group
- 17.2.1.1. Overview
- 17.2.1.2. Products
- 17.2.1.3. SWOT Analysis
- 17.2.1.4. Recent Developments
- 17.2.1.5. Financials (Based on Availability)
- 17.2.2 Siemens Healthineers
- 17.2.2.1. Overview
- 17.2.2.2. Products
- 17.2.2.3. SWOT Analysis
- 17.2.2.4. Recent Developments
- 17.2.2.5. Financials (Based on Availability)
- 17.2.3 GE Healthcare
- 17.2.3.1. Overview
- 17.2.3.2. Products
- 17.2.3.3. SWOT Analysis
- 17.2.3.4. Recent Developments
- 17.2.3.5. Financials (Based on Availability)
- 17.2.4 Bayer AG
- 17.2.4.1. Overview
- 17.2.4.2. Products
- 17.2.4.3. SWOT Analysis
- 17.2.4.4. Recent Developments
- 17.2.4.5. Financials (Based on Availability)
- 17.2.5 NTP Radioisotopes SOC Ltd
- 17.2.5.1. Overview
- 17.2.5.2. Products
- 17.2.5.3. SWOT Analysis
- 17.2.5.4. Recent Developments
- 17.2.5.5. Financials (Based on Availability)
- 17.2.6 Koninklijke Philips NV
- 17.2.6.1. Overview
- 17.2.6.2. Products
- 17.2.6.3. SWOT Analysis
- 17.2.6.4. Recent Developments
- 17.2.6.5. Financials (Based on Availability)
- 17.2.7 Klydon
- 17.2.7.1. Overview
- 17.2.7.2. Products
- 17.2.7.3. SWOT Analysis
- 17.2.7.4. Recent Developments
- 17.2.7.5. Financials (Based on Availability)
- 17.2.8 Canon Medical Systems Corporation
- 17.2.8.1. Overview
- 17.2.8.2. Products
- 17.2.8.3. SWOT Analysis
- 17.2.8.4. Recent Developments
- 17.2.8.5. Financials (Based on Availability)
- 17.2.9 Curium
- 17.2.9.1. Overview
- 17.2.9.2. Products
- 17.2.9.3. SWOT Analysis
- 17.2.9.4. Recent Developments
- 17.2.9.5. Financials (Based on Availability)
- 17.2.10 Fujifilm Holdings Corporation
- 17.2.10.1. Overview
- 17.2.10.2. Products
- 17.2.10.3. SWOT Analysis
- 17.2.10.4. Recent Developments
- 17.2.10.5. Financials (Based on Availability)
- 17.2.1 Bracco Group
List of Figures
- Figure 1: Global Nuclear Imaging Market in South Africa Revenue Breakdown (Million, %) by Region 2024 & 2032
- Figure 2: Africa Nuclear Imaging Market in South Africa Revenue (Million), by Country 2024 & 2032
- Figure 3: Africa Nuclear Imaging Market in South Africa Revenue Share (%), by Country 2024 & 2032
- Figure 4: North America Nuclear Imaging Market in South Africa Revenue (Million), by Product 2024 & 2032
- Figure 5: North America Nuclear Imaging Market in South Africa Revenue Share (%), by Product 2024 & 2032
- Figure 6: North America Nuclear Imaging Market in South Africa Revenue (Million), by Application 2024 & 2032
- Figure 7: North America Nuclear Imaging Market in South Africa Revenue Share (%), by Application 2024 & 2032
- Figure 8: North America Nuclear Imaging Market in South Africa Revenue (Million), by Country 2024 & 2032
- Figure 9: North America Nuclear Imaging Market in South Africa Revenue Share (%), by Country 2024 & 2032
- Figure 10: South America Nuclear Imaging Market in South Africa Revenue (Million), by Product 2024 & 2032
- Figure 11: South America Nuclear Imaging Market in South Africa Revenue Share (%), by Product 2024 & 2032
- Figure 12: South America Nuclear Imaging Market in South Africa Revenue (Million), by Application 2024 & 2032
- Figure 13: South America Nuclear Imaging Market in South Africa Revenue Share (%), by Application 2024 & 2032
- Figure 14: South America Nuclear Imaging Market in South Africa Revenue (Million), by Country 2024 & 2032
- Figure 15: South America Nuclear Imaging Market in South Africa Revenue Share (%), by Country 2024 & 2032
- Figure 16: Europe Nuclear Imaging Market in South Africa Revenue (Million), by Product 2024 & 2032
- Figure 17: Europe Nuclear Imaging Market in South Africa Revenue Share (%), by Product 2024 & 2032
- Figure 18: Europe Nuclear Imaging Market in South Africa Revenue (Million), by Application 2024 & 2032
- Figure 19: Europe Nuclear Imaging Market in South Africa Revenue Share (%), by Application 2024 & 2032
- Figure 20: Europe Nuclear Imaging Market in South Africa Revenue (Million), by Country 2024 & 2032
- Figure 21: Europe Nuclear Imaging Market in South Africa Revenue Share (%), by Country 2024 & 2032
- Figure 22: Middle East & Africa Nuclear Imaging Market in South Africa Revenue (Million), by Product 2024 & 2032
- Figure 23: Middle East & Africa Nuclear Imaging Market in South Africa Revenue Share (%), by Product 2024 & 2032
- Figure 24: Middle East & Africa Nuclear Imaging Market in South Africa Revenue (Million), by Application 2024 & 2032
- Figure 25: Middle East & Africa Nuclear Imaging Market in South Africa Revenue Share (%), by Application 2024 & 2032
- Figure 26: Middle East & Africa Nuclear Imaging Market in South Africa Revenue (Million), by Country 2024 & 2032
- Figure 27: Middle East & Africa Nuclear Imaging Market in South Africa Revenue Share (%), by Country 2024 & 2032
- Figure 28: Asia Pacific Nuclear Imaging Market in South Africa Revenue (Million), by Product 2024 & 2032
- Figure 29: Asia Pacific Nuclear Imaging Market in South Africa Revenue Share (%), by Product 2024 & 2032
- Figure 30: Asia Pacific Nuclear Imaging Market in South Africa Revenue (Million), by Application 2024 & 2032
- Figure 31: Asia Pacific Nuclear Imaging Market in South Africa Revenue Share (%), by Application 2024 & 2032
- Figure 32: Asia Pacific Nuclear Imaging Market in South Africa Revenue (Million), by Country 2024 & 2032
- Figure 33: Asia Pacific Nuclear Imaging Market in South Africa Revenue Share (%), by Country 2024 & 2032
List of Tables
- Table 1: Global Nuclear Imaging Market in South Africa Revenue Million Forecast, by Region 2019 & 2032
- Table 2: Global Nuclear Imaging Market in South Africa Revenue Million Forecast, by Product 2019 & 2032
- Table 3: Global Nuclear Imaging Market in South Africa Revenue Million Forecast, by Application 2019 & 2032
- Table 4: Global Nuclear Imaging Market in South Africa Revenue Million Forecast, by Region 2019 & 2032
- Table 5: Global Nuclear Imaging Market in South Africa Revenue Million Forecast, by Country 2019 & 2032
- Table 6: South Africa Nuclear Imaging Market in South Africa Revenue (Million) Forecast, by Application 2019 & 2032
- Table 7: Sudan Nuclear Imaging Market in South Africa Revenue (Million) Forecast, by Application 2019 & 2032
- Table 8: Uganda Nuclear Imaging Market in South Africa Revenue (Million) Forecast, by Application 2019 & 2032
- Table 9: Tanzania Nuclear Imaging Market in South Africa Revenue (Million) Forecast, by Application 2019 & 2032
- Table 10: Kenya Nuclear Imaging Market in South Africa Revenue (Million) Forecast, by Application 2019 & 2032
- Table 11: Rest of Africa Nuclear Imaging Market in South Africa Revenue (Million) Forecast, by Application 2019 & 2032
- Table 12: Global Nuclear Imaging Market in South Africa Revenue Million Forecast, by Product 2019 & 2032
- Table 13: Global Nuclear Imaging Market in South Africa Revenue Million Forecast, by Application 2019 & 2032
- Table 14: Global Nuclear Imaging Market in South Africa Revenue Million Forecast, by Country 2019 & 2032
- Table 15: United States Nuclear Imaging Market in South Africa Revenue (Million) Forecast, by Application 2019 & 2032
- Table 16: Canada Nuclear Imaging Market in South Africa Revenue (Million) Forecast, by Application 2019 & 2032
- Table 17: Mexico Nuclear Imaging Market in South Africa Revenue (Million) Forecast, by Application 2019 & 2032
- Table 18: Global Nuclear Imaging Market in South Africa Revenue Million Forecast, by Product 2019 & 2032
- Table 19: Global Nuclear Imaging Market in South Africa Revenue Million Forecast, by Application 2019 & 2032
- Table 20: Global Nuclear Imaging Market in South Africa Revenue Million Forecast, by Country 2019 & 2032
- Table 21: Brazil Nuclear Imaging Market in South Africa Revenue (Million) Forecast, by Application 2019 & 2032
- Table 22: Argentina Nuclear Imaging Market in South Africa Revenue (Million) Forecast, by Application 2019 & 2032
- Table 23: Rest of South America Nuclear Imaging Market in South Africa Revenue (Million) Forecast, by Application 2019 & 2032
- Table 24: Global Nuclear Imaging Market in South Africa Revenue Million Forecast, by Product 2019 & 2032
- Table 25: Global Nuclear Imaging Market in South Africa Revenue Million Forecast, by Application 2019 & 2032
- Table 26: Global Nuclear Imaging Market in South Africa Revenue Million Forecast, by Country 2019 & 2032
- Table 27: United Kingdom Nuclear Imaging Market in South Africa Revenue (Million) Forecast, by Application 2019 & 2032
- Table 28: Germany Nuclear Imaging Market in South Africa Revenue (Million) Forecast, by Application 2019 & 2032
- Table 29: France Nuclear Imaging Market in South Africa Revenue (Million) Forecast, by Application 2019 & 2032
- Table 30: Italy Nuclear Imaging Market in South Africa Revenue (Million) Forecast, by Application 2019 & 2032
- Table 31: Spain Nuclear Imaging Market in South Africa Revenue (Million) Forecast, by Application 2019 & 2032
- Table 32: Russia Nuclear Imaging Market in South Africa Revenue (Million) Forecast, by Application 2019 & 2032
- Table 33: Benelux Nuclear Imaging Market in South Africa Revenue (Million) Forecast, by Application 2019 & 2032
- Table 34: Nordics Nuclear Imaging Market in South Africa Revenue (Million) Forecast, by Application 2019 & 2032
- Table 35: Rest of Europe Nuclear Imaging Market in South Africa Revenue (Million) Forecast, by Application 2019 & 2032
- Table 36: Global Nuclear Imaging Market in South Africa Revenue Million Forecast, by Product 2019 & 2032
- Table 37: Global Nuclear Imaging Market in South Africa Revenue Million Forecast, by Application 2019 & 2032
- Table 38: Global Nuclear Imaging Market in South Africa Revenue Million Forecast, by Country 2019 & 2032
- Table 39: Turkey Nuclear Imaging Market in South Africa Revenue (Million) Forecast, by Application 2019 & 2032
- Table 40: Israel Nuclear Imaging Market in South Africa Revenue (Million) Forecast, by Application 2019 & 2032
- Table 41: GCC Nuclear Imaging Market in South Africa Revenue (Million) Forecast, by Application 2019 & 2032
- Table 42: North Africa Nuclear Imaging Market in South Africa Revenue (Million) Forecast, by Application 2019 & 2032
- Table 43: South Africa Nuclear Imaging Market in South Africa Revenue (Million) Forecast, by Application 2019 & 2032
- Table 44: Rest of Middle East & Africa Nuclear Imaging Market in South Africa Revenue (Million) Forecast, by Application 2019 & 2032
- Table 45: Global Nuclear Imaging Market in South Africa Revenue Million Forecast, by Product 2019 & 2032
- Table 46: Global Nuclear Imaging Market in South Africa Revenue Million Forecast, by Application 2019 & 2032
- Table 47: Global Nuclear Imaging Market in South Africa Revenue Million Forecast, by Country 2019 & 2032
- Table 48: China Nuclear Imaging Market in South Africa Revenue (Million) Forecast, by Application 2019 & 2032
- Table 49: India Nuclear Imaging Market in South Africa Revenue (Million) Forecast, by Application 2019 & 2032
- Table 50: Japan Nuclear Imaging Market in South Africa Revenue (Million) Forecast, by Application 2019 & 2032
- Table 51: South Korea Nuclear Imaging Market in South Africa Revenue (Million) Forecast, by Application 2019 & 2032
- Table 52: ASEAN Nuclear Imaging Market in South Africa Revenue (Million) Forecast, by Application 2019 & 2032
- Table 53: Oceania Nuclear Imaging Market in South Africa Revenue (Million) Forecast, by Application 2019 & 2032
- Table 54: Rest of Asia Pacific Nuclear Imaging Market in South Africa Revenue (Million) Forecast, by Application 2019 & 2032
Frequently Asked Questions
1. What is the projected Compound Annual Growth Rate (CAGR) of the Nuclear Imaging Market in South Africa?
The projected CAGR is approximately 2.76%.
2. Which companies are prominent players in the Nuclear Imaging Market in South Africa?
Key companies in the market include Bracco Group, Siemens Healthineers, GE Healthcare, Bayer AG, NTP Radioisotopes SOC Ltd, Koninklijke Philips NV, Klydon, Canon Medical Systems Corporation, Curium, Fujifilm Holdings Corporation.
3. What are the main segments of the Nuclear Imaging Market in South Africa?
The market segments include Product, Application.
4. Can you provide details about the market size?
The market size is estimated to be USD 67.45 Million as of 2022.
5. What are some drivers contributing to market growth?
Increasing Prevalence of Cancer and Cardiac Disorders; Technological Advancements in Nuclear Imaging.
6. What are the notable trends driving market growth?
SPECT Radioisotopes are Expected to Witness Strong Growth Over the Forecast Period.
7. Are there any restraints impacting market growth?
Stringent Regulations.
8. Can you provide examples of recent developments in the market?
In November 2021, Life Healthcare Group, a healthcare organization in South Africa, and the AXIM Group of Companies, Sub-Saharan Africa's medical equipment, device, and consumable distributor, have signed a head of terms agreement to form a joint venture to establish a cyclotron based radiopharmacy business across South and Southern Africa.
9. What pricing options are available for accessing the report?
Pricing options include single-user, multi-user, and enterprise licenses priced at USD 3800, USD 4500, and USD 5800 respectively.
10. Is the market size provided in terms of value or volume?
The market size is provided in terms of value, measured in Million.
11. Are there any specific market keywords associated with the report?
Yes, the market keyword associated with the report is "Nuclear Imaging Market in South Africa," which aids in identifying and referencing the specific market segment covered.
12. How do I determine which pricing option suits my needs best?
The pricing options vary based on user requirements and access needs. Individual users may opt for single-user licenses, while businesses requiring broader access may choose multi-user or enterprise licenses for cost-effective access to the report.
13. Are there any additional resources or data provided in the Nuclear Imaging Market in South Africa report?
While the report offers comprehensive insights, it's advisable to review the specific contents or supplementary materials provided to ascertain if additional resources or data are available.
14. How can I stay updated on further developments or reports in the Nuclear Imaging Market in South Africa?
To stay informed about further developments, trends, and reports in the Nuclear Imaging Market in South Africa, consider subscribing to industry newsletters, following relevant companies and organizations, or regularly checking reputable industry news sources and publications.
Methodology
Step 1 - Identification of Relevant Samples Size from Population Database


Step 2 - Approaches for Defining Global Market Size (Value, Volume* & Price*)

Note*: In applicable scenarios
Step 3 - Data Sources
Primary Research
- Web Analytics
- Survey Reports
- Research Institute
- Latest Research Reports
- Opinion Leaders
Secondary Research
- Annual Reports
- White Paper
- Latest Press Release
- Industry Association
- Paid Database
- Investor Presentations

Step 4 - Data Triangulation
Involves using different sources of information in order to increase the validity of a study
These sources are likely to be stakeholders in a program - participants, other researchers, program staff, other community members, and so on.
Then we put all data in single framework & apply various statistical tools to find out the dynamic on the market.
During the analysis stage, feedback from the stakeholder groups would be compared to determine areas of agreement as well as areas of divergence
