

Key Insights
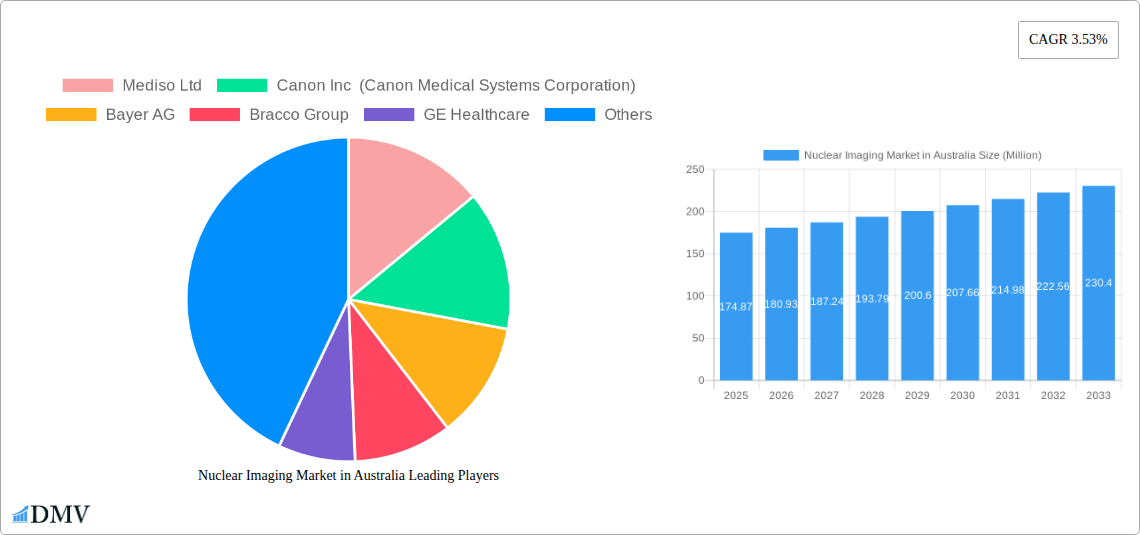
The Australian nuclear imaging market, valued at $174.87 million in 2025, is projected to experience steady growth, driven by factors such as an aging population leading to increased prevalence of chronic diseases requiring diagnostic imaging, technological advancements in imaging equipment offering higher resolution and improved diagnostic capabilities, and government initiatives promoting early disease detection and improved healthcare infrastructure. The market is segmented by product (equipment, diagnostic radioisotopes) and application (SPECT, PET). Equipment, encompassing advanced SPECT and PET scanners, constitutes a significant portion of the market, while the demand for diagnostic radioisotopes is largely contingent on the utilization of these imaging modalities. Growth in the PET application segment is likely faster than SPECT due to its superior imaging capabilities, particularly in oncology. Key players such as Mediso Ltd, Canon Medical Systems, Bayer AG, and GE Healthcare are actively competing through product innovation and strategic partnerships, fostering market expansion. While regulatory hurdles and the high cost of equipment could act as restraints, the overall positive trend in healthcare investment and increasing awareness about advanced diagnostics is expected to propel market growth throughout the forecast period (2025-2033).
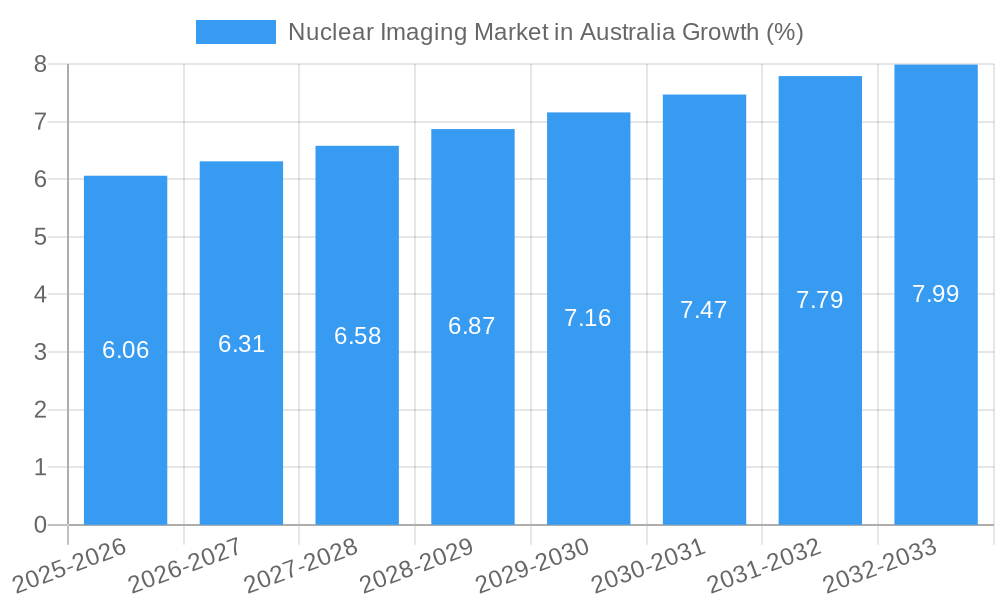
The CAGR of 3.53% indicates a consistent, albeit moderate, expansion. This growth is likely fueled by the increasing adoption of minimally invasive diagnostic procedures and the rising preference for accurate and early detection of diseases such as cancer. Further market penetration of advanced imaging technologies, particularly in regional areas with limited access to high-quality healthcare, presents opportunities for growth. Competitive strategies focused on technological advancements, service enhancements, and cost-effectiveness will be pivotal for market players in sustaining their market share and capturing new growth opportunities within the Australian healthcare landscape. The market is expected to see increased consolidation and strategic collaborations among companies to expand their market reach and service offerings in the coming years.
Nuclear Imaging Market in Australia: A Comprehensive Report (2019-2033)
This insightful report provides a detailed analysis of the Australian nuclear imaging market, offering a comprehensive overview of market dynamics, key players, and future growth prospects. Spanning the period 2019-2033, with a base year of 2025 and a forecast period of 2025-2033, this report is an essential resource for stakeholders seeking to understand and capitalize on the opportunities within this evolving sector. The Australian market is valued at xx Million in 2025 and is projected to reach xx Million by 2033, exhibiting a CAGR of xx%.
Nuclear Imaging Market in Australia Market Composition & Trends
The Australian nuclear imaging market exhibits a moderately concentrated landscape, with key players holding significant market share. Market share distribution amongst the top five players is estimated at approximately 70% in 2025. Innovation is driven by advancements in PET/CT and SPECT/CT technologies, alongside the development of novel radiopharmaceuticals. The regulatory landscape, governed by the Therapeutic Goods Administration (TGA), plays a crucial role in market access and product approvals. Substitute products, such as MRI and Ultrasound, exert competitive pressure, particularly in certain applications. End-users primarily include hospitals, diagnostic imaging centers, and research institutions. M&A activity has been relatively low in recent years, with deal values averaging xx Million per transaction (historical period).
- Market Concentration: Moderately concentrated, top 5 players hold ~70% market share (2025).
- Innovation Catalysts: Advancements in PET/CT, SPECT/CT, and radiopharmaceutical development.
- Regulatory Landscape: Primarily governed by the TGA.
- Substitute Products: MRI, Ultrasound.
- End-User Profile: Hospitals, diagnostic imaging centers, research institutions.
- M&A Activity: Low, average deal value xx Million (2019-2024).
Nuclear Imaging Market in Australia Industry Evolution
The Australian nuclear imaging market has witnessed steady growth over the historical period (2019-2024), driven by increasing prevalence of chronic diseases requiring nuclear imaging diagnosis, technological advancements enhancing image quality and diagnostic accuracy, and rising government investments in healthcare infrastructure. The adoption rate of advanced imaging technologies like PET/CT has been significantly increasing, fueled by improvements in image resolution and diagnostic capabilities. However, factors like high equipment costs and reimbursement challenges somewhat hinder market expansion. The market experienced a growth rate of xx% between 2021 and 2024, demonstrating substantial growth potential. Future growth will be shaped by the adoption of AI-powered image analysis, the development of targeted radiopharmaceuticals, and expanding applications in oncology and cardiology. Increased patient awareness and improved access to healthcare services are expected to further propel market growth. Technological advancements, such as improved detector technology and data analysis, have significantly enhanced the accuracy and speed of nuclear imaging, leading to improved diagnostic capabilities and shorter procedure times. This has increased the appeal of nuclear imaging to both patients and healthcare professionals. Furthermore, the increasing prevalence of chronic diseases such as cancer and cardiovascular diseases is driving higher demand for nuclear imaging services, particularly in Australia's aging population. Shifting consumer demands are focusing on improved patient experience and faster diagnostic turnaround times.
Leading Regions, Countries, or Segments in Nuclear Imaging Market in Australia
While precise regional data is unavailable, major metropolitan areas like Sydney, Melbourne, and Brisbane are expected to dominate the Australian nuclear imaging market due to their higher concentration of hospitals, specialized diagnostic centers and research institutions. The Equipment segment holds the largest market share, followed by Diagnostic Radioisotopes. Among applications, PET and SPECT applications are key growth drivers.
- Key Drivers:
- High prevalence of chronic diseases: Cancer, cardiovascular disease, neurological disorders.
- Government investments: Funding for healthcare infrastructure and advanced imaging technologies.
- Technological advancements: Enhanced image quality, faster scan times, improved diagnostic accuracy.
- Growing awareness: Increased patient and physician awareness about nuclear imaging capabilities.
Dominance Factors:
The dominance of metropolitan areas stems from the concentration of specialized healthcare facilities and a larger pool of patients requiring nuclear imaging services. The strong demand for advanced imaging technologies, coupled with government support for healthcare infrastructure development, has created a fertile ground for growth in these regions. The high prevalence of chronic diseases necessitating nuclear imaging diagnosis further contributes to their dominant position in the market. The Equipment segment's dominance is mainly attributable to the substantial investment required in procuring advanced nuclear imaging systems.
Nuclear Imaging Market in Australia Product Innovations
Recent innovations include the development of high-resolution PET/CT and SPECT/CT scanners with improved image quality and faster scan times. Advancements in radiopharmaceutical development offer more targeted therapies, resulting in increased diagnostic accuracy and reduced side effects. Unique selling propositions frequently center on faster image acquisition, improved image resolution, and reduced radiation exposure for patients. The integration of AI-powered image analysis tools is significantly improving diagnostic efficiency and accuracy.
Propelling Factors for Nuclear Imaging Market in Australia Growth
Technological advancements in equipment and radiopharmaceuticals are significantly driving market growth, enhancing image quality and diagnostic accuracy. Government funding for healthcare infrastructure development provides the basis for expanded access to nuclear imaging services. Furthermore, an aging population and the rising prevalence of chronic diseases create substantial demand for diagnostic and therapeutic nuclear imaging procedures.
Obstacles in the Nuclear Imaging Market in Australia Market
High equipment costs and the associated expenses for specialized personnel training pose significant barriers to market entry and expansion. Reimbursement challenges and lengthy regulatory approval processes can also hamper market growth. Furthermore, the availability of skilled nuclear medicine professionals is limited, hindering the potential market expansion. Competitive pressures from alternative imaging modalities, such as MRI and CT, also represent a challenge.
Future Opportunities in Nuclear Imaging Market in Australia
Expansion into regional areas with limited access to nuclear imaging services presents considerable opportunity. Increased adoption of AI-powered image analysis and theranostic applications that combine diagnosis and treatment offer significant potential. The development of novel radiotracers for improved disease detection and monitoring can create new market opportunities.
Major Players in the Nuclear Imaging Market in Australia Ecosystem
- Mediso Ltd
- Canon Inc (Canon Medical Systems Corporation)
- Bayer AG
- Bracco Group
- GE Healthcare
- Koninklijke Philips N V
- Novartis AG (Advanced Accelerator Applications)
- Siemens Healthineers AG
- Fujifilm Holdings Corporation
Key Developments in Nuclear Imaging Market in Australia Industry
- May 2021: Mediso's reference laboratory at ANSTO installed nanoScan PET/CT and SPECT/CT systems. This strengthened Mediso's presence in the Australian preclinical market, showcasing advanced technology.
- April 2021: Telix Pharmaceuticals partnered with the Oncidium Foundation, establishing the NOBLE registry for SPECT imaging in prostate cancer. This initiative enhanced the adoption and understanding of SPECT imaging in a significant clinical area.
Strategic Nuclear Imaging Market in Australia Market Forecast
The Australian nuclear imaging market is poised for robust growth driven by technological advancements, increased disease prevalence, and government investment. The increasing adoption of advanced imaging modalities and the development of innovative radiopharmaceuticals will further accelerate market expansion. Opportunities in theranostics, AI integration, and expansion into regional markets are expected to fuel significant market growth in the forecast period.
Nuclear Imaging Market in Australia Segmentation
-
1. Product
- 1.1. Equipment
-
1.2. Diagnostic Radioisotope
- 1.2.1. SPECT Radioisotopes
- 1.2.2. PET Radioisotopes
-
2. Application
-
2.1. SPECT Application
- 2.1.1. Cardiology
- 2.1.2. Neurology
- 2.1.3. Thyroid
- 2.1.4. Other SPECT Applications
-
2.2. PET Application
- 2.2.1. Oncology
- 2.2.2. Other PET Applications
-
2.1. SPECT Application
Nuclear Imaging Market in Australia Segmentation By Geography
-
1. North America
- 1.1. United States
- 1.2. Canada
- 1.3. Mexico
-
2. South America
- 2.1. Brazil
- 2.2. Argentina
- 2.3. Rest of South America
-
3. Europe
- 3.1. United Kingdom
- 3.2. Germany
- 3.3. France
- 3.4. Italy
- 3.5. Spain
- 3.6. Russia
- 3.7. Benelux
- 3.8. Nordics
- 3.9. Rest of Europe
-
4. Middle East & Africa
- 4.1. Turkey
- 4.2. Israel
- 4.3. GCC
- 4.4. North Africa
- 4.5. South Africa
- 4.6. Rest of Middle East & Africa
-
5. Asia Pacific
- 5.1. China
- 5.2. India
- 5.3. Japan
- 5.4. South Korea
- 5.5. ASEAN
- 5.6. Oceania
- 5.7. Rest of Asia Pacific
Nuclear Imaging Market in Australia REPORT HIGHLIGHTS
| Aspects | Details |
|---|---|
| Study Period | 2019-2033 |
| Base Year | 2024 |
| Estimated Year | 2025 |
| Forecast Period | 2025-2033 |
| Historical Period | 2019-2024 |
| Growth Rate | CAGR of 3.53% from 2019-2033 |
| Segmentation |
|
Table of Contents
- 1. Introduction
- 1.1. Research Scope
- 1.2. Market Segmentation
- 1.3. Research Methodology
- 1.4. Definitions and Assumptions
- 2. Executive Summary
- 2.1. Introduction
- 3. Market Dynamics
- 3.1. Introduction
- 3.2. Market Drivers
- 3.2.1. Increasing Prevalence of Chronic Diseases; Rising Geriatric Population; Increasing Technological Advancements
- 3.3. Market Restrains
- 3.3.1. Lack Of Proper Reimbursement And Stringent Regulatory Approval Procedures; High Cost of Equipment
- 3.4. Market Trends
- 3.4.1. Equipment Segment is Expected to Hold a Significant Market Share Over the Forecast Period
- 4. Market Factor Analysis
- 4.1. Porters Five Forces
- 4.2. Supply/Value Chain
- 4.3. PESTEL analysis
- 4.4. Market Entropy
- 4.5. Patent/Trademark Analysis
- 5. Global Nuclear Imaging Market in Australia Analysis, Insights and Forecast, 2019-2031
- 5.1. Market Analysis, Insights and Forecast - by Product
- 5.1.1. Equipment
- 5.1.2. Diagnostic Radioisotope
- 5.1.2.1. SPECT Radioisotopes
- 5.1.2.2. PET Radioisotopes
- 5.2. Market Analysis, Insights and Forecast - by Application
- 5.2.1. SPECT Application
- 5.2.1.1. Cardiology
- 5.2.1.2. Neurology
- 5.2.1.3. Thyroid
- 5.2.1.4. Other SPECT Applications
- 5.2.2. PET Application
- 5.2.2.1. Oncology
- 5.2.2.2. Other PET Applications
- 5.2.1. SPECT Application
- 5.3. Market Analysis, Insights and Forecast - by Region
- 5.3.1. North America
- 5.3.2. South America
- 5.3.3. Europe
- 5.3.4. Middle East & Africa
- 5.3.5. Asia Pacific
- 5.1. Market Analysis, Insights and Forecast - by Product
- 6. North America Nuclear Imaging Market in Australia Analysis, Insights and Forecast, 2019-2031
- 6.1. Market Analysis, Insights and Forecast - by Product
- 6.1.1. Equipment
- 6.1.2. Diagnostic Radioisotope
- 6.1.2.1. SPECT Radioisotopes
- 6.1.2.2. PET Radioisotopes
- 6.2. Market Analysis, Insights and Forecast - by Application
- 6.2.1. SPECT Application
- 6.2.1.1. Cardiology
- 6.2.1.2. Neurology
- 6.2.1.3. Thyroid
- 6.2.1.4. Other SPECT Applications
- 6.2.2. PET Application
- 6.2.2.1. Oncology
- 6.2.2.2. Other PET Applications
- 6.2.1. SPECT Application
- 6.1. Market Analysis, Insights and Forecast - by Product
- 7. South America Nuclear Imaging Market in Australia Analysis, Insights and Forecast, 2019-2031
- 7.1. Market Analysis, Insights and Forecast - by Product
- 7.1.1. Equipment
- 7.1.2. Diagnostic Radioisotope
- 7.1.2.1. SPECT Radioisotopes
- 7.1.2.2. PET Radioisotopes
- 7.2. Market Analysis, Insights and Forecast - by Application
- 7.2.1. SPECT Application
- 7.2.1.1. Cardiology
- 7.2.1.2. Neurology
- 7.2.1.3. Thyroid
- 7.2.1.4. Other SPECT Applications
- 7.2.2. PET Application
- 7.2.2.1. Oncology
- 7.2.2.2. Other PET Applications
- 7.2.1. SPECT Application
- 7.1. Market Analysis, Insights and Forecast - by Product
- 8. Europe Nuclear Imaging Market in Australia Analysis, Insights and Forecast, 2019-2031
- 8.1. Market Analysis, Insights and Forecast - by Product
- 8.1.1. Equipment
- 8.1.2. Diagnostic Radioisotope
- 8.1.2.1. SPECT Radioisotopes
- 8.1.2.2. PET Radioisotopes
- 8.2. Market Analysis, Insights and Forecast - by Application
- 8.2.1. SPECT Application
- 8.2.1.1. Cardiology
- 8.2.1.2. Neurology
- 8.2.1.3. Thyroid
- 8.2.1.4. Other SPECT Applications
- 8.2.2. PET Application
- 8.2.2.1. Oncology
- 8.2.2.2. Other PET Applications
- 8.2.1. SPECT Application
- 8.1. Market Analysis, Insights and Forecast - by Product
- 9. Middle East & Africa Nuclear Imaging Market in Australia Analysis, Insights and Forecast, 2019-2031
- 9.1. Market Analysis, Insights and Forecast - by Product
- 9.1.1. Equipment
- 9.1.2. Diagnostic Radioisotope
- 9.1.2.1. SPECT Radioisotopes
- 9.1.2.2. PET Radioisotopes
- 9.2. Market Analysis, Insights and Forecast - by Application
- 9.2.1. SPECT Application
- 9.2.1.1. Cardiology
- 9.2.1.2. Neurology
- 9.2.1.3. Thyroid
- 9.2.1.4. Other SPECT Applications
- 9.2.2. PET Application
- 9.2.2.1. Oncology
- 9.2.2.2. Other PET Applications
- 9.2.1. SPECT Application
- 9.1. Market Analysis, Insights and Forecast - by Product
- 10. Asia Pacific Nuclear Imaging Market in Australia Analysis, Insights and Forecast, 2019-2031
- 10.1. Market Analysis, Insights and Forecast - by Product
- 10.1.1. Equipment
- 10.1.2. Diagnostic Radioisotope
- 10.1.2.1. SPECT Radioisotopes
- 10.1.2.2. PET Radioisotopes
- 10.2. Market Analysis, Insights and Forecast - by Application
- 10.2.1. SPECT Application
- 10.2.1.1. Cardiology
- 10.2.1.2. Neurology
- 10.2.1.3. Thyroid
- 10.2.1.4. Other SPECT Applications
- 10.2.2. PET Application
- 10.2.2.1. Oncology
- 10.2.2.2. Other PET Applications
- 10.2.1. SPECT Application
- 10.1. Market Analysis, Insights and Forecast - by Product
- 11. Competitive Analysis
- 11.1. Global Market Share Analysis 2024
- 11.2. Company Profiles
- 11.2.1 Mediso Ltd
- 11.2.1.1. Overview
- 11.2.1.2. Products
- 11.2.1.3. SWOT Analysis
- 11.2.1.4. Recent Developments
- 11.2.1.5. Financials (Based on Availability)
- 11.2.2 Canon Inc (Canon Medical Systems Corporation)
- 11.2.2.1. Overview
- 11.2.2.2. Products
- 11.2.2.3. SWOT Analysis
- 11.2.2.4. Recent Developments
- 11.2.2.5. Financials (Based on Availability)
- 11.2.3 Bayer AG
- 11.2.3.1. Overview
- 11.2.3.2. Products
- 11.2.3.3. SWOT Analysis
- 11.2.3.4. Recent Developments
- 11.2.3.5. Financials (Based on Availability)
- 11.2.4 Bracco Group
- 11.2.4.1. Overview
- 11.2.4.2. Products
- 11.2.4.3. SWOT Analysis
- 11.2.4.4. Recent Developments
- 11.2.4.5. Financials (Based on Availability)
- 11.2.5 GE Healthcare
- 11.2.5.1. Overview
- 11.2.5.2. Products
- 11.2.5.3. SWOT Analysis
- 11.2.5.4. Recent Developments
- 11.2.5.5. Financials (Based on Availability)
- 11.2.6 Koninklijke Philips N V
- 11.2.6.1. Overview
- 11.2.6.2. Products
- 11.2.6.3. SWOT Analysis
- 11.2.6.4. Recent Developments
- 11.2.6.5. Financials (Based on Availability)
- 11.2.7 Novartis AG (Advanced Accelerator Applications)
- 11.2.7.1. Overview
- 11.2.7.2. Products
- 11.2.7.3. SWOT Analysis
- 11.2.7.4. Recent Developments
- 11.2.7.5. Financials (Based on Availability)
- 11.2.8 Siemens Healthineers AG
- 11.2.8.1. Overview
- 11.2.8.2. Products
- 11.2.8.3. SWOT Analysis
- 11.2.8.4. Recent Developments
- 11.2.8.5. Financials (Based on Availability)
- 11.2.9 Fujifilm Holdings Corporation
- 11.2.9.1. Overview
- 11.2.9.2. Products
- 11.2.9.3. SWOT Analysis
- 11.2.9.4. Recent Developments
- 11.2.9.5. Financials (Based on Availability)
- 11.2.1 Mediso Ltd
List of Figures
- Figure 1: Global Nuclear Imaging Market in Australia Revenue Breakdown (Million, %) by Region 2024 & 2032
- Figure 2: Australia Nuclear Imaging Market in Australia Revenue (Million), by Country 2024 & 2032
- Figure 3: Australia Nuclear Imaging Market in Australia Revenue Share (%), by Country 2024 & 2032
- Figure 4: North America Nuclear Imaging Market in Australia Revenue (Million), by Product 2024 & 2032
- Figure 5: North America Nuclear Imaging Market in Australia Revenue Share (%), by Product 2024 & 2032
- Figure 6: North America Nuclear Imaging Market in Australia Revenue (Million), by Application 2024 & 2032
- Figure 7: North America Nuclear Imaging Market in Australia Revenue Share (%), by Application 2024 & 2032
- Figure 8: North America Nuclear Imaging Market in Australia Revenue (Million), by Country 2024 & 2032
- Figure 9: North America Nuclear Imaging Market in Australia Revenue Share (%), by Country 2024 & 2032
- Figure 10: South America Nuclear Imaging Market in Australia Revenue (Million), by Product 2024 & 2032
- Figure 11: South America Nuclear Imaging Market in Australia Revenue Share (%), by Product 2024 & 2032
- Figure 12: South America Nuclear Imaging Market in Australia Revenue (Million), by Application 2024 & 2032
- Figure 13: South America Nuclear Imaging Market in Australia Revenue Share (%), by Application 2024 & 2032
- Figure 14: South America Nuclear Imaging Market in Australia Revenue (Million), by Country 2024 & 2032
- Figure 15: South America Nuclear Imaging Market in Australia Revenue Share (%), by Country 2024 & 2032
- Figure 16: Europe Nuclear Imaging Market in Australia Revenue (Million), by Product 2024 & 2032
- Figure 17: Europe Nuclear Imaging Market in Australia Revenue Share (%), by Product 2024 & 2032
- Figure 18: Europe Nuclear Imaging Market in Australia Revenue (Million), by Application 2024 & 2032
- Figure 19: Europe Nuclear Imaging Market in Australia Revenue Share (%), by Application 2024 & 2032
- Figure 20: Europe Nuclear Imaging Market in Australia Revenue (Million), by Country 2024 & 2032
- Figure 21: Europe Nuclear Imaging Market in Australia Revenue Share (%), by Country 2024 & 2032
- Figure 22: Middle East & Africa Nuclear Imaging Market in Australia Revenue (Million), by Product 2024 & 2032
- Figure 23: Middle East & Africa Nuclear Imaging Market in Australia Revenue Share (%), by Product 2024 & 2032
- Figure 24: Middle East & Africa Nuclear Imaging Market in Australia Revenue (Million), by Application 2024 & 2032
- Figure 25: Middle East & Africa Nuclear Imaging Market in Australia Revenue Share (%), by Application 2024 & 2032
- Figure 26: Middle East & Africa Nuclear Imaging Market in Australia Revenue (Million), by Country 2024 & 2032
- Figure 27: Middle East & Africa Nuclear Imaging Market in Australia Revenue Share (%), by Country 2024 & 2032
- Figure 28: Asia Pacific Nuclear Imaging Market in Australia Revenue (Million), by Product 2024 & 2032
- Figure 29: Asia Pacific Nuclear Imaging Market in Australia Revenue Share (%), by Product 2024 & 2032
- Figure 30: Asia Pacific Nuclear Imaging Market in Australia Revenue (Million), by Application 2024 & 2032
- Figure 31: Asia Pacific Nuclear Imaging Market in Australia Revenue Share (%), by Application 2024 & 2032
- Figure 32: Asia Pacific Nuclear Imaging Market in Australia Revenue (Million), by Country 2024 & 2032
- Figure 33: Asia Pacific Nuclear Imaging Market in Australia Revenue Share (%), by Country 2024 & 2032
List of Tables
- Table 1: Global Nuclear Imaging Market in Australia Revenue Million Forecast, by Region 2019 & 2032
- Table 2: Global Nuclear Imaging Market in Australia Revenue Million Forecast, by Product 2019 & 2032
- Table 3: Global Nuclear Imaging Market in Australia Revenue Million Forecast, by Application 2019 & 2032
- Table 4: Global Nuclear Imaging Market in Australia Revenue Million Forecast, by Region 2019 & 2032
- Table 5: Global Nuclear Imaging Market in Australia Revenue Million Forecast, by Country 2019 & 2032
- Table 6: Global Nuclear Imaging Market in Australia Revenue Million Forecast, by Product 2019 & 2032
- Table 7: Global Nuclear Imaging Market in Australia Revenue Million Forecast, by Application 2019 & 2032
- Table 8: Global Nuclear Imaging Market in Australia Revenue Million Forecast, by Country 2019 & 2032
- Table 9: United States Nuclear Imaging Market in Australia Revenue (Million) Forecast, by Application 2019 & 2032
- Table 10: Canada Nuclear Imaging Market in Australia Revenue (Million) Forecast, by Application 2019 & 2032
- Table 11: Mexico Nuclear Imaging Market in Australia Revenue (Million) Forecast, by Application 2019 & 2032
- Table 12: Global Nuclear Imaging Market in Australia Revenue Million Forecast, by Product 2019 & 2032
- Table 13: Global Nuclear Imaging Market in Australia Revenue Million Forecast, by Application 2019 & 2032
- Table 14: Global Nuclear Imaging Market in Australia Revenue Million Forecast, by Country 2019 & 2032
- Table 15: Brazil Nuclear Imaging Market in Australia Revenue (Million) Forecast, by Application 2019 & 2032
- Table 16: Argentina Nuclear Imaging Market in Australia Revenue (Million) Forecast, by Application 2019 & 2032
- Table 17: Rest of South America Nuclear Imaging Market in Australia Revenue (Million) Forecast, by Application 2019 & 2032
- Table 18: Global Nuclear Imaging Market in Australia Revenue Million Forecast, by Product 2019 & 2032
- Table 19: Global Nuclear Imaging Market in Australia Revenue Million Forecast, by Application 2019 & 2032
- Table 20: Global Nuclear Imaging Market in Australia Revenue Million Forecast, by Country 2019 & 2032
- Table 21: United Kingdom Nuclear Imaging Market in Australia Revenue (Million) Forecast, by Application 2019 & 2032
- Table 22: Germany Nuclear Imaging Market in Australia Revenue (Million) Forecast, by Application 2019 & 2032
- Table 23: France Nuclear Imaging Market in Australia Revenue (Million) Forecast, by Application 2019 & 2032
- Table 24: Italy Nuclear Imaging Market in Australia Revenue (Million) Forecast, by Application 2019 & 2032
- Table 25: Spain Nuclear Imaging Market in Australia Revenue (Million) Forecast, by Application 2019 & 2032
- Table 26: Russia Nuclear Imaging Market in Australia Revenue (Million) Forecast, by Application 2019 & 2032
- Table 27: Benelux Nuclear Imaging Market in Australia Revenue (Million) Forecast, by Application 2019 & 2032
- Table 28: Nordics Nuclear Imaging Market in Australia Revenue (Million) Forecast, by Application 2019 & 2032
- Table 29: Rest of Europe Nuclear Imaging Market in Australia Revenue (Million) Forecast, by Application 2019 & 2032
- Table 30: Global Nuclear Imaging Market in Australia Revenue Million Forecast, by Product 2019 & 2032
- Table 31: Global Nuclear Imaging Market in Australia Revenue Million Forecast, by Application 2019 & 2032
- Table 32: Global Nuclear Imaging Market in Australia Revenue Million Forecast, by Country 2019 & 2032
- Table 33: Turkey Nuclear Imaging Market in Australia Revenue (Million) Forecast, by Application 2019 & 2032
- Table 34: Israel Nuclear Imaging Market in Australia Revenue (Million) Forecast, by Application 2019 & 2032
- Table 35: GCC Nuclear Imaging Market in Australia Revenue (Million) Forecast, by Application 2019 & 2032
- Table 36: North Africa Nuclear Imaging Market in Australia Revenue (Million) Forecast, by Application 2019 & 2032
- Table 37: South Africa Nuclear Imaging Market in Australia Revenue (Million) Forecast, by Application 2019 & 2032
- Table 38: Rest of Middle East & Africa Nuclear Imaging Market in Australia Revenue (Million) Forecast, by Application 2019 & 2032
- Table 39: Global Nuclear Imaging Market in Australia Revenue Million Forecast, by Product 2019 & 2032
- Table 40: Global Nuclear Imaging Market in Australia Revenue Million Forecast, by Application 2019 & 2032
- Table 41: Global Nuclear Imaging Market in Australia Revenue Million Forecast, by Country 2019 & 2032
- Table 42: China Nuclear Imaging Market in Australia Revenue (Million) Forecast, by Application 2019 & 2032
- Table 43: India Nuclear Imaging Market in Australia Revenue (Million) Forecast, by Application 2019 & 2032
- Table 44: Japan Nuclear Imaging Market in Australia Revenue (Million) Forecast, by Application 2019 & 2032
- Table 45: South Korea Nuclear Imaging Market in Australia Revenue (Million) Forecast, by Application 2019 & 2032
- Table 46: ASEAN Nuclear Imaging Market in Australia Revenue (Million) Forecast, by Application 2019 & 2032
- Table 47: Oceania Nuclear Imaging Market in Australia Revenue (Million) Forecast, by Application 2019 & 2032
- Table 48: Rest of Asia Pacific Nuclear Imaging Market in Australia Revenue (Million) Forecast, by Application 2019 & 2032
Frequently Asked Questions
1. What is the projected Compound Annual Growth Rate (CAGR) of the Nuclear Imaging Market in Australia?
The projected CAGR is approximately 3.53%.
2. Which companies are prominent players in the Nuclear Imaging Market in Australia?
Key companies in the market include Mediso Ltd, Canon Inc (Canon Medical Systems Corporation), Bayer AG, Bracco Group, GE Healthcare, Koninklijke Philips N V, Novartis AG (Advanced Accelerator Applications), Siemens Healthineers AG, Fujifilm Holdings Corporation.
3. What are the main segments of the Nuclear Imaging Market in Australia?
The market segments include Product, Application.
4. Can you provide details about the market size?
The market size is estimated to be USD 174.87 Million as of 2022.
5. What are some drivers contributing to market growth?
Increasing Prevalence of Chronic Diseases; Rising Geriatric Population; Increasing Technological Advancements.
6. What are the notable trends driving market growth?
Equipment Segment is Expected to Hold a Significant Market Share Over the Forecast Period.
7. Are there any restraints impacting market growth?
Lack Of Proper Reimbursement And Stringent Regulatory Approval Procedures; High Cost of Equipment.
8. Can you provide examples of recent developments in the market?
In May 2021, Mediso's reference laboratory at ANSTO, Australia's Nuclear Science and Technology Organization installed the newly acquired nanoScan PET/CT and SPECT/CT preclinical molecular imaging systems.
9. What pricing options are available for accessing the report?
Pricing options include single-user, multi-user, and enterprise licenses priced at USD 3800, USD 4500, and USD 5800 respectively.
10. Is the market size provided in terms of value or volume?
The market size is provided in terms of value, measured in Million.
11. Are there any specific market keywords associated with the report?
Yes, the market keyword associated with the report is "Nuclear Imaging Market in Australia," which aids in identifying and referencing the specific market segment covered.
12. How do I determine which pricing option suits my needs best?
The pricing options vary based on user requirements and access needs. Individual users may opt for single-user licenses, while businesses requiring broader access may choose multi-user or enterprise licenses for cost-effective access to the report.
13. Are there any additional resources or data provided in the Nuclear Imaging Market in Australia report?
While the report offers comprehensive insights, it's advisable to review the specific contents or supplementary materials provided to ascertain if additional resources or data are available.
14. How can I stay updated on further developments or reports in the Nuclear Imaging Market in Australia?
To stay informed about further developments, trends, and reports in the Nuclear Imaging Market in Australia, consider subscribing to industry newsletters, following relevant companies and organizations, or regularly checking reputable industry news sources and publications.
Methodology
Step 1 - Identification of Relevant Samples Size from Population Database


Step 2 - Approaches for Defining Global Market Size (Value, Volume* & Price*)

Note*: In applicable scenarios
Step 3 - Data Sources
Primary Research
- Web Analytics
- Survey Reports
- Research Institute
- Latest Research Reports
- Opinion Leaders
Secondary Research
- Annual Reports
- White Paper
- Latest Press Release
- Industry Association
- Paid Database
- Investor Presentations

Step 4 - Data Triangulation
Involves using different sources of information in order to increase the validity of a study
These sources are likely to be stakeholders in a program - participants, other researchers, program staff, other community members, and so on.
Then we put all data in single framework & apply various statistical tools to find out the dynamic on the market.
During the analysis stage, feedback from the stakeholder groups would be compared to determine areas of agreement as well as areas of divergence
