

Key Insights
The North American gas turbine power generation market, valued at approximately $XX million in 2025, is projected to experience robust growth, exceeding a 4.50% CAGR through 2033. This expansion is fueled by several key drivers. Increasing electricity demand driven by population growth and industrialization necessitates additional power generation capacity. The transition towards cleaner energy sources is also a significant factor, with gas turbines playing a crucial role as intermediate solutions bridging the gap between fossil fuels and renewable energy. Furthermore, advancements in technology, leading to higher efficiency and lower emissions, are making gas turbines a more attractive option for power producers. Specific market segments within North America demonstrate varying growth trajectories. The combined cycle segment is expected to dominate due to its higher efficiency compared to open cycle systems. Within capacity segments, the 31-120 MW range is projected to witness significant growth, reflecting the demand for medium-sized power plants catering to regional electricity grids. The Oil and Gas sector remains a key end-user industry, driven by the continuous need for reliable power for extraction and processing operations. However, regulatory pressures related to emissions and the increasing adoption of renewable energy sources present potential restraints to the market's growth, potentially impacting the pace of future expansion.
Despite these potential restraints, the market's overall outlook remains positive. The presence of major industry players like General Electric, Siemens, and Mitsubishi Heavy Industries ensures a competitive landscape driving innovation and technological advancements. The North American market, particularly the United States, is expected to be a key growth driver due to its established infrastructure and ongoing investment in energy modernization. The Canadian and Mexican markets are also anticipated to contribute significantly, albeit at a potentially slower rate compared to the U.S. given differences in regulatory landscapes and energy consumption patterns. Strategic partnerships, technological collaborations, and government incentives aimed at supporting cleaner energy transitions will further shape the future trajectory of the North American gas turbine power generation market over the forecast period.
North America Gas Turbine Power Generation Industry: Market Report 2019-2033
This comprehensive report provides an in-depth analysis of the North America gas turbine power generation industry, covering the period 2019-2033. It offers crucial insights into market trends, leading players, technological advancements, and future growth prospects, equipping stakeholders with the knowledge needed to make informed strategic decisions. The report uses 2025 as the base year and forecasts market trends until 2033, leveraging historical data from 2019-2024. The total market value in 2025 is estimated at $XX Billion.
North America Gas Turbine Power Generation Industry Market Composition & Trends
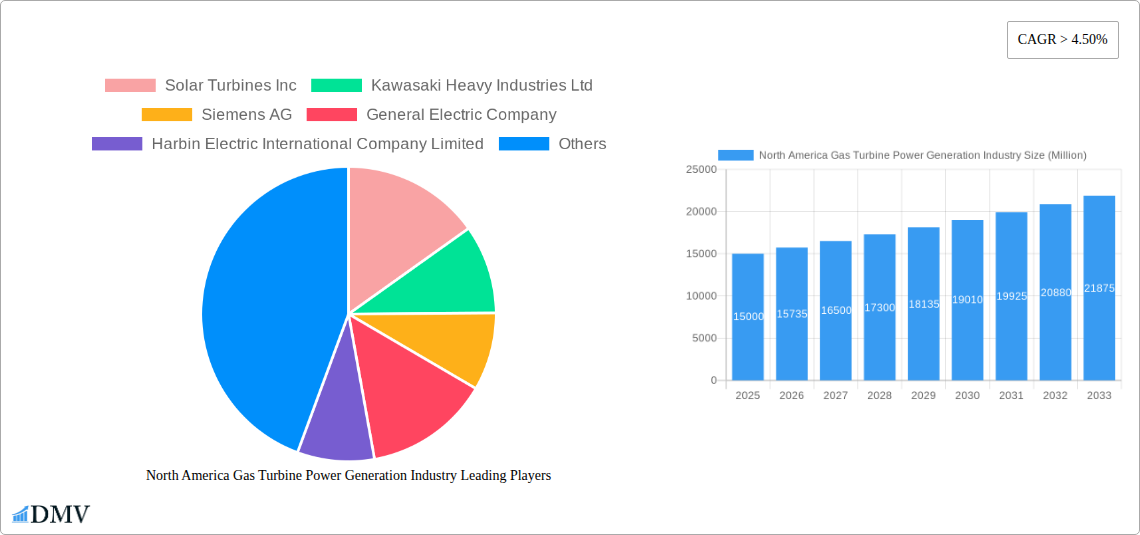
This section delves into the competitive landscape, analyzing market concentration, innovation drivers, regulatory factors, and the impact of substitute products. We examine end-user profiles across Power, Oil & Gas, and Other End-User Industries, alongside mergers and acquisitions (M&A) activity. The report quantifies market share distribution among key players like General Electric Company, Siemens AG, Rolls-Royce Holding PLC, and others, revealing a moderately consolidated market with significant M&A activity valued at approximately $XX Billion in the last five years.
- Market Concentration: High concentration amongst top players.
- Innovation Catalysts: Focus on efficiency improvements and emission reduction technologies.
- Regulatory Landscape: Stringent environmental regulations driving technological advancements.
- Substitute Products: Competition from renewable energy sources impacts market growth.
- End-User Profiles: Significant demand from power generation sector followed by oil and gas.
- M&A Activity: Consolidation trends through strategic acquisitions and partnerships.
North America Gas Turbine Power Generation Industry Industry Evolution
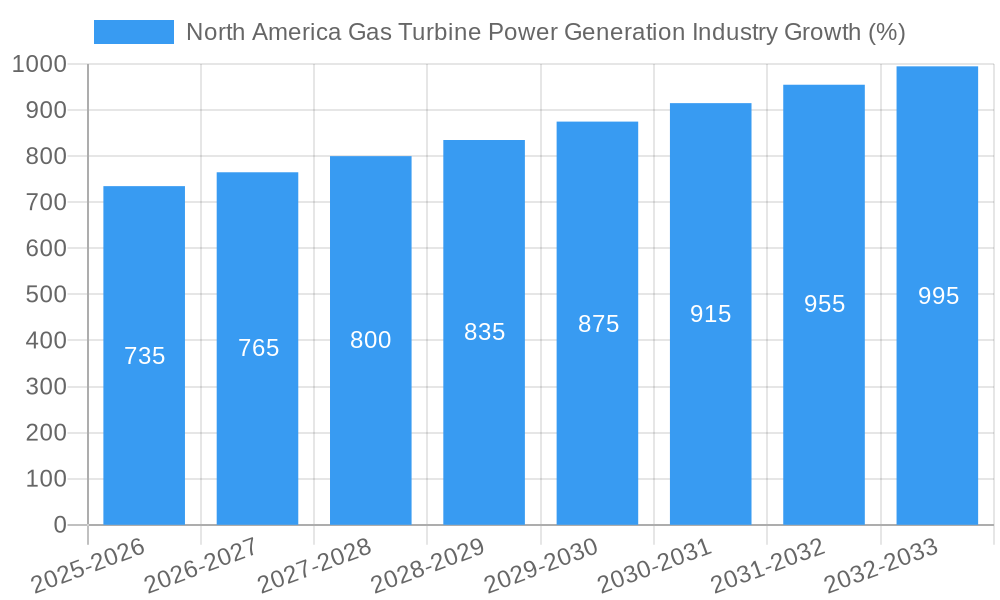
This section meticulously analyzes the historical and projected growth trajectories of the North America gas turbine power generation industry. We explore the interplay of technological advancements, shifting consumer preferences, and economic factors influencing market expansion. The industry experienced a Compound Annual Growth Rate (CAGR) of XX% during 2019-2024, and a projected CAGR of XX% is anticipated from 2025 to 2033. This growth is fueled by increasing energy demand, the need for reliable power generation, and ongoing technological innovations focused on efficiency and emissions. Adoption of advanced technologies like combined cycle systems is steadily growing, with an estimated XX% market penetration by 2033.
Leading Regions, Countries, or Segments in North America Gas Turbine Power Generation Industry
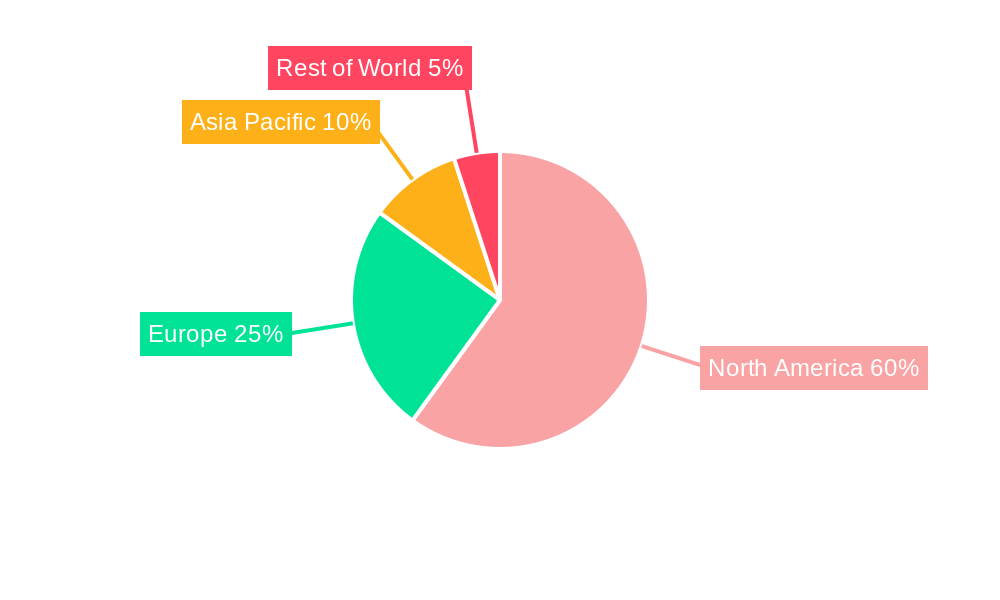
This segment identifies the leading regions, countries, and market segments based on end-user industries (Power, Oil & Gas, Other), capacity (Less than 30 MW, 31-120 MW, Above 120 MW), and type (Combined Cycle, Open Cycle). The US is the dominant market due to factors like robust energy demand, supportive government policies, and significant investments in infrastructure.
Key Drivers (US):
- Significant Investment in Power Generation Infrastructure: Billions of dollars invested annually.
- Favorable Regulatory Environment: Incentives for adopting cleaner energy technologies.
- High Energy Demand: Driven by industrial activities and population growth.
Dominance Factors (Combined Cycle):
- High Efficiency: Superior power output compared to open-cycle systems.
- Lower Emissions: Compliance with stringent emission regulations.
- High Capital Costs: Higher initial investments but offset by long-term operational savings.
Growth Segment (31-120 MW): This segment demonstrates the strongest growth potential due to its balance of cost-effectiveness and power output suitable for various applications.
North America Gas Turbine Power Generation Industry Product Innovations
Recent innovations focus on enhanced efficiency, reduced emissions (NOx, CO2), and improved durability. Advanced materials, digital controls, and predictive maintenance technologies are being integrated, offering superior performance and lower lifecycle costs. These innovations are attracting new customers and expanding market applications.
Propelling Factors for North America Gas Turbine Power Generation Industry Growth
Several key factors drive industry growth, including increasing energy demand, government support for reliable power sources, and technological advancements leading to higher efficiency and lower emissions. Investments in gas turbine infrastructure, coupled with the need for flexible and reliable power generation, continue to fuel market expansion. The ongoing transition towards cleaner energy sources also indirectly boosts the demand for more efficient and environmentally friendly gas turbines.
Obstacles in the North America Gas Turbine Power Generation Industry Market
The industry faces challenges such as fluctuating fuel prices, stringent environmental regulations leading to higher compliance costs, and increasing competition from renewable energy sources. Supply chain disruptions have also caused delays and increased costs, impacting market growth.
Future Opportunities in North America Gas Turbine Power Generation Industry
The future holds significant opportunities, notably in the integration of gas turbines with renewable energy sources (hybrid systems), the development of smaller, more modular gas turbines for distributed generation, and increasing focus on digitalization and smart grid integration.
Major Players in the North America Gas Turbine Power Generation Industry Ecosystem
- Solar Turbines Inc
- Kawasaki Heavy Industries Ltd
- Siemens AG
- General Electric Company
- Harbin Electric International Company Limited
- Capstone Turbine Corporation
- Mitsubishi Heavy Industries Ltd
- Rolls-Royce Holding PLC
Key Developments in North America Gas Turbine Power Generation Industry Industry
- 2022 Q4: Siemens announced a new line of highly efficient gas turbines.
- 2023 Q1: General Electric secured a major contract for gas turbine supply to a power plant.
- 2023 Q2: Regulatory changes introduce stricter emission standards for gas turbines.
Strategic North America Gas Turbine Power Generation Industry Market Forecast
The North American gas turbine power generation market is poised for continued growth, driven by factors like infrastructure development, technological advancements, and the need for reliable power sources. While renewable energy sources pose a competitive challenge, the increasing demand for flexible and efficient power generation is expected to sustain significant market expansion throughout the forecast period (2025-2033). The focus on improving efficiency, reducing emissions, and integrating with smart grids will shape the industry's future trajectory.
North America Gas Turbine Power Generation Industry Segmentation
-
1. Capacity
- 1.1. Less than 30 MW
- 1.2. 31 to 120 MW
- 1.3. Above 120
-
2. Type
- 2.1. Combined Cycle
- 2.2. Open Cycle
-
3. End-User Industries
- 3.1. Power
- 3.2. Oil and Gas
- 3.3. Other End-User Industries
-
4. Geography
- 4.1. United States
- 4.2. Canada
- 4.3. Restof North America
North America Gas Turbine Power Generation Industry Segmentation By Geography
- 1. United States
- 2. Canada
- 3. Restof North America
North America Gas Turbine Power Generation Industry REPORT HIGHLIGHTS
| Aspects | Details |
|---|---|
| Study Period | 2019-2033 |
| Base Year | 2024 |
| Estimated Year | 2025 |
| Forecast Period | 2025-2033 |
| Historical Period | 2019-2024 |
| Growth Rate | CAGR of > 4.50% from 2019-2033 |
| Segmentation |
|
Table of Contents
- 1. Introduction
- 1.1. Research Scope
- 1.2. Market Segmentation
- 1.3. Research Methodology
- 1.4. Definitions and Assumptions
- 2. Executive Summary
- 2.1. Introduction
- 3. Market Dynamics
- 3.1. Introduction
- 3.2. Market Drivers
- 3.2.1. 4.; Supportive Government Policies and Incentives4.; Environmental Concerns
- 3.3. Market Restrains
- 3.3.1. 4.; Fossil Fuel Subsidies
- 3.4. Market Trends
- 3.4.1. Power Generation Application is Expected to Dominate the Market
- 4. Market Factor Analysis
- 4.1. Porters Five Forces
- 4.2. Supply/Value Chain
- 4.3. PESTEL analysis
- 4.4. Market Entropy
- 4.5. Patent/Trademark Analysis
- 5. North America Gas Turbine Power Generation Industry Analysis, Insights and Forecast, 2019-2031
- 5.1. Market Analysis, Insights and Forecast - by Capacity
- 5.1.1. Less than 30 MW
- 5.1.2. 31 to 120 MW
- 5.1.3. Above 120
- 5.2. Market Analysis, Insights and Forecast - by Type
- 5.2.1. Combined Cycle
- 5.2.2. Open Cycle
- 5.3. Market Analysis, Insights and Forecast - by End-User Industries
- 5.3.1. Power
- 5.3.2. Oil and Gas
- 5.3.3. Other End-User Industries
- 5.4. Market Analysis, Insights and Forecast - by Geography
- 5.4.1. United States
- 5.4.2. Canada
- 5.4.3. Restof North America
- 5.5. Market Analysis, Insights and Forecast - by Region
- 5.5.1. United States
- 5.5.2. Canada
- 5.5.3. Restof North America
- 5.1. Market Analysis, Insights and Forecast - by Capacity
- 6. United States North America Gas Turbine Power Generation Industry Analysis, Insights and Forecast, 2019-2031
- 6.1. Market Analysis, Insights and Forecast - by Capacity
- 6.1.1. Less than 30 MW
- 6.1.2. 31 to 120 MW
- 6.1.3. Above 120
- 6.2. Market Analysis, Insights and Forecast - by Type
- 6.2.1. Combined Cycle
- 6.2.2. Open Cycle
- 6.3. Market Analysis, Insights and Forecast - by End-User Industries
- 6.3.1. Power
- 6.3.2. Oil and Gas
- 6.3.3. Other End-User Industries
- 6.4. Market Analysis, Insights and Forecast - by Geography
- 6.4.1. United States
- 6.4.2. Canada
- 6.4.3. Restof North America
- 6.1. Market Analysis, Insights and Forecast - by Capacity
- 7. Canada North America Gas Turbine Power Generation Industry Analysis, Insights and Forecast, 2019-2031
- 7.1. Market Analysis, Insights and Forecast - by Capacity
- 7.1.1. Less than 30 MW
- 7.1.2. 31 to 120 MW
- 7.1.3. Above 120
- 7.2. Market Analysis, Insights and Forecast - by Type
- 7.2.1. Combined Cycle
- 7.2.2. Open Cycle
- 7.3. Market Analysis, Insights and Forecast - by End-User Industries
- 7.3.1. Power
- 7.3.2. Oil and Gas
- 7.3.3. Other End-User Industries
- 7.4. Market Analysis, Insights and Forecast - by Geography
- 7.4.1. United States
- 7.4.2. Canada
- 7.4.3. Restof North America
- 7.1. Market Analysis, Insights and Forecast - by Capacity
- 8. Restof North America North America Gas Turbine Power Generation Industry Analysis, Insights and Forecast, 2019-2031
- 8.1. Market Analysis, Insights and Forecast - by Capacity
- 8.1.1. Less than 30 MW
- 8.1.2. 31 to 120 MW
- 8.1.3. Above 120
- 8.2. Market Analysis, Insights and Forecast - by Type
- 8.2.1. Combined Cycle
- 8.2.2. Open Cycle
- 8.3. Market Analysis, Insights and Forecast - by End-User Industries
- 8.3.1. Power
- 8.3.2. Oil and Gas
- 8.3.3. Other End-User Industries
- 8.4. Market Analysis, Insights and Forecast - by Geography
- 8.4.1. United States
- 8.4.2. Canada
- 8.4.3. Restof North America
- 8.1. Market Analysis, Insights and Forecast - by Capacity
- 9. United States North America Gas Turbine Power Generation Industry Analysis, Insights and Forecast, 2019-2031
- 10. Canada North America Gas Turbine Power Generation Industry Analysis, Insights and Forecast, 2019-2031
- 11. Mexico North America Gas Turbine Power Generation Industry Analysis, Insights and Forecast, 2019-2031
- 12. Rest of North America North America Gas Turbine Power Generation Industry Analysis, Insights and Forecast, 2019-2031
- 13. Competitive Analysis
- 13.1. Market Share Analysis 2024
- 13.2. Company Profiles
- 13.2.1 Solar Turbines Inc
- 13.2.1.1. Overview
- 13.2.1.2. Products
- 13.2.1.3. SWOT Analysis
- 13.2.1.4. Recent Developments
- 13.2.1.5. Financials (Based on Availability)
- 13.2.2 Kawasaki Heavy Industries Ltd
- 13.2.2.1. Overview
- 13.2.2.2. Products
- 13.2.2.3. SWOT Analysis
- 13.2.2.4. Recent Developments
- 13.2.2.5. Financials (Based on Availability)
- 13.2.3 Siemens AG
- 13.2.3.1. Overview
- 13.2.3.2. Products
- 13.2.3.3. SWOT Analysis
- 13.2.3.4. Recent Developments
- 13.2.3.5. Financials (Based on Availability)
- 13.2.4 General Electric Company
- 13.2.4.1. Overview
- 13.2.4.2. Products
- 13.2.4.3. SWOT Analysis
- 13.2.4.4. Recent Developments
- 13.2.4.5. Financials (Based on Availability)
- 13.2.5 Harbin Electric International Company Limited
- 13.2.5.1. Overview
- 13.2.5.2. Products
- 13.2.5.3. SWOT Analysis
- 13.2.5.4. Recent Developments
- 13.2.5.5. Financials (Based on Availability)
- 13.2.6 Capstone Turbine Corporation
- 13.2.6.1. Overview
- 13.2.6.2. Products
- 13.2.6.3. SWOT Analysis
- 13.2.6.4. Recent Developments
- 13.2.6.5. Financials (Based on Availability)
- 13.2.7 Mitsubishi Heavy Industries Ltd
- 13.2.7.1. Overview
- 13.2.7.2. Products
- 13.2.7.3. SWOT Analysis
- 13.2.7.4. Recent Developments
- 13.2.7.5. Financials (Based on Availability)
- 13.2.8 Rolls-Royce Holding PLC
- 13.2.8.1. Overview
- 13.2.8.2. Products
- 13.2.8.3. SWOT Analysis
- 13.2.8.4. Recent Developments
- 13.2.8.5. Financials (Based on Availability)
- 13.2.1 Solar Turbines Inc
List of Figures
- Figure 1: North America Gas Turbine Power Generation Industry Revenue Breakdown (Million, %) by Product 2024 & 2032
- Figure 2: North America Gas Turbine Power Generation Industry Share (%) by Company 2024
List of Tables
- Table 1: North America Gas Turbine Power Generation Industry Revenue Million Forecast, by Region 2019 & 2032
- Table 2: North America Gas Turbine Power Generation Industry Revenue Million Forecast, by Capacity 2019 & 2032
- Table 3: North America Gas Turbine Power Generation Industry Revenue Million Forecast, by Type 2019 & 2032
- Table 4: North America Gas Turbine Power Generation Industry Revenue Million Forecast, by End-User Industries 2019 & 2032
- Table 5: North America Gas Turbine Power Generation Industry Revenue Million Forecast, by Geography 2019 & 2032
- Table 6: North America Gas Turbine Power Generation Industry Revenue Million Forecast, by Region 2019 & 2032
- Table 7: North America Gas Turbine Power Generation Industry Revenue Million Forecast, by Country 2019 & 2032
- Table 8: United States North America Gas Turbine Power Generation Industry Revenue (Million) Forecast, by Application 2019 & 2032
- Table 9: Canada North America Gas Turbine Power Generation Industry Revenue (Million) Forecast, by Application 2019 & 2032
- Table 10: Mexico North America Gas Turbine Power Generation Industry Revenue (Million) Forecast, by Application 2019 & 2032
- Table 11: Rest of North America North America Gas Turbine Power Generation Industry Revenue (Million) Forecast, by Application 2019 & 2032
- Table 12: North America Gas Turbine Power Generation Industry Revenue Million Forecast, by Capacity 2019 & 2032
- Table 13: North America Gas Turbine Power Generation Industry Revenue Million Forecast, by Type 2019 & 2032
- Table 14: North America Gas Turbine Power Generation Industry Revenue Million Forecast, by End-User Industries 2019 & 2032
- Table 15: North America Gas Turbine Power Generation Industry Revenue Million Forecast, by Geography 2019 & 2032
- Table 16: North America Gas Turbine Power Generation Industry Revenue Million Forecast, by Country 2019 & 2032
- Table 17: North America Gas Turbine Power Generation Industry Revenue Million Forecast, by Capacity 2019 & 2032
- Table 18: North America Gas Turbine Power Generation Industry Revenue Million Forecast, by Type 2019 & 2032
- Table 19: North America Gas Turbine Power Generation Industry Revenue Million Forecast, by End-User Industries 2019 & 2032
- Table 20: North America Gas Turbine Power Generation Industry Revenue Million Forecast, by Geography 2019 & 2032
- Table 21: North America Gas Turbine Power Generation Industry Revenue Million Forecast, by Country 2019 & 2032
- Table 22: North America Gas Turbine Power Generation Industry Revenue Million Forecast, by Capacity 2019 & 2032
- Table 23: North America Gas Turbine Power Generation Industry Revenue Million Forecast, by Type 2019 & 2032
- Table 24: North America Gas Turbine Power Generation Industry Revenue Million Forecast, by End-User Industries 2019 & 2032
- Table 25: North America Gas Turbine Power Generation Industry Revenue Million Forecast, by Geography 2019 & 2032
- Table 26: North America Gas Turbine Power Generation Industry Revenue Million Forecast, by Country 2019 & 2032
Frequently Asked Questions
1. What is the projected Compound Annual Growth Rate (CAGR) of the North America Gas Turbine Power Generation Industry?
The projected CAGR is approximately > 4.50%.
2. Which companies are prominent players in the North America Gas Turbine Power Generation Industry?
Key companies in the market include Solar Turbines Inc, Kawasaki Heavy Industries Ltd, Siemens AG, General Electric Company, Harbin Electric International Company Limited, Capstone Turbine Corporation, Mitsubishi Heavy Industries Ltd, Rolls-Royce Holding PLC.
3. What are the main segments of the North America Gas Turbine Power Generation Industry?
The market segments include Capacity, Type, End-User Industries, Geography.
4. Can you provide details about the market size?
The market size is estimated to be USD XX Million as of 2022.
5. What are some drivers contributing to market growth?
4.; Supportive Government Policies and Incentives4.; Environmental Concerns.
6. What are the notable trends driving market growth?
Power Generation Application is Expected to Dominate the Market.
7. Are there any restraints impacting market growth?
4.; Fossil Fuel Subsidies.
8. Can you provide examples of recent developments in the market?
N/A
9. What pricing options are available for accessing the report?
Pricing options include single-user, multi-user, and enterprise licenses priced at USD 4750, USD 5250, and USD 8750 respectively.
10. Is the market size provided in terms of value or volume?
The market size is provided in terms of value, measured in Million.
11. Are there any specific market keywords associated with the report?
Yes, the market keyword associated with the report is "North America Gas Turbine Power Generation Industry," which aids in identifying and referencing the specific market segment covered.
12. How do I determine which pricing option suits my needs best?
The pricing options vary based on user requirements and access needs. Individual users may opt for single-user licenses, while businesses requiring broader access may choose multi-user or enterprise licenses for cost-effective access to the report.
13. Are there any additional resources or data provided in the North America Gas Turbine Power Generation Industry report?
While the report offers comprehensive insights, it's advisable to review the specific contents or supplementary materials provided to ascertain if additional resources or data are available.
14. How can I stay updated on further developments or reports in the North America Gas Turbine Power Generation Industry?
To stay informed about further developments, trends, and reports in the North America Gas Turbine Power Generation Industry, consider subscribing to industry newsletters, following relevant companies and organizations, or regularly checking reputable industry news sources and publications.
Methodology
Step 1 - Identification of Relevant Samples Size from Population Database


Step 2 - Approaches for Defining Global Market Size (Value, Volume* & Price*)

Note*: In applicable scenarios
Step 3 - Data Sources
Primary Research
- Web Analytics
- Survey Reports
- Research Institute
- Latest Research Reports
- Opinion Leaders
Secondary Research
- Annual Reports
- White Paper
- Latest Press Release
- Industry Association
- Paid Database
- Investor Presentations

Step 4 - Data Triangulation
Involves using different sources of information in order to increase the validity of a study
These sources are likely to be stakeholders in a program - participants, other researchers, program staff, other community members, and so on.
Then we put all data in single framework & apply various statistical tools to find out the dynamic on the market.
During the analysis stage, feedback from the stakeholder groups would be compared to determine areas of agreement as well as areas of divergence
