

Key Insights
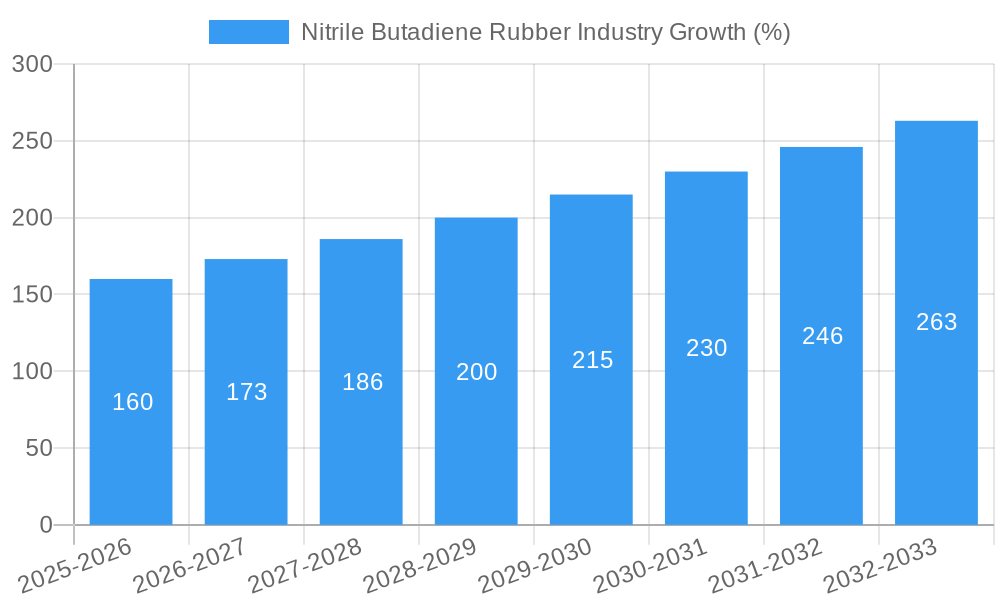
The global nitrile butadiene rubber (NBR) market, valued at $2.51 billion in 2025, is projected to experience robust growth, driven by increasing demand across diverse applications. The automotive and transportation sector remains a significant consumer, fueled by the rising production of vehicles and the need for durable, oil-resistant components like seals and hoses. The building and construction industry also contributes significantly, with NBR finding use in weather stripping, gaskets, and other applications demanding resistance to harsh environmental conditions. The medical sector presents a growing niche market, driven by the demand for sterile, biocompatible materials in medical devices and equipment. The steady CAGR of 6.31% reflects consistent growth across these segments, further fueled by advancements in NBR formulations enhancing properties like temperature resistance and chemical compatibility. This growth is expected to continue, driven by several factors, including increasing industrial automation requiring advanced sealing solutions, growing infrastructure development, and the expanding healthcare industry. However, fluctuations in raw material prices and the potential for substitution by alternative materials present challenges to sustained growth. The Asia-Pacific region, with its burgeoning manufacturing sector and substantial infrastructure projects, is expected to dominate the market, followed by North America and Europe, due to their robust automotive and industrial sectors. Competitive dynamics are influenced by both established players and emerging manufacturers, leading to a blend of innovation and price competition. This dynamic landscape ensures the continued development of higher-performing NBR variants and expansion into new applications, fostering market expansion.
The continuous expansion of the NBR market is projected to be influenced by several long-term trends. The global shift towards sustainable practices is encouraging the development of environmentally friendly NBR formulations. Advancements in polymer chemistry are leading to the creation of specialized NBR grades with enhanced performance characteristics tailored to specific applications. This includes greater resistance to extreme temperatures and chemicals, improving longevity and reliability in demanding environments. Government regulations promoting safety and environmental protection are further driving innovation, stimulating the development of NBR products with reduced environmental impact. The market will likely see further consolidation, with larger companies acquiring smaller players to expand their market share and product portfolios. Regional variations in growth rates will reflect differing economic conditions and industrial development patterns. This necessitates a strategic approach by NBR manufacturers to tailor their product offerings and marketing efforts to meet the specific demands of different geographic markets.
Nitrile Butadiene Rubber (NBR) Industry Market Report: 2019-2033
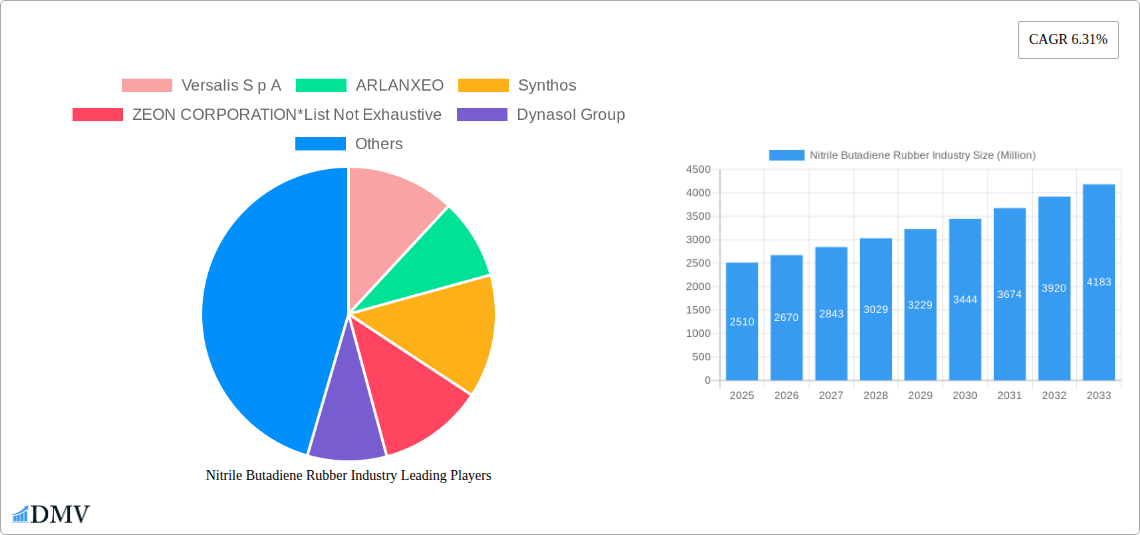
This comprehensive report offers a detailed analysis of the global Nitrile Butadiene Rubber (NBR) industry, providing invaluable insights for stakeholders seeking to understand market dynamics, forecast growth, and identify lucrative opportunities. The report covers the period 2019-2033, with a base year of 2025 and a forecast period of 2025-2033. Key players such as Versalis S.p.A, ARLANXEO, Synthos, ZEON CORPORATION, Dynasol Group, ENEOS Materials Corporation, KUMHO PETROCHEMICAL, SIBUR, Synthomer PLC, LG Chem, China Petrochemical Corporation (Sinopec), Apcotex, Lanxess, and TSRC are analyzed, though this list is not exhaustive. The report segments the market by application (adhesives & sealants, belts & cables, gloves, hoses, gaskets & O-rings, other consumer goods) and end-user industry (automotive & transportation, building & construction, industrial, medical, oil & gas, aerospace). The total market value is predicted to reach xx Million by 2033.
Nitrile Butadiene Rubber Industry Market Composition & Trends
The NBR market exhibits a moderately concentrated landscape, with a few major players holding significant market share. However, the presence of numerous smaller players fosters competition and innovation. Market share distribution fluctuates based on technological advancements, pricing strategies, and regional demand. Mergers and acquisitions (M&A) are relatively frequent, driven by the need for expansion and diversification. Recent M&A deal values have ranged from xx Million to xx Million, indicating significant investment in the sector. Innovation is driven by the demand for improved performance characteristics such as enhanced oil resistance, temperature tolerance, and chemical stability. Stringent regulatory frameworks concerning material safety and environmental impact influence manufacturing processes and product development. The existence of substitute materials, such as ethylene propylene rubber (EPR), presents a competitive challenge.
- Market Concentration: Moderately concentrated, with top 5 players holding approximately xx% of the market share.
- Innovation Catalysts: Demand for improved performance characteristics, stringent environmental regulations.
- Regulatory Landscape: Varying regulations across regions influence manufacturing and product compliance.
- Substitute Products: EPR and other elastomers present competitive challenges.
- End-User Profiles: Diverse end-user industries drive market growth, with automotive and medical sectors showing strong demand.
- M&A Activity: Frequent M&A deals, with average deal values in the xx Million range.
Nitrile Butadiene Rubber Industry Industry Evolution
The NBR industry has witnessed consistent growth over the historical period (2019-2024), with a Compound Annual Growth Rate (CAGR) of xx%. This growth is attributable to factors such as increasing demand from various end-use sectors, particularly automotive and medical, and technological advancements leading to improved product properties. Consumer demands are shifting toward more sustainable and environmentally friendly materials, putting pressure on manufacturers to adopt eco-friendly production processes. Technological advancements, such as the development of specialty NBR compounds with enhanced properties, have expanded the application range of NBR. The adoption rate of these new materials is gradually increasing, with an estimated xx% adoption rate by 2033.
Leading Regions, Countries, or Segments in Nitrile Butadiene Rubber Industry
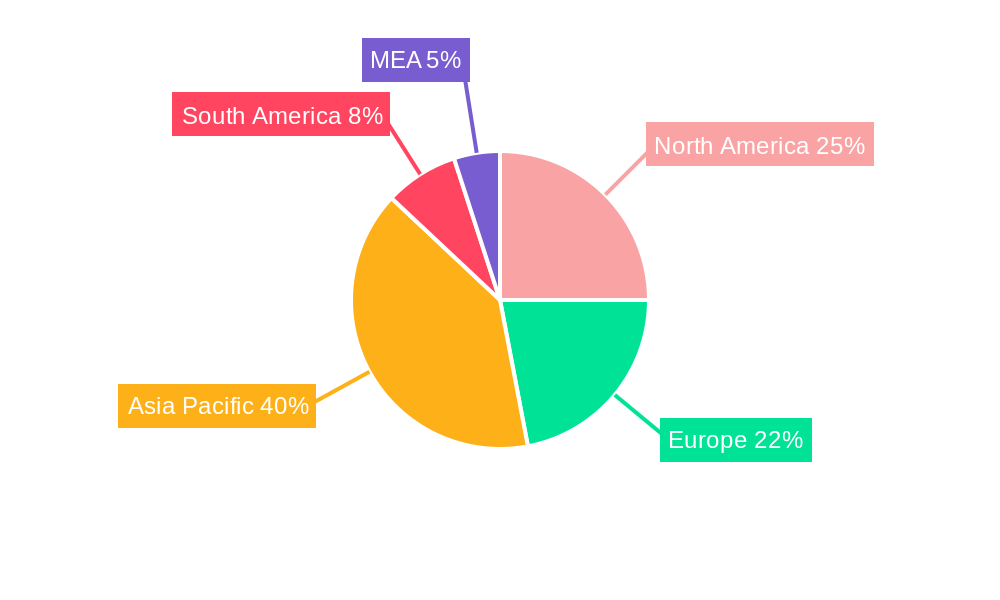
The Asia-Pacific region dominates the global NBR market, driven by robust industrial growth, particularly in China and India. The automotive and construction sectors in this region are major consumers of NBR. Within applications, the gloves segment holds the largest market share due to the massive demand from the healthcare industry.
Key Drivers for Asia-Pacific Dominance:
- Strong industrial growth in emerging economies.
- Significant investments in automotive and infrastructure development.
- Favorable government policies promoting industrial growth.
Key Drivers for Gloves Segment Dominance:
- Rapid growth of the healthcare industry.
- Increasing demand for personal protective equipment (PPE).
- Relatively lower production costs compared to other NBR applications.
In-depth Analysis: The growth of the automotive and medical sectors has significantly fueled demand for NBR, creating a dominant position for these end-use industries.
Nitrile Butadiene Rubber Industry Product Innovations
Recent innovations focus on developing NBR compounds with improved oil resistance, heat resistance, and chemical resistance. These advancements are achieved through modifications to the polymer structure and the incorporation of various additives. Unique selling propositions include enhanced durability, extended lifespan, and improved performance in demanding applications. Technological advancements, such as the use of nanomaterials, are being explored to further improve NBR properties.
Propelling Factors for Nitrile Butadiene Rubber Industry Growth
Technological advancements in polymer chemistry are leading to the development of high-performance NBR grades with improved properties. Economic growth in various regions is fueling demand from diverse end-use industries. Favorable government policies and regulations promoting sustainable materials are boosting market growth. For instance, the increasing demand for automotive components, especially seals and hoses, is significantly driving the market forward.
Obstacles in the Nitrile Butadiene Rubber Industry Market
Fluctuations in raw material prices, particularly butadiene, can impact profitability. Supply chain disruptions caused by geopolitical events or natural disasters can lead to production delays and shortages. Intense competition from substitute materials and the emergence of new technologies pose significant challenges. The quantified impact of these factors on market growth is estimated to be around xx% annually.
Future Opportunities in Nitrile Butadiene Rubber Industry
Emerging markets in developing economies present significant growth potential. The development of biodegradable and recyclable NBR compounds addresses growing environmental concerns and opens new market avenues. The increasing demand for high-performance NBR in specialized applications, such as aerospace and oil & gas, presents lucrative opportunities.
Major Players in the Nitrile Butadiene Rubber Industry Ecosystem
- Versalis S.p.A
- ARLANXEO
- Synthos
- ZEON CORPORATION
- Dynasol Group
- ENEOS Materials Corporation
- KUMHO PETROCHEMICAL
- SIBUR
- Synthomer PLC
- LG Chem
- China Petrochemical Corporation (Sinopec)
- Apcotex
- Lanxess
- TSRC
Key Developments in Nitrile Butadiene Rubber Industry Industry
- August 2022: Kumho Petrochemical announced a KRW 6,000 billion (~USD 5.10 billion) investment plan over five years, with KRW 3,300 billion (~USD 2.81 billion) allocated to core businesses including NB latex and SSBR manufacturing. This signifies a significant expansion in NBR production capacity and reinforces the company's commitment to the industry.
Strategic Nitrile Butadiene Rubber Industry Market Forecast
The NBR market is projected to experience robust growth over the forecast period (2025-2033), driven by technological advancements, expanding end-use applications, and increasing demand from emerging markets. The development of sustainable and high-performance NBR grades will be key factors shaping the future of the market, unlocking significant market potential.
Nitrile Butadiene Rubber Industry Segmentation
-
1. Application
- 1.1. Adhesives and Sealants
- 1.2. Belts and Cables
- 1.3. Gloves
- 1.4. Hoses
- 1.5. Gaskets and O-Rings
- 1.6. Other Applications (Consumer Goods)
-
2. End-user Industry
- 2.1. Automotive and Transportation
- 2.2. Building and Construction
- 2.3. Industrial
- 2.4. Medical
- 2.5. Other End-user Industries (Oil and Gas, Aerospace)
Nitrile Butadiene Rubber Industry Segmentation By Geography
-
1. Asia Pacific
- 1.1. China
- 1.2. India
- 1.3. Japan
- 1.4. South Korea
- 1.5. Malaysia
- 1.6. Thailand
- 1.7. Vietnam
- 1.8. Indonesia
- 1.9. Rest of Asia Pacific
-
2. North America
- 2.1. United States
- 2.2. Canada
- 2.3. Mexico
-
3. Europe
- 3.1. Germany
- 3.2. United Kingdom
- 3.3. Italy
- 3.4. France
- 3.5. Spain
- 3.6. Turkey
- 3.7. Russia
- 3.8. NORDIC
- 3.9. Rest of Europe
-
4. South America
- 4.1. Brazil
- 4.2. Argentina
- 4.3. Colombia
- 4.4. Rest of South America
-
5. Middle East and Africa
- 5.1. Saudi Arabia
- 5.2. South Africa
- 5.3. Nigeria
- 5.4. Egypt
- 5.5. Qatar
- 5.6. UAE
- 5.7. Rest of Middle East and Africa
Nitrile Butadiene Rubber Industry REPORT HIGHLIGHTS
| Aspects | Details |
|---|---|
| Study Period | 2019-2033 |
| Base Year | 2024 |
| Estimated Year | 2025 |
| Forecast Period | 2025-2033 |
| Historical Period | 2019-2024 |
| Growth Rate | CAGR of 6.31% from 2019-2033 |
| Segmentation |
|
Table of Contents
- 1. Introduction
- 1.1. Research Scope
- 1.2. Market Segmentation
- 1.3. Research Methodology
- 1.4. Definitions and Assumptions
- 2. Executive Summary
- 2.1. Introduction
- 3. Market Dynamics
- 3.1. Introduction
- 3.2. Market Drivers
- 3.2.1. Expanding Automotive Industry; Industrial and Infrastructure Development Projects
- 3.3. Market Restrains
- 3.3.1. Availability of Substitute Materials; Fluctuating Raw Material Prices
- 3.4. Market Trends
- 3.4.1. Automotive and Transportation Sector Dominates the Market
- 4. Market Factor Analysis
- 4.1. Porters Five Forces
- 4.2. Supply/Value Chain
- 4.3. PESTEL analysis
- 4.4. Market Entropy
- 4.5. Patent/Trademark Analysis
- 5. Global Nitrile Butadiene Rubber Industry Analysis, Insights and Forecast, 2019-2031
- 5.1. Market Analysis, Insights and Forecast - by Application
- 5.1.1. Adhesives and Sealants
- 5.1.2. Belts and Cables
- 5.1.3. Gloves
- 5.1.4. Hoses
- 5.1.5. Gaskets and O-Rings
- 5.1.6. Other Applications (Consumer Goods)
- 5.2. Market Analysis, Insights and Forecast - by End-user Industry
- 5.2.1. Automotive and Transportation
- 5.2.2. Building and Construction
- 5.2.3. Industrial
- 5.2.4. Medical
- 5.2.5. Other End-user Industries (Oil and Gas, Aerospace)
- 5.3. Market Analysis, Insights and Forecast - by Region
- 5.3.1. Asia Pacific
- 5.3.2. North America
- 5.3.3. Europe
- 5.3.4. South America
- 5.3.5. Middle East and Africa
- 5.1. Market Analysis, Insights and Forecast - by Application
- 6. Asia Pacific Nitrile Butadiene Rubber Industry Analysis, Insights and Forecast, 2019-2031
- 6.1. Market Analysis, Insights and Forecast - by Application
- 6.1.1. Adhesives and Sealants
- 6.1.2. Belts and Cables
- 6.1.3. Gloves
- 6.1.4. Hoses
- 6.1.5. Gaskets and O-Rings
- 6.1.6. Other Applications (Consumer Goods)
- 6.2. Market Analysis, Insights and Forecast - by End-user Industry
- 6.2.1. Automotive and Transportation
- 6.2.2. Building and Construction
- 6.2.3. Industrial
- 6.2.4. Medical
- 6.2.5. Other End-user Industries (Oil and Gas, Aerospace)
- 6.1. Market Analysis, Insights and Forecast - by Application
- 7. North America Nitrile Butadiene Rubber Industry Analysis, Insights and Forecast, 2019-2031
- 7.1. Market Analysis, Insights and Forecast - by Application
- 7.1.1. Adhesives and Sealants
- 7.1.2. Belts and Cables
- 7.1.3. Gloves
- 7.1.4. Hoses
- 7.1.5. Gaskets and O-Rings
- 7.1.6. Other Applications (Consumer Goods)
- 7.2. Market Analysis, Insights and Forecast - by End-user Industry
- 7.2.1. Automotive and Transportation
- 7.2.2. Building and Construction
- 7.2.3. Industrial
- 7.2.4. Medical
- 7.2.5. Other End-user Industries (Oil and Gas, Aerospace)
- 7.1. Market Analysis, Insights and Forecast - by Application
- 8. Europe Nitrile Butadiene Rubber Industry Analysis, Insights and Forecast, 2019-2031
- 8.1. Market Analysis, Insights and Forecast - by Application
- 8.1.1. Adhesives and Sealants
- 8.1.2. Belts and Cables
- 8.1.3. Gloves
- 8.1.4. Hoses
- 8.1.5. Gaskets and O-Rings
- 8.1.6. Other Applications (Consumer Goods)
- 8.2. Market Analysis, Insights and Forecast - by End-user Industry
- 8.2.1. Automotive and Transportation
- 8.2.2. Building and Construction
- 8.2.3. Industrial
- 8.2.4. Medical
- 8.2.5. Other End-user Industries (Oil and Gas, Aerospace)
- 8.1. Market Analysis, Insights and Forecast - by Application
- 9. South America Nitrile Butadiene Rubber Industry Analysis, Insights and Forecast, 2019-2031
- 9.1. Market Analysis, Insights and Forecast - by Application
- 9.1.1. Adhesives and Sealants
- 9.1.2. Belts and Cables
- 9.1.3. Gloves
- 9.1.4. Hoses
- 9.1.5. Gaskets and O-Rings
- 9.1.6. Other Applications (Consumer Goods)
- 9.2. Market Analysis, Insights and Forecast - by End-user Industry
- 9.2.1. Automotive and Transportation
- 9.2.2. Building and Construction
- 9.2.3. Industrial
- 9.2.4. Medical
- 9.2.5. Other End-user Industries (Oil and Gas, Aerospace)
- 9.1. Market Analysis, Insights and Forecast - by Application
- 10. Middle East and Africa Nitrile Butadiene Rubber Industry Analysis, Insights and Forecast, 2019-2031
- 10.1. Market Analysis, Insights and Forecast - by Application
- 10.1.1. Adhesives and Sealants
- 10.1.2. Belts and Cables
- 10.1.3. Gloves
- 10.1.4. Hoses
- 10.1.5. Gaskets and O-Rings
- 10.1.6. Other Applications (Consumer Goods)
- 10.2. Market Analysis, Insights and Forecast - by End-user Industry
- 10.2.1. Automotive and Transportation
- 10.2.2. Building and Construction
- 10.2.3. Industrial
- 10.2.4. Medical
- 10.2.5. Other End-user Industries (Oil and Gas, Aerospace)
- 10.1. Market Analysis, Insights and Forecast - by Application
- 11. North America Nitrile Butadiene Rubber Industry Analysis, Insights and Forecast, 2019-2031
- 11.1. Market Analysis, Insights and Forecast - By Country/Sub-region
- 11.1.1 United States
- 11.1.2 Canada
- 11.1.3 Mexico
- 12. Europe Nitrile Butadiene Rubber Industry Analysis, Insights and Forecast, 2019-2031
- 12.1. Market Analysis, Insights and Forecast - By Country/Sub-region
- 12.1.1 Germany
- 12.1.2 France
- 12.1.3 Italy
- 12.1.4 United Kingdom
- 12.1.5 Netherlands
- 12.1.6 Rest of Europe
- 13. Asia Pacific Nitrile Butadiene Rubber Industry Analysis, Insights and Forecast, 2019-2031
- 13.1. Market Analysis, Insights and Forecast - By Country/Sub-region
- 13.1.1 China
- 13.1.2 Japan
- 13.1.3 India
- 13.1.4 South Korea
- 13.1.5 Taiwan
- 13.1.6 Australia
- 13.1.7 Rest of Asia-Pacific
- 14. South America Nitrile Butadiene Rubber Industry Analysis, Insights and Forecast, 2019-2031
- 14.1. Market Analysis, Insights and Forecast - By Country/Sub-region
- 14.1.1 Brazil
- 14.1.2 Argentina
- 14.1.3 Rest of South America
- 15. MEA Nitrile Butadiene Rubber Industry Analysis, Insights and Forecast, 2019-2031
- 15.1. Market Analysis, Insights and Forecast - By Country/Sub-region
- 15.1.1 Middle East
- 15.1.2 Africa
- 16. Competitive Analysis
- 16.1. Global Market Share Analysis 2024
- 16.2. Company Profiles
- 16.2.1 Versalis S p A
- 16.2.1.1. Overview
- 16.2.1.2. Products
- 16.2.1.3. SWOT Analysis
- 16.2.1.4. Recent Developments
- 16.2.1.5. Financials (Based on Availability)
- 16.2.2 ARLANXEO
- 16.2.2.1. Overview
- 16.2.2.2. Products
- 16.2.2.3. SWOT Analysis
- 16.2.2.4. Recent Developments
- 16.2.2.5. Financials (Based on Availability)
- 16.2.3 Synthos
- 16.2.3.1. Overview
- 16.2.3.2. Products
- 16.2.3.3. SWOT Analysis
- 16.2.3.4. Recent Developments
- 16.2.3.5. Financials (Based on Availability)
- 16.2.4 ZEON CORPORATION*List Not Exhaustive
- 16.2.4.1. Overview
- 16.2.4.2. Products
- 16.2.4.3. SWOT Analysis
- 16.2.4.4. Recent Developments
- 16.2.4.5. Financials (Based on Availability)
- 16.2.5 Dynasol Group
- 16.2.5.1. Overview
- 16.2.5.2. Products
- 16.2.5.3. SWOT Analysis
- 16.2.5.4. Recent Developments
- 16.2.5.5. Financials (Based on Availability)
- 16.2.6 ENEOS Materials Corporation
- 16.2.6.1. Overview
- 16.2.6.2. Products
- 16.2.6.3. SWOT Analysis
- 16.2.6.4. Recent Developments
- 16.2.6.5. Financials (Based on Availability)
- 16.2.7 KUMHO PETROCHEMICAL
- 16.2.7.1. Overview
- 16.2.7.2. Products
- 16.2.7.3. SWOT Analysis
- 16.2.7.4. Recent Developments
- 16.2.7.5. Financials (Based on Availability)
- 16.2.8 SIBUR
- 16.2.8.1. Overview
- 16.2.8.2. Products
- 16.2.8.3. SWOT Analysis
- 16.2.8.4. Recent Developments
- 16.2.8.5. Financials (Based on Availability)
- 16.2.9 Synthomer PLC
- 16.2.9.1. Overview
- 16.2.9.2. Products
- 16.2.9.3. SWOT Analysis
- 16.2.9.4. Recent Developments
- 16.2.9.5. Financials (Based on Availability)
- 16.2.10 LG Chem
- 16.2.10.1. Overview
- 16.2.10.2. Products
- 16.2.10.3. SWOT Analysis
- 16.2.10.4. Recent Developments
- 16.2.10.5. Financials (Based on Availability)
- 16.2.11 China Petrochemical Corporation (Sinopec)
- 16.2.11.1. Overview
- 16.2.11.2. Products
- 16.2.11.3. SWOT Analysis
- 16.2.11.4. Recent Developments
- 16.2.11.5. Financials (Based on Availability)
- 16.2.12 Apcotex
- 16.2.12.1. Overview
- 16.2.12.2. Products
- 16.2.12.3. SWOT Analysis
- 16.2.12.4. Recent Developments
- 16.2.12.5. Financials (Based on Availability)
- 16.2.13 Lanxess
- 16.2.13.1. Overview
- 16.2.13.2. Products
- 16.2.13.3. SWOT Analysis
- 16.2.13.4. Recent Developments
- 16.2.13.5. Financials (Based on Availability)
- 16.2.14 TSRC
- 16.2.14.1. Overview
- 16.2.14.2. Products
- 16.2.14.3. SWOT Analysis
- 16.2.14.4. Recent Developments
- 16.2.14.5. Financials (Based on Availability)
- 16.2.1 Versalis S p A
List of Figures
- Figure 1: Global Nitrile Butadiene Rubber Industry Revenue Breakdown (Million, %) by Region 2024 & 2032
- Figure 2: Global Nitrile Butadiene Rubber Industry Volume Breakdown (K Tons, %) by Region 2024 & 2032
- Figure 3: North America Nitrile Butadiene Rubber Industry Revenue (Million), by Country 2024 & 2032
- Figure 4: North America Nitrile Butadiene Rubber Industry Volume (K Tons), by Country 2024 & 2032
- Figure 5: North America Nitrile Butadiene Rubber Industry Revenue Share (%), by Country 2024 & 2032
- Figure 6: North America Nitrile Butadiene Rubber Industry Volume Share (%), by Country 2024 & 2032
- Figure 7: Europe Nitrile Butadiene Rubber Industry Revenue (Million), by Country 2024 & 2032
- Figure 8: Europe Nitrile Butadiene Rubber Industry Volume (K Tons), by Country 2024 & 2032
- Figure 9: Europe Nitrile Butadiene Rubber Industry Revenue Share (%), by Country 2024 & 2032
- Figure 10: Europe Nitrile Butadiene Rubber Industry Volume Share (%), by Country 2024 & 2032
- Figure 11: Asia Pacific Nitrile Butadiene Rubber Industry Revenue (Million), by Country 2024 & 2032
- Figure 12: Asia Pacific Nitrile Butadiene Rubber Industry Volume (K Tons), by Country 2024 & 2032
- Figure 13: Asia Pacific Nitrile Butadiene Rubber Industry Revenue Share (%), by Country 2024 & 2032
- Figure 14: Asia Pacific Nitrile Butadiene Rubber Industry Volume Share (%), by Country 2024 & 2032
- Figure 15: South America Nitrile Butadiene Rubber Industry Revenue (Million), by Country 2024 & 2032
- Figure 16: South America Nitrile Butadiene Rubber Industry Volume (K Tons), by Country 2024 & 2032
- Figure 17: South America Nitrile Butadiene Rubber Industry Revenue Share (%), by Country 2024 & 2032
- Figure 18: South America Nitrile Butadiene Rubber Industry Volume Share (%), by Country 2024 & 2032
- Figure 19: MEA Nitrile Butadiene Rubber Industry Revenue (Million), by Country 2024 & 2032
- Figure 20: MEA Nitrile Butadiene Rubber Industry Volume (K Tons), by Country 2024 & 2032
- Figure 21: MEA Nitrile Butadiene Rubber Industry Revenue Share (%), by Country 2024 & 2032
- Figure 22: MEA Nitrile Butadiene Rubber Industry Volume Share (%), by Country 2024 & 2032
- Figure 23: Asia Pacific Nitrile Butadiene Rubber Industry Revenue (Million), by Application 2024 & 2032
- Figure 24: Asia Pacific Nitrile Butadiene Rubber Industry Volume (K Tons), by Application 2024 & 2032
- Figure 25: Asia Pacific Nitrile Butadiene Rubber Industry Revenue Share (%), by Application 2024 & 2032
- Figure 26: Asia Pacific Nitrile Butadiene Rubber Industry Volume Share (%), by Application 2024 & 2032
- Figure 27: Asia Pacific Nitrile Butadiene Rubber Industry Revenue (Million), by End-user Industry 2024 & 2032
- Figure 28: Asia Pacific Nitrile Butadiene Rubber Industry Volume (K Tons), by End-user Industry 2024 & 2032
- Figure 29: Asia Pacific Nitrile Butadiene Rubber Industry Revenue Share (%), by End-user Industry 2024 & 2032
- Figure 30: Asia Pacific Nitrile Butadiene Rubber Industry Volume Share (%), by End-user Industry 2024 & 2032
- Figure 31: Asia Pacific Nitrile Butadiene Rubber Industry Revenue (Million), by Country 2024 & 2032
- Figure 32: Asia Pacific Nitrile Butadiene Rubber Industry Volume (K Tons), by Country 2024 & 2032
- Figure 33: Asia Pacific Nitrile Butadiene Rubber Industry Revenue Share (%), by Country 2024 & 2032
- Figure 34: Asia Pacific Nitrile Butadiene Rubber Industry Volume Share (%), by Country 2024 & 2032
- Figure 35: North America Nitrile Butadiene Rubber Industry Revenue (Million), by Application 2024 & 2032
- Figure 36: North America Nitrile Butadiene Rubber Industry Volume (K Tons), by Application 2024 & 2032
- Figure 37: North America Nitrile Butadiene Rubber Industry Revenue Share (%), by Application 2024 & 2032
- Figure 38: North America Nitrile Butadiene Rubber Industry Volume Share (%), by Application 2024 & 2032
- Figure 39: North America Nitrile Butadiene Rubber Industry Revenue (Million), by End-user Industry 2024 & 2032
- Figure 40: North America Nitrile Butadiene Rubber Industry Volume (K Tons), by End-user Industry 2024 & 2032
- Figure 41: North America Nitrile Butadiene Rubber Industry Revenue Share (%), by End-user Industry 2024 & 2032
- Figure 42: North America Nitrile Butadiene Rubber Industry Volume Share (%), by End-user Industry 2024 & 2032
- Figure 43: North America Nitrile Butadiene Rubber Industry Revenue (Million), by Country 2024 & 2032
- Figure 44: North America Nitrile Butadiene Rubber Industry Volume (K Tons), by Country 2024 & 2032
- Figure 45: North America Nitrile Butadiene Rubber Industry Revenue Share (%), by Country 2024 & 2032
- Figure 46: North America Nitrile Butadiene Rubber Industry Volume Share (%), by Country 2024 & 2032
- Figure 47: Europe Nitrile Butadiene Rubber Industry Revenue (Million), by Application 2024 & 2032
- Figure 48: Europe Nitrile Butadiene Rubber Industry Volume (K Tons), by Application 2024 & 2032
- Figure 49: Europe Nitrile Butadiene Rubber Industry Revenue Share (%), by Application 2024 & 2032
- Figure 50: Europe Nitrile Butadiene Rubber Industry Volume Share (%), by Application 2024 & 2032
- Figure 51: Europe Nitrile Butadiene Rubber Industry Revenue (Million), by End-user Industry 2024 & 2032
- Figure 52: Europe Nitrile Butadiene Rubber Industry Volume (K Tons), by End-user Industry 2024 & 2032
- Figure 53: Europe Nitrile Butadiene Rubber Industry Revenue Share (%), by End-user Industry 2024 & 2032
- Figure 54: Europe Nitrile Butadiene Rubber Industry Volume Share (%), by End-user Industry 2024 & 2032
- Figure 55: Europe Nitrile Butadiene Rubber Industry Revenue (Million), by Country 2024 & 2032
- Figure 56: Europe Nitrile Butadiene Rubber Industry Volume (K Tons), by Country 2024 & 2032
- Figure 57: Europe Nitrile Butadiene Rubber Industry Revenue Share (%), by Country 2024 & 2032
- Figure 58: Europe Nitrile Butadiene Rubber Industry Volume Share (%), by Country 2024 & 2032
- Figure 59: South America Nitrile Butadiene Rubber Industry Revenue (Million), by Application 2024 & 2032
- Figure 60: South America Nitrile Butadiene Rubber Industry Volume (K Tons), by Application 2024 & 2032
- Figure 61: South America Nitrile Butadiene Rubber Industry Revenue Share (%), by Application 2024 & 2032
- Figure 62: South America Nitrile Butadiene Rubber Industry Volume Share (%), by Application 2024 & 2032
- Figure 63: South America Nitrile Butadiene Rubber Industry Revenue (Million), by End-user Industry 2024 & 2032
- Figure 64: South America Nitrile Butadiene Rubber Industry Volume (K Tons), by End-user Industry 2024 & 2032
- Figure 65: South America Nitrile Butadiene Rubber Industry Revenue Share (%), by End-user Industry 2024 & 2032
- Figure 66: South America Nitrile Butadiene Rubber Industry Volume Share (%), by End-user Industry 2024 & 2032
- Figure 67: South America Nitrile Butadiene Rubber Industry Revenue (Million), by Country 2024 & 2032
- Figure 68: South America Nitrile Butadiene Rubber Industry Volume (K Tons), by Country 2024 & 2032
- Figure 69: South America Nitrile Butadiene Rubber Industry Revenue Share (%), by Country 2024 & 2032
- Figure 70: South America Nitrile Butadiene Rubber Industry Volume Share (%), by Country 2024 & 2032
- Figure 71: Middle East and Africa Nitrile Butadiene Rubber Industry Revenue (Million), by Application 2024 & 2032
- Figure 72: Middle East and Africa Nitrile Butadiene Rubber Industry Volume (K Tons), by Application 2024 & 2032
- Figure 73: Middle East and Africa Nitrile Butadiene Rubber Industry Revenue Share (%), by Application 2024 & 2032
- Figure 74: Middle East and Africa Nitrile Butadiene Rubber Industry Volume Share (%), by Application 2024 & 2032
- Figure 75: Middle East and Africa Nitrile Butadiene Rubber Industry Revenue (Million), by End-user Industry 2024 & 2032
- Figure 76: Middle East and Africa Nitrile Butadiene Rubber Industry Volume (K Tons), by End-user Industry 2024 & 2032
- Figure 77: Middle East and Africa Nitrile Butadiene Rubber Industry Revenue Share (%), by End-user Industry 2024 & 2032
- Figure 78: Middle East and Africa Nitrile Butadiene Rubber Industry Volume Share (%), by End-user Industry 2024 & 2032
- Figure 79: Middle East and Africa Nitrile Butadiene Rubber Industry Revenue (Million), by Country 2024 & 2032
- Figure 80: Middle East and Africa Nitrile Butadiene Rubber Industry Volume (K Tons), by Country 2024 & 2032
- Figure 81: Middle East and Africa Nitrile Butadiene Rubber Industry Revenue Share (%), by Country 2024 & 2032
- Figure 82: Middle East and Africa Nitrile Butadiene Rubber Industry Volume Share (%), by Country 2024 & 2032
List of Tables
- Table 1: Global Nitrile Butadiene Rubber Industry Revenue Million Forecast, by Region 2019 & 2032
- Table 2: Global Nitrile Butadiene Rubber Industry Volume K Tons Forecast, by Region 2019 & 2032
- Table 3: Global Nitrile Butadiene Rubber Industry Revenue Million Forecast, by Application 2019 & 2032
- Table 4: Global Nitrile Butadiene Rubber Industry Volume K Tons Forecast, by Application 2019 & 2032
- Table 5: Global Nitrile Butadiene Rubber Industry Revenue Million Forecast, by End-user Industry 2019 & 2032
- Table 6: Global Nitrile Butadiene Rubber Industry Volume K Tons Forecast, by End-user Industry 2019 & 2032
- Table 7: Global Nitrile Butadiene Rubber Industry Revenue Million Forecast, by Region 2019 & 2032
- Table 8: Global Nitrile Butadiene Rubber Industry Volume K Tons Forecast, by Region 2019 & 2032
- Table 9: Global Nitrile Butadiene Rubber Industry Revenue Million Forecast, by Country 2019 & 2032
- Table 10: Global Nitrile Butadiene Rubber Industry Volume K Tons Forecast, by Country 2019 & 2032
- Table 11: United States Nitrile Butadiene Rubber Industry Revenue (Million) Forecast, by Application 2019 & 2032
- Table 12: United States Nitrile Butadiene Rubber Industry Volume (K Tons) Forecast, by Application 2019 & 2032
- Table 13: Canada Nitrile Butadiene Rubber Industry Revenue (Million) Forecast, by Application 2019 & 2032
- Table 14: Canada Nitrile Butadiene Rubber Industry Volume (K Tons) Forecast, by Application 2019 & 2032
- Table 15: Mexico Nitrile Butadiene Rubber Industry Revenue (Million) Forecast, by Application 2019 & 2032
- Table 16: Mexico Nitrile Butadiene Rubber Industry Volume (K Tons) Forecast, by Application 2019 & 2032
- Table 17: Global Nitrile Butadiene Rubber Industry Revenue Million Forecast, by Country 2019 & 2032
- Table 18: Global Nitrile Butadiene Rubber Industry Volume K Tons Forecast, by Country 2019 & 2032
- Table 19: Germany Nitrile Butadiene Rubber Industry Revenue (Million) Forecast, by Application 2019 & 2032
- Table 20: Germany Nitrile Butadiene Rubber Industry Volume (K Tons) Forecast, by Application 2019 & 2032
- Table 21: France Nitrile Butadiene Rubber Industry Revenue (Million) Forecast, by Application 2019 & 2032
- Table 22: France Nitrile Butadiene Rubber Industry Volume (K Tons) Forecast, by Application 2019 & 2032
- Table 23: Italy Nitrile Butadiene Rubber Industry Revenue (Million) Forecast, by Application 2019 & 2032
- Table 24: Italy Nitrile Butadiene Rubber Industry Volume (K Tons) Forecast, by Application 2019 & 2032
- Table 25: United Kingdom Nitrile Butadiene Rubber Industry Revenue (Million) Forecast, by Application 2019 & 2032
- Table 26: United Kingdom Nitrile Butadiene Rubber Industry Volume (K Tons) Forecast, by Application 2019 & 2032
- Table 27: Netherlands Nitrile Butadiene Rubber Industry Revenue (Million) Forecast, by Application 2019 & 2032
- Table 28: Netherlands Nitrile Butadiene Rubber Industry Volume (K Tons) Forecast, by Application 2019 & 2032
- Table 29: Rest of Europe Nitrile Butadiene Rubber Industry Revenue (Million) Forecast, by Application 2019 & 2032
- Table 30: Rest of Europe Nitrile Butadiene Rubber Industry Volume (K Tons) Forecast, by Application 2019 & 2032
- Table 31: Global Nitrile Butadiene Rubber Industry Revenue Million Forecast, by Country 2019 & 2032
- Table 32: Global Nitrile Butadiene Rubber Industry Volume K Tons Forecast, by Country 2019 & 2032
- Table 33: China Nitrile Butadiene Rubber Industry Revenue (Million) Forecast, by Application 2019 & 2032
- Table 34: China Nitrile Butadiene Rubber Industry Volume (K Tons) Forecast, by Application 2019 & 2032
- Table 35: Japan Nitrile Butadiene Rubber Industry Revenue (Million) Forecast, by Application 2019 & 2032
- Table 36: Japan Nitrile Butadiene Rubber Industry Volume (K Tons) Forecast, by Application 2019 & 2032
- Table 37: India Nitrile Butadiene Rubber Industry Revenue (Million) Forecast, by Application 2019 & 2032
- Table 38: India Nitrile Butadiene Rubber Industry Volume (K Tons) Forecast, by Application 2019 & 2032
- Table 39: South Korea Nitrile Butadiene Rubber Industry Revenue (Million) Forecast, by Application 2019 & 2032
- Table 40: South Korea Nitrile Butadiene Rubber Industry Volume (K Tons) Forecast, by Application 2019 & 2032
- Table 41: Taiwan Nitrile Butadiene Rubber Industry Revenue (Million) Forecast, by Application 2019 & 2032
- Table 42: Taiwan Nitrile Butadiene Rubber Industry Volume (K Tons) Forecast, by Application 2019 & 2032
- Table 43: Australia Nitrile Butadiene Rubber Industry Revenue (Million) Forecast, by Application 2019 & 2032
- Table 44: Australia Nitrile Butadiene Rubber Industry Volume (K Tons) Forecast, by Application 2019 & 2032
- Table 45: Rest of Asia-Pacific Nitrile Butadiene Rubber Industry Revenue (Million) Forecast, by Application 2019 & 2032
- Table 46: Rest of Asia-Pacific Nitrile Butadiene Rubber Industry Volume (K Tons) Forecast, by Application 2019 & 2032
- Table 47: Global Nitrile Butadiene Rubber Industry Revenue Million Forecast, by Country 2019 & 2032
- Table 48: Global Nitrile Butadiene Rubber Industry Volume K Tons Forecast, by Country 2019 & 2032
- Table 49: Brazil Nitrile Butadiene Rubber Industry Revenue (Million) Forecast, by Application 2019 & 2032
- Table 50: Brazil Nitrile Butadiene Rubber Industry Volume (K Tons) Forecast, by Application 2019 & 2032
- Table 51: Argentina Nitrile Butadiene Rubber Industry Revenue (Million) Forecast, by Application 2019 & 2032
- Table 52: Argentina Nitrile Butadiene Rubber Industry Volume (K Tons) Forecast, by Application 2019 & 2032
- Table 53: Rest of South America Nitrile Butadiene Rubber Industry Revenue (Million) Forecast, by Application 2019 & 2032
- Table 54: Rest of South America Nitrile Butadiene Rubber Industry Volume (K Tons) Forecast, by Application 2019 & 2032
- Table 55: Global Nitrile Butadiene Rubber Industry Revenue Million Forecast, by Country 2019 & 2032
- Table 56: Global Nitrile Butadiene Rubber Industry Volume K Tons Forecast, by Country 2019 & 2032
- Table 57: Middle East Nitrile Butadiene Rubber Industry Revenue (Million) Forecast, by Application 2019 & 2032
- Table 58: Middle East Nitrile Butadiene Rubber Industry Volume (K Tons) Forecast, by Application 2019 & 2032
- Table 59: Africa Nitrile Butadiene Rubber Industry Revenue (Million) Forecast, by Application 2019 & 2032
- Table 60: Africa Nitrile Butadiene Rubber Industry Volume (K Tons) Forecast, by Application 2019 & 2032
- Table 61: Global Nitrile Butadiene Rubber Industry Revenue Million Forecast, by Application 2019 & 2032
- Table 62: Global Nitrile Butadiene Rubber Industry Volume K Tons Forecast, by Application 2019 & 2032
- Table 63: Global Nitrile Butadiene Rubber Industry Revenue Million Forecast, by End-user Industry 2019 & 2032
- Table 64: Global Nitrile Butadiene Rubber Industry Volume K Tons Forecast, by End-user Industry 2019 & 2032
- Table 65: Global Nitrile Butadiene Rubber Industry Revenue Million Forecast, by Country 2019 & 2032
- Table 66: Global Nitrile Butadiene Rubber Industry Volume K Tons Forecast, by Country 2019 & 2032
- Table 67: China Nitrile Butadiene Rubber Industry Revenue (Million) Forecast, by Application 2019 & 2032
- Table 68: China Nitrile Butadiene Rubber Industry Volume (K Tons) Forecast, by Application 2019 & 2032
- Table 69: India Nitrile Butadiene Rubber Industry Revenue (Million) Forecast, by Application 2019 & 2032
- Table 70: India Nitrile Butadiene Rubber Industry Volume (K Tons) Forecast, by Application 2019 & 2032
- Table 71: Japan Nitrile Butadiene Rubber Industry Revenue (Million) Forecast, by Application 2019 & 2032
- Table 72: Japan Nitrile Butadiene Rubber Industry Volume (K Tons) Forecast, by Application 2019 & 2032
- Table 73: South Korea Nitrile Butadiene Rubber Industry Revenue (Million) Forecast, by Application 2019 & 2032
- Table 74: South Korea Nitrile Butadiene Rubber Industry Volume (K Tons) Forecast, by Application 2019 & 2032
- Table 75: Malaysia Nitrile Butadiene Rubber Industry Revenue (Million) Forecast, by Application 2019 & 2032
- Table 76: Malaysia Nitrile Butadiene Rubber Industry Volume (K Tons) Forecast, by Application 2019 & 2032
- Table 77: Thailand Nitrile Butadiene Rubber Industry Revenue (Million) Forecast, by Application 2019 & 2032
- Table 78: Thailand Nitrile Butadiene Rubber Industry Volume (K Tons) Forecast, by Application 2019 & 2032
- Table 79: Vietnam Nitrile Butadiene Rubber Industry Revenue (Million) Forecast, by Application 2019 & 2032
- Table 80: Vietnam Nitrile Butadiene Rubber Industry Volume (K Tons) Forecast, by Application 2019 & 2032
- Table 81: Indonesia Nitrile Butadiene Rubber Industry Revenue (Million) Forecast, by Application 2019 & 2032
- Table 82: Indonesia Nitrile Butadiene Rubber Industry Volume (K Tons) Forecast, by Application 2019 & 2032
- Table 83: Rest of Asia Pacific Nitrile Butadiene Rubber Industry Revenue (Million) Forecast, by Application 2019 & 2032
- Table 84: Rest of Asia Pacific Nitrile Butadiene Rubber Industry Volume (K Tons) Forecast, by Application 2019 & 2032
- Table 85: Global Nitrile Butadiene Rubber Industry Revenue Million Forecast, by Application 2019 & 2032
- Table 86: Global Nitrile Butadiene Rubber Industry Volume K Tons Forecast, by Application 2019 & 2032
- Table 87: Global Nitrile Butadiene Rubber Industry Revenue Million Forecast, by End-user Industry 2019 & 2032
- Table 88: Global Nitrile Butadiene Rubber Industry Volume K Tons Forecast, by End-user Industry 2019 & 2032
- Table 89: Global Nitrile Butadiene Rubber Industry Revenue Million Forecast, by Country 2019 & 2032
- Table 90: Global Nitrile Butadiene Rubber Industry Volume K Tons Forecast, by Country 2019 & 2032
- Table 91: United States Nitrile Butadiene Rubber Industry Revenue (Million) Forecast, by Application 2019 & 2032
- Table 92: United States Nitrile Butadiene Rubber Industry Volume (K Tons) Forecast, by Application 2019 & 2032
- Table 93: Canada Nitrile Butadiene Rubber Industry Revenue (Million) Forecast, by Application 2019 & 2032
- Table 94: Canada Nitrile Butadiene Rubber Industry Volume (K Tons) Forecast, by Application 2019 & 2032
- Table 95: Mexico Nitrile Butadiene Rubber Industry Revenue (Million) Forecast, by Application 2019 & 2032
- Table 96: Mexico Nitrile Butadiene Rubber Industry Volume (K Tons) Forecast, by Application 2019 & 2032
- Table 97: Global Nitrile Butadiene Rubber Industry Revenue Million Forecast, by Application 2019 & 2032
- Table 98: Global Nitrile Butadiene Rubber Industry Volume K Tons Forecast, by Application 2019 & 2032
- Table 99: Global Nitrile Butadiene Rubber Industry Revenue Million Forecast, by End-user Industry 2019 & 2032
- Table 100: Global Nitrile Butadiene Rubber Industry Volume K Tons Forecast, by End-user Industry 2019 & 2032
- Table 101: Global Nitrile Butadiene Rubber Industry Revenue Million Forecast, by Country 2019 & 2032
- Table 102: Global Nitrile Butadiene Rubber Industry Volume K Tons Forecast, by Country 2019 & 2032
- Table 103: Germany Nitrile Butadiene Rubber Industry Revenue (Million) Forecast, by Application 2019 & 2032
- Table 104: Germany Nitrile Butadiene Rubber Industry Volume (K Tons) Forecast, by Application 2019 & 2032
- Table 105: United Kingdom Nitrile Butadiene Rubber Industry Revenue (Million) Forecast, by Application 2019 & 2032
- Table 106: United Kingdom Nitrile Butadiene Rubber Industry Volume (K Tons) Forecast, by Application 2019 & 2032
- Table 107: Italy Nitrile Butadiene Rubber Industry Revenue (Million) Forecast, by Application 2019 & 2032
- Table 108: Italy Nitrile Butadiene Rubber Industry Volume (K Tons) Forecast, by Application 2019 & 2032
- Table 109: France Nitrile Butadiene Rubber Industry Revenue (Million) Forecast, by Application 2019 & 2032
- Table 110: France Nitrile Butadiene Rubber Industry Volume (K Tons) Forecast, by Application 2019 & 2032
- Table 111: Spain Nitrile Butadiene Rubber Industry Revenue (Million) Forecast, by Application 2019 & 2032
- Table 112: Spain Nitrile Butadiene Rubber Industry Volume (K Tons) Forecast, by Application 2019 & 2032
- Table 113: Turkey Nitrile Butadiene Rubber Industry Revenue (Million) Forecast, by Application 2019 & 2032
- Table 114: Turkey Nitrile Butadiene Rubber Industry Volume (K Tons) Forecast, by Application 2019 & 2032
- Table 115: Russia Nitrile Butadiene Rubber Industry Revenue (Million) Forecast, by Application 2019 & 2032
- Table 116: Russia Nitrile Butadiene Rubber Industry Volume (K Tons) Forecast, by Application 2019 & 2032
- Table 117: NORDIC Nitrile Butadiene Rubber Industry Revenue (Million) Forecast, by Application 2019 & 2032
- Table 118: NORDIC Nitrile Butadiene Rubber Industry Volume (K Tons) Forecast, by Application 2019 & 2032
- Table 119: Rest of Europe Nitrile Butadiene Rubber Industry Revenue (Million) Forecast, by Application 2019 & 2032
- Table 120: Rest of Europe Nitrile Butadiene Rubber Industry Volume (K Tons) Forecast, by Application 2019 & 2032
- Table 121: Global Nitrile Butadiene Rubber Industry Revenue Million Forecast, by Application 2019 & 2032
- Table 122: Global Nitrile Butadiene Rubber Industry Volume K Tons Forecast, by Application 2019 & 2032
- Table 123: Global Nitrile Butadiene Rubber Industry Revenue Million Forecast, by End-user Industry 2019 & 2032
- Table 124: Global Nitrile Butadiene Rubber Industry Volume K Tons Forecast, by End-user Industry 2019 & 2032
- Table 125: Global Nitrile Butadiene Rubber Industry Revenue Million Forecast, by Country 2019 & 2032
- Table 126: Global Nitrile Butadiene Rubber Industry Volume K Tons Forecast, by Country 2019 & 2032
- Table 127: Brazil Nitrile Butadiene Rubber Industry Revenue (Million) Forecast, by Application 2019 & 2032
- Table 128: Brazil Nitrile Butadiene Rubber Industry Volume (K Tons) Forecast, by Application 2019 & 2032
- Table 129: Argentina Nitrile Butadiene Rubber Industry Revenue (Million) Forecast, by Application 2019 & 2032
- Table 130: Argentina Nitrile Butadiene Rubber Industry Volume (K Tons) Forecast, by Application 2019 & 2032
- Table 131: Colombia Nitrile Butadiene Rubber Industry Revenue (Million) Forecast, by Application 2019 & 2032
- Table 132: Colombia Nitrile Butadiene Rubber Industry Volume (K Tons) Forecast, by Application 2019 & 2032
- Table 133: Rest of South America Nitrile Butadiene Rubber Industry Revenue (Million) Forecast, by Application 2019 & 2032
- Table 134: Rest of South America Nitrile Butadiene Rubber Industry Volume (K Tons) Forecast, by Application 2019 & 2032
- Table 135: Global Nitrile Butadiene Rubber Industry Revenue Million Forecast, by Application 2019 & 2032
- Table 136: Global Nitrile Butadiene Rubber Industry Volume K Tons Forecast, by Application 2019 & 2032
- Table 137: Global Nitrile Butadiene Rubber Industry Revenue Million Forecast, by End-user Industry 2019 & 2032
- Table 138: Global Nitrile Butadiene Rubber Industry Volume K Tons Forecast, by End-user Industry 2019 & 2032
- Table 139: Global Nitrile Butadiene Rubber Industry Revenue Million Forecast, by Country 2019 & 2032
- Table 140: Global Nitrile Butadiene Rubber Industry Volume K Tons Forecast, by Country 2019 & 2032
- Table 141: Saudi Arabia Nitrile Butadiene Rubber Industry Revenue (Million) Forecast, by Application 2019 & 2032
- Table 142: Saudi Arabia Nitrile Butadiene Rubber Industry Volume (K Tons) Forecast, by Application 2019 & 2032
- Table 143: South Africa Nitrile Butadiene Rubber Industry Revenue (Million) Forecast, by Application 2019 & 2032
- Table 144: South Africa Nitrile Butadiene Rubber Industry Volume (K Tons) Forecast, by Application 2019 & 2032
- Table 145: Nigeria Nitrile Butadiene Rubber Industry Revenue (Million) Forecast, by Application 2019 & 2032
- Table 146: Nigeria Nitrile Butadiene Rubber Industry Volume (K Tons) Forecast, by Application 2019 & 2032
- Table 147: Egypt Nitrile Butadiene Rubber Industry Revenue (Million) Forecast, by Application 2019 & 2032
- Table 148: Egypt Nitrile Butadiene Rubber Industry Volume (K Tons) Forecast, by Application 2019 & 2032
- Table 149: Qatar Nitrile Butadiene Rubber Industry Revenue (Million) Forecast, by Application 2019 & 2032
- Table 150: Qatar Nitrile Butadiene Rubber Industry Volume (K Tons) Forecast, by Application 2019 & 2032
- Table 151: UAE Nitrile Butadiene Rubber Industry Revenue (Million) Forecast, by Application 2019 & 2032
- Table 152: UAE Nitrile Butadiene Rubber Industry Volume (K Tons) Forecast, by Application 2019 & 2032
- Table 153: Rest of Middle East and Africa Nitrile Butadiene Rubber Industry Revenue (Million) Forecast, by Application 2019 & 2032
- Table 154: Rest of Middle East and Africa Nitrile Butadiene Rubber Industry Volume (K Tons) Forecast, by Application 2019 & 2032
Frequently Asked Questions
1. What is the projected Compound Annual Growth Rate (CAGR) of the Nitrile Butadiene Rubber Industry?
The projected CAGR is approximately 6.31%.
2. Which companies are prominent players in the Nitrile Butadiene Rubber Industry?
Key companies in the market include Versalis S p A, ARLANXEO, Synthos, ZEON CORPORATION*List Not Exhaustive, Dynasol Group, ENEOS Materials Corporation, KUMHO PETROCHEMICAL, SIBUR, Synthomer PLC, LG Chem, China Petrochemical Corporation (Sinopec), Apcotex, Lanxess, TSRC.
3. What are the main segments of the Nitrile Butadiene Rubber Industry?
The market segments include Application, End-user Industry.
4. Can you provide details about the market size?
The market size is estimated to be USD 2.51 Million as of 2022.
5. What are some drivers contributing to market growth?
Expanding Automotive Industry; Industrial and Infrastructure Development Projects.
6. What are the notable trends driving market growth?
Automotive and Transportation Sector Dominates the Market.
7. Are there any restraints impacting market growth?
Availability of Substitute Materials; Fluctuating Raw Material Prices.
8. Can you provide examples of recent developments in the market?
August 2022: Kumho Petrochemical will be KRW6,000 billion (~USD 5.10 billion) into existing and new businesses in the next five years. As part of the initiative, Kumho will invest KRW 3,300 billion (~USD 2.81 billion) in its core business areas, which include nitrile butadiene latex (NB latex) production and styrene solution butadiene rubber (SSBR) manufacturing.
9. What pricing options are available for accessing the report?
Pricing options include single-user, multi-user, and enterprise licenses priced at USD 4750, USD 5250, and USD 8750 respectively.
10. Is the market size provided in terms of value or volume?
The market size is provided in terms of value, measured in Million and volume, measured in K Tons.
11. Are there any specific market keywords associated with the report?
Yes, the market keyword associated with the report is "Nitrile Butadiene Rubber Industry," which aids in identifying and referencing the specific market segment covered.
12. How do I determine which pricing option suits my needs best?
The pricing options vary based on user requirements and access needs. Individual users may opt for single-user licenses, while businesses requiring broader access may choose multi-user or enterprise licenses for cost-effective access to the report.
13. Are there any additional resources or data provided in the Nitrile Butadiene Rubber Industry report?
While the report offers comprehensive insights, it's advisable to review the specific contents or supplementary materials provided to ascertain if additional resources or data are available.
14. How can I stay updated on further developments or reports in the Nitrile Butadiene Rubber Industry?
To stay informed about further developments, trends, and reports in the Nitrile Butadiene Rubber Industry, consider subscribing to industry newsletters, following relevant companies and organizations, or regularly checking reputable industry news sources and publications.
Methodology
Step 1 - Identification of Relevant Samples Size from Population Database


Step 2 - Approaches for Defining Global Market Size (Value, Volume* & Price*)

Note*: In applicable scenarios
Step 3 - Data Sources
Primary Research
- Web Analytics
- Survey Reports
- Research Institute
- Latest Research Reports
- Opinion Leaders
Secondary Research
- Annual Reports
- White Paper
- Latest Press Release
- Industry Association
- Paid Database
- Investor Presentations

Step 4 - Data Triangulation
Involves using different sources of information in order to increase the validity of a study
These sources are likely to be stakeholders in a program - participants, other researchers, program staff, other community members, and so on.
Then we put all data in single framework & apply various statistical tools to find out the dynamic on the market.
During the analysis stage, feedback from the stakeholder groups would be compared to determine areas of agreement as well as areas of divergence
