

Key Insights
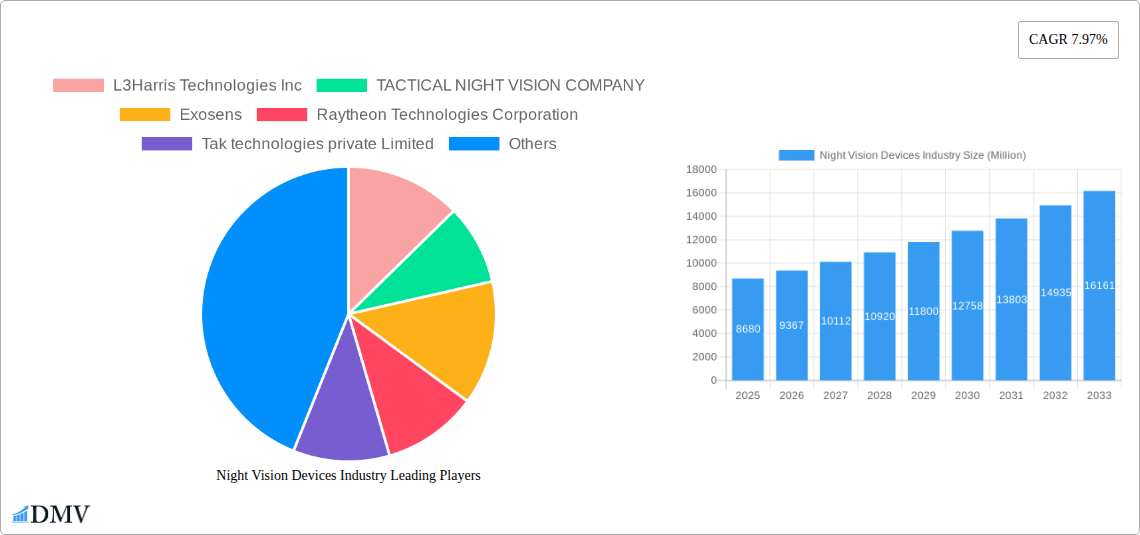
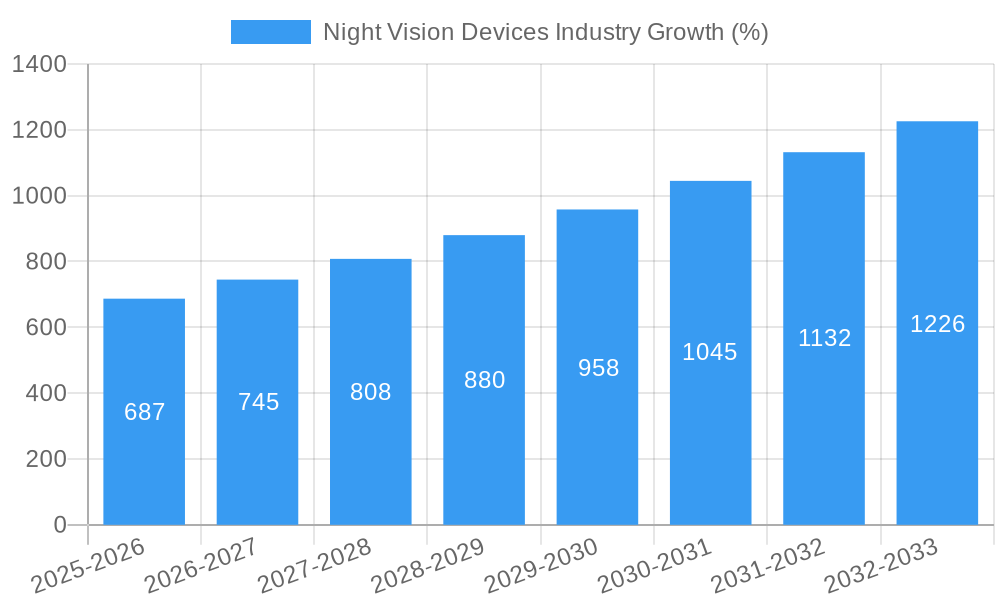
The night vision device (NVD) market, valued at $8.68 billion in 2025, is experiencing robust growth, projected to expand at a compound annual growth rate (CAGR) of 7.97% from 2025 to 2033. This growth is driven by increasing demand from military and defense sectors, spurred by modernization initiatives and escalating geopolitical tensions. Simultaneously, the rise of civilian applications, including wildlife observation, surveillance, and hunting, is fueling market expansion. Technological advancements, particularly in thermal imaging and image intensifier technologies, are enhancing the performance and capabilities of NVDs, leading to wider adoption across various sectors. The market is segmented by type (cameras, goggles, monoculars/binoculars, rifle scopes, and others), technology (thermal imaging, image intensifiers, infrared illumination, and others), and application (military & defense, wildlife spotting, surveillance, navigation, and others). Key players like L3Harris Technologies, Raytheon Technologies, and FLIR Systems are driving innovation and market competition, with a focus on developing lighter, more compact, and cost-effective devices.
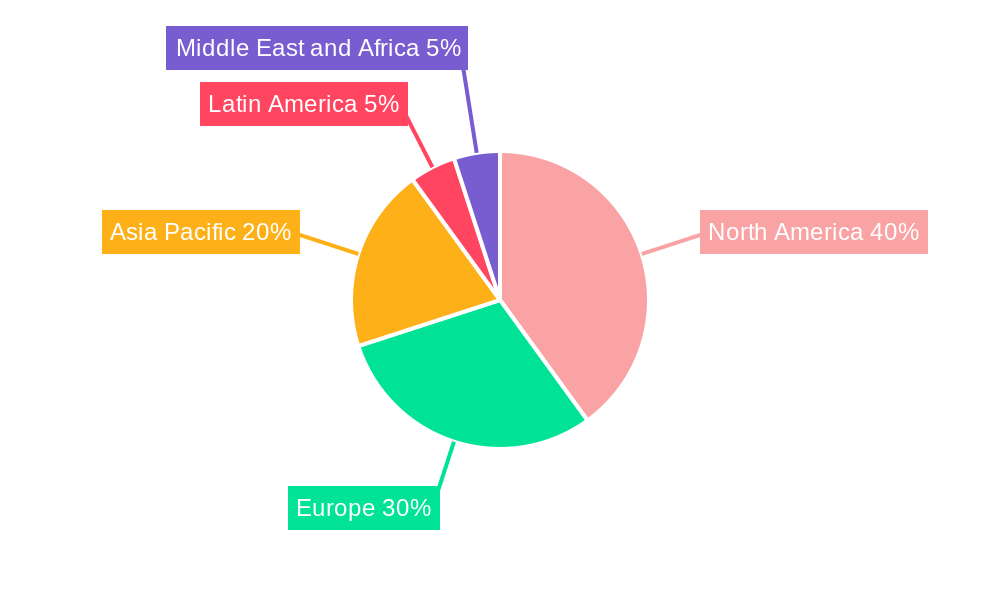
The market's growth trajectory is influenced by several factors. Government investments in advanced surveillance and defense systems are a significant driver, particularly in North America and Europe. However, the high cost of advanced NVDs, especially those incorporating cutting-edge technologies like thermal imaging, presents a restraint, particularly in developing economies. Furthermore, stringent regulations surrounding the sale and use of certain NVD types, especially in military and security applications, can impact market expansion. Despite these challenges, the increasing prevalence of security concerns globally and the rising popularity of outdoor recreational activities are expected to offset these limitations, leading to continued market growth in the forecast period. The Asia-Pacific region is poised for significant growth due to increasing military spending and rising demand from civilian users.
Night Vision Devices Industry Market Report: 2019-2033
This comprehensive report provides an in-depth analysis of the Night Vision Devices industry, offering invaluable insights for stakeholders seeking to navigate this dynamic market. The study period covers 2019-2033, with 2025 as the base and estimated year, and a forecast period of 2025-2033. The report delves into market trends, technological advancements, competitive landscapes, and future growth projections, providing a complete picture of the industry's evolution. The global market value is estimated at XX Million in 2025 and is projected to reach XX Million by 2033.
Night Vision Devices Industry Market Composition & Trends
The Night Vision Devices market is characterized by a moderate level of concentration, with several key players holding significant market share. However, the emergence of innovative startups and the ongoing technological advancements are fostering a competitive landscape. The industry is subject to stringent regulatory frameworks concerning military and defense applications, driving a need for compliance and specialized certifications. Substitute products, such as enhanced lighting systems, pose some competition, particularly in niche applications. End-users span diverse sectors, including military and defense, law enforcement, wildlife conservation, and industrial applications. M&A activity has been moderate, with deal values ranging from USD xx Million to USD xx Million in recent years, signifying a focus on strategic acquisitions to bolster technological capabilities and market reach.
- Market Share Distribution (2025): L3Harris Technologies Inc. (XX%), Raytheon Technologies Corporation (XX%), Teledyne FLIR LLC (XX%), Others (XX%).
- Top 3 M&A Deals (2019-2024): Deal 1: USD xx Million; Deal 2: USD xx Million; Deal 3: USD xx Million.
Night Vision Devices Industry Industry Evolution
The Night Vision Devices industry has witnessed robust growth throughout the historical period (2019-2024), primarily driven by increased defense spending, technological advancements in thermal imaging and image intensification, and rising demand for enhanced surveillance and security solutions. The market's Compound Annual Growth Rate (CAGR) during this period is estimated at XX%. Technological advancements, such as the integration of artificial intelligence (AI) and augmented reality (AR), are revolutionizing the capabilities of night vision devices, leading to improved performance, miniaturization, and enhanced user experiences. This evolution has been further fueled by the rising adoption of thermal imaging technology in diverse applications due to its superior performance in adverse weather conditions. Consumer demand has shifted towards lighter, more compact, and versatile devices with improved image quality and longer battery life, prompting manufacturers to innovate and incorporate advanced features. The forecast period (2025-2033) is expected to witness continued growth driven by the factors mentioned above. The CAGR for this period is projected to be XX%. Adoption of advanced technologies like FNVG-AR is expected to increase by XX% annually.
Leading Regions, Countries, or Segments in Night Vision Devices Industry
The North American region currently dominates the Night Vision Devices market, driven by substantial military and defense spending, coupled with a strong technological base and robust innovation ecosystem. Within North America, the United States holds a significant market share due to its large defense budget and high demand for advanced night vision technologies.
Dominant Segments:
- By Type: Goggles and Binoculars hold the largest market share due to their widespread adoption in military and law enforcement applications.
- By Technology: Thermal imaging is gaining traction due to its effectiveness in diverse environments and weather conditions, surpassing the market share of image intensifiers.
- By Application: The military and defense sector remains the dominant application segment, driven by consistently high procurement budgets.
Key Drivers:
- High defense spending: Significant investments by governments worldwide, especially in North America and Europe, drive demand for advanced night vision devices.
- Technological advancements: Continuous improvements in image quality, resolution, and functionality contribute to increased adoption across diverse applications.
- Stringent security requirements: The growing need for enhanced security and surveillance solutions across various sectors boosts demand.
Night Vision Devices Industry Product Innovations
Recent innovations in the night vision devices industry have focused on miniaturization, improved image quality (including increased resolution and better low-light performance), integration of advanced features like AR and AI, and enhanced durability and usability. The FNVG-AR, for example, represents a significant step towards fused sensor technology, providing users with superior situational awareness in challenging environments. Unique selling propositions now emphasize compactness, lighter weight, longer battery life, and enhanced image clarity, reflecting the changing needs of end-users.
Propelling Factors for Night Vision Devices Industry Growth
Technological advancements, specifically in thermal imaging and image intensification, are major growth drivers. Increased defense expenditure globally fuels demand for advanced night vision systems. Stringent security regulations in various sectors are propelling adoption for surveillance and monitoring applications. Economic growth in emerging markets is also creating new opportunities for expanding market penetration. Government initiatives and supportive regulatory environments further contribute to industry expansion.
Obstacles in the Night Vision Devices Industry Market
Supply chain disruptions, particularly concerning the sourcing of critical components, pose significant challenges. High production costs and stringent regulatory compliance requirements can impact profitability. Intense competition from established players and emerging startups puts pressure on pricing strategies. Geopolitical instability in key manufacturing and procurement regions can also disrupt supply and distribution chains.
Future Opportunities in Night Vision Devices Industry
Expanding into new markets, particularly in developing economies with rising security concerns, presents significant opportunities. Developing innovative applications for commercial uses, such as wildlife observation and industrial inspection, is another promising avenue. Integrating advanced technologies like AI and machine learning to enhance image analysis and object recognition offers further potential for growth. The development of lighter, more energy-efficient devices will also create new market demands.
Major Players in the Night Vision Devices Industry Ecosystem
- L3Harris Technologies Inc.
- TACTICAL NIGHT VISION COMPANY
- Exosens
- Raytheon Technologies Corporation
- Tak technologies private Limited
- Satir
- nivisys LLC
- Excelitas Technologies Corp
- sharp Corporation
- Elibit Systems Ltd
- BAE Systems PLC
- EOTECH LLC
- Thales Group SA
- Opgal Optronic Industries Ltd
- Apresys International Inc
- Luna Optics Inc
- Panasonic Holding Corporation
- American Technologies Network Corp
- Bushnell Inc
- Teledyne FLIR LLC
Key Developments in Night Vision Devices Industry Industry
- November 2023: Night Vision LLC (Elbit Systems of America) secures a USD 500 Million contract from the US Department of Defense for SBNVG systems. This substantial investment underscores the significant demand for advanced night vision technologies within the military sector.
- October 2023: Thermoteknix Systems launches the FNVG-AR, a state-of-the-art fused night vision goggle with augmented reality capabilities. This product launch signifies the ongoing innovation within the sector toward integrating advanced technologies into existing night vision products.
Strategic Night Vision Devices Industry Market Forecast
The Night Vision Devices market is poised for continued growth driven by technological advancements, rising defense spending, and expanding applications across diverse sectors. The integration of AI, AR, and improved sensor fusion will drive demand for superior performance and enhanced features. New market opportunities in emerging economies and the development of commercially focused applications will further fuel market expansion. The market's overall growth potential remains strong, promising significant returns for investors and stakeholders in the coming years.
Night Vision Devices Industry Segmentation
-
1. Type
- 1.1. Camera
- 1.2. Goggles
- 1.3. Monoculars and Binoculars
- 1.4. Rifle Scope
- 1.5. Other Types
-
2. Technology
- 2.1. Thermal Imaging
- 2.2. Image Intensifier
- 2.3. Infrared Illumination
- 2.4. Other Technologies
-
3. Application
- 3.1. Military and Defense
- 3.2. Wildlife Spotting and Conservation
- 3.3. Surveillance
- 3.4. Navigation
- 3.5. Other Applications
Night Vision Devices Industry Segmentation By Geography
- 1. North America
- 2. Europe
- 3. Asia Pacific
- 4. Latin America
- 5. Middle East and Africa
Night Vision Devices Industry REPORT HIGHLIGHTS
| Aspects | Details |
|---|---|
| Study Period | 2019-2033 |
| Base Year | 2024 |
| Estimated Year | 2025 |
| Forecast Period | 2025-2033 |
| Historical Period | 2019-2024 |
| Growth Rate | CAGR of 7.97% from 2019-2033 |
| Segmentation |
|
Table of Contents
- 1. Introduction
- 1.1. Research Scope
- 1.2. Market Segmentation
- 1.3. Research Methodology
- 1.4. Definitions and Assumptions
- 2. Executive Summary
- 2.1. Introduction
- 3. Market Dynamics
- 3.1. Introduction
- 3.2. Market Drivers
- 3.2.1. Increasing Military Expenditure; Increasing Adoption from Law Enforcement
- 3.3. Market Restrains
- 3.3.1. High Costs Associated with Maintenance
- 3.4. Market Trends
- 3.4.1. Surveillance Applications to Hold Significant Share
- 4. Market Factor Analysis
- 4.1. Porters Five Forces
- 4.2. Supply/Value Chain
- 4.3. PESTEL analysis
- 4.4. Market Entropy
- 4.5. Patent/Trademark Analysis
- 5. Global Night Vision Devices Industry Analysis, Insights and Forecast, 2019-2031
- 5.1. Market Analysis, Insights and Forecast - by Type
- 5.1.1. Camera
- 5.1.2. Goggles
- 5.1.3. Monoculars and Binoculars
- 5.1.4. Rifle Scope
- 5.1.5. Other Types
- 5.2. Market Analysis, Insights and Forecast - by Technology
- 5.2.1. Thermal Imaging
- 5.2.2. Image Intensifier
- 5.2.3. Infrared Illumination
- 5.2.4. Other Technologies
- 5.3. Market Analysis, Insights and Forecast - by Application
- 5.3.1. Military and Defense
- 5.3.2. Wildlife Spotting and Conservation
- 5.3.3. Surveillance
- 5.3.4. Navigation
- 5.3.5. Other Applications
- 5.4. Market Analysis, Insights and Forecast - by Region
- 5.4.1. North America
- 5.4.2. Europe
- 5.4.3. Asia Pacific
- 5.4.4. Latin America
- 5.4.5. Middle East and Africa
- 5.1. Market Analysis, Insights and Forecast - by Type
- 6. North America Night Vision Devices Industry Analysis, Insights and Forecast, 2019-2031
- 6.1. Market Analysis, Insights and Forecast - by Type
- 6.1.1. Camera
- 6.1.2. Goggles
- 6.1.3. Monoculars and Binoculars
- 6.1.4. Rifle Scope
- 6.1.5. Other Types
- 6.2. Market Analysis, Insights and Forecast - by Technology
- 6.2.1. Thermal Imaging
- 6.2.2. Image Intensifier
- 6.2.3. Infrared Illumination
- 6.2.4. Other Technologies
- 6.3. Market Analysis, Insights and Forecast - by Application
- 6.3.1. Military and Defense
- 6.3.2. Wildlife Spotting and Conservation
- 6.3.3. Surveillance
- 6.3.4. Navigation
- 6.3.5. Other Applications
- 6.1. Market Analysis, Insights and Forecast - by Type
- 7. Europe Night Vision Devices Industry Analysis, Insights and Forecast, 2019-2031
- 7.1. Market Analysis, Insights and Forecast - by Type
- 7.1.1. Camera
- 7.1.2. Goggles
- 7.1.3. Monoculars and Binoculars
- 7.1.4. Rifle Scope
- 7.1.5. Other Types
- 7.2. Market Analysis, Insights and Forecast - by Technology
- 7.2.1. Thermal Imaging
- 7.2.2. Image Intensifier
- 7.2.3. Infrared Illumination
- 7.2.4. Other Technologies
- 7.3. Market Analysis, Insights and Forecast - by Application
- 7.3.1. Military and Defense
- 7.3.2. Wildlife Spotting and Conservation
- 7.3.3. Surveillance
- 7.3.4. Navigation
- 7.3.5. Other Applications
- 7.1. Market Analysis, Insights and Forecast - by Type
- 8. Asia Pacific Night Vision Devices Industry Analysis, Insights and Forecast, 2019-2031
- 8.1. Market Analysis, Insights and Forecast - by Type
- 8.1.1. Camera
- 8.1.2. Goggles
- 8.1.3. Monoculars and Binoculars
- 8.1.4. Rifle Scope
- 8.1.5. Other Types
- 8.2. Market Analysis, Insights and Forecast - by Technology
- 8.2.1. Thermal Imaging
- 8.2.2. Image Intensifier
- 8.2.3. Infrared Illumination
- 8.2.4. Other Technologies
- 8.3. Market Analysis, Insights and Forecast - by Application
- 8.3.1. Military and Defense
- 8.3.2. Wildlife Spotting and Conservation
- 8.3.3. Surveillance
- 8.3.4. Navigation
- 8.3.5. Other Applications
- 8.1. Market Analysis, Insights and Forecast - by Type
- 9. Latin America Night Vision Devices Industry Analysis, Insights and Forecast, 2019-2031
- 9.1. Market Analysis, Insights and Forecast - by Type
- 9.1.1. Camera
- 9.1.2. Goggles
- 9.1.3. Monoculars and Binoculars
- 9.1.4. Rifle Scope
- 9.1.5. Other Types
- 9.2. Market Analysis, Insights and Forecast - by Technology
- 9.2.1. Thermal Imaging
- 9.2.2. Image Intensifier
- 9.2.3. Infrared Illumination
- 9.2.4. Other Technologies
- 9.3. Market Analysis, Insights and Forecast - by Application
- 9.3.1. Military and Defense
- 9.3.2. Wildlife Spotting and Conservation
- 9.3.3. Surveillance
- 9.3.4. Navigation
- 9.3.5. Other Applications
- 9.1. Market Analysis, Insights and Forecast - by Type
- 10. Middle East and Africa Night Vision Devices Industry Analysis, Insights and Forecast, 2019-2031
- 10.1. Market Analysis, Insights and Forecast - by Type
- 10.1.1. Camera
- 10.1.2. Goggles
- 10.1.3. Monoculars and Binoculars
- 10.1.4. Rifle Scope
- 10.1.5. Other Types
- 10.2. Market Analysis, Insights and Forecast - by Technology
- 10.2.1. Thermal Imaging
- 10.2.2. Image Intensifier
- 10.2.3. Infrared Illumination
- 10.2.4. Other Technologies
- 10.3. Market Analysis, Insights and Forecast - by Application
- 10.3.1. Military and Defense
- 10.3.2. Wildlife Spotting and Conservation
- 10.3.3. Surveillance
- 10.3.4. Navigation
- 10.3.5. Other Applications
- 10.1. Market Analysis, Insights and Forecast - by Type
- 11. North America Night Vision Devices Industry Analysis, Insights and Forecast, 2019-2031
- 11.1. Market Analysis, Insights and Forecast - By Country/Sub-region
- 11.1.1.
- 12. Europe Night Vision Devices Industry Analysis, Insights and Forecast, 2019-2031
- 12.1. Market Analysis, Insights and Forecast - By Country/Sub-region
- 12.1.1.
- 13. Asia Pacific Night Vision Devices Industry Analysis, Insights and Forecast, 2019-2031
- 13.1. Market Analysis, Insights and Forecast - By Country/Sub-region
- 13.1.1.
- 14. Latin America Night Vision Devices Industry Analysis, Insights and Forecast, 2019-2031
- 14.1. Market Analysis, Insights and Forecast - By Country/Sub-region
- 14.1.1.
- 15. Middle East and Africa Night Vision Devices Industry Analysis, Insights and Forecast, 2019-2031
- 15.1. Market Analysis, Insights and Forecast - By Country/Sub-region
- 15.1.1.
- 16. Competitive Analysis
- 16.1. Global Market Share Analysis 2024
- 16.2. Company Profiles
- 16.2.1 L3Harris Technologies Inc
- 16.2.1.1. Overview
- 16.2.1.2. Products
- 16.2.1.3. SWOT Analysis
- 16.2.1.4. Recent Developments
- 16.2.1.5. Financials (Based on Availability)
- 16.2.2 TACTICAL NIGHT VISION COMPANY
- 16.2.2.1. Overview
- 16.2.2.2. Products
- 16.2.2.3. SWOT Analysis
- 16.2.2.4. Recent Developments
- 16.2.2.5. Financials (Based on Availability)
- 16.2.3 Exosens
- 16.2.3.1. Overview
- 16.2.3.2. Products
- 16.2.3.3. SWOT Analysis
- 16.2.3.4. Recent Developments
- 16.2.3.5. Financials (Based on Availability)
- 16.2.4 Raytheon Technologies Corporation
- 16.2.4.1. Overview
- 16.2.4.2. Products
- 16.2.4.3. SWOT Analysis
- 16.2.4.4. Recent Developments
- 16.2.4.5. Financials (Based on Availability)
- 16.2.5 Tak technologies private Limited
- 16.2.5.1. Overview
- 16.2.5.2. Products
- 16.2.5.3. SWOT Analysis
- 16.2.5.4. Recent Developments
- 16.2.5.5. Financials (Based on Availability)
- 16.2.6 Satir
- 16.2.6.1. Overview
- 16.2.6.2. Products
- 16.2.6.3. SWOT Analysis
- 16.2.6.4. Recent Developments
- 16.2.6.5. Financials (Based on Availability)
- 16.2.7 nivisys LLC
- 16.2.7.1. Overview
- 16.2.7.2. Products
- 16.2.7.3. SWOT Analysis
- 16.2.7.4. Recent Developments
- 16.2.7.5. Financials (Based on Availability)
- 16.2.8 Excelitas Technologies Corp
- 16.2.8.1. Overview
- 16.2.8.2. Products
- 16.2.8.3. SWOT Analysis
- 16.2.8.4. Recent Developments
- 16.2.8.5. Financials (Based on Availability)
- 16.2.9 sharp Corporation
- 16.2.9.1. Overview
- 16.2.9.2. Products
- 16.2.9.3. SWOT Analysis
- 16.2.9.4. Recent Developments
- 16.2.9.5. Financials (Based on Availability)
- 16.2.10 Elibit Systems Ltd
- 16.2.10.1. Overview
- 16.2.10.2. Products
- 16.2.10.3. SWOT Analysis
- 16.2.10.4. Recent Developments
- 16.2.10.5. Financials (Based on Availability)
- 16.2.11 BAE Systems PLC
- 16.2.11.1. Overview
- 16.2.11.2. Products
- 16.2.11.3. SWOT Analysis
- 16.2.11.4. Recent Developments
- 16.2.11.5. Financials (Based on Availability)
- 16.2.12 EOTECH LLC
- 16.2.12.1. Overview
- 16.2.12.2. Products
- 16.2.12.3. SWOT Analysis
- 16.2.12.4. Recent Developments
- 16.2.12.5. Financials (Based on Availability)
- 16.2.13 Thales Group SA
- 16.2.13.1. Overview
- 16.2.13.2. Products
- 16.2.13.3. SWOT Analysis
- 16.2.13.4. Recent Developments
- 16.2.13.5. Financials (Based on Availability)
- 16.2.14 Opgal Optronic Industries Ltd
- 16.2.14.1. Overview
- 16.2.14.2. Products
- 16.2.14.3. SWOT Analysis
- 16.2.14.4. Recent Developments
- 16.2.14.5. Financials (Based on Availability)
- 16.2.15 Apresys International Inc
- 16.2.15.1. Overview
- 16.2.15.2. Products
- 16.2.15.3. SWOT Analysis
- 16.2.15.4. Recent Developments
- 16.2.15.5. Financials (Based on Availability)
- 16.2.16 Luna Optics Inc
- 16.2.16.1. Overview
- 16.2.16.2. Products
- 16.2.16.3. SWOT Analysis
- 16.2.16.4. Recent Developments
- 16.2.16.5. Financials (Based on Availability)
- 16.2.17 Panasonic Holding Corporation
- 16.2.17.1. Overview
- 16.2.17.2. Products
- 16.2.17.3. SWOT Analysis
- 16.2.17.4. Recent Developments
- 16.2.17.5. Financials (Based on Availability)
- 16.2.18 American Technologies Network Corp
- 16.2.18.1. Overview
- 16.2.18.2. Products
- 16.2.18.3. SWOT Analysis
- 16.2.18.4. Recent Developments
- 16.2.18.5. Financials (Based on Availability)
- 16.2.19 Bushnell Inc
- 16.2.19.1. Overview
- 16.2.19.2. Products
- 16.2.19.3. SWOT Analysis
- 16.2.19.4. Recent Developments
- 16.2.19.5. Financials (Based on Availability)
- 16.2.20 Teledyne FLIR LLC
- 16.2.20.1. Overview
- 16.2.20.2. Products
- 16.2.20.3. SWOT Analysis
- 16.2.20.4. Recent Developments
- 16.2.20.5. Financials (Based on Availability)
- 16.2.1 L3Harris Technologies Inc
List of Figures
- Figure 1: Global Night Vision Devices Industry Revenue Breakdown (Million, %) by Region 2024 & 2032
- Figure 2: North America Night Vision Devices Industry Revenue (Million), by Country 2024 & 2032
- Figure 3: North America Night Vision Devices Industry Revenue Share (%), by Country 2024 & 2032
- Figure 4: Europe Night Vision Devices Industry Revenue (Million), by Country 2024 & 2032
- Figure 5: Europe Night Vision Devices Industry Revenue Share (%), by Country 2024 & 2032
- Figure 6: Asia Pacific Night Vision Devices Industry Revenue (Million), by Country 2024 & 2032
- Figure 7: Asia Pacific Night Vision Devices Industry Revenue Share (%), by Country 2024 & 2032
- Figure 8: Latin America Night Vision Devices Industry Revenue (Million), by Country 2024 & 2032
- Figure 9: Latin America Night Vision Devices Industry Revenue Share (%), by Country 2024 & 2032
- Figure 10: Middle East and Africa Night Vision Devices Industry Revenue (Million), by Country 2024 & 2032
- Figure 11: Middle East and Africa Night Vision Devices Industry Revenue Share (%), by Country 2024 & 2032
- Figure 12: North America Night Vision Devices Industry Revenue (Million), by Type 2024 & 2032
- Figure 13: North America Night Vision Devices Industry Revenue Share (%), by Type 2024 & 2032
- Figure 14: North America Night Vision Devices Industry Revenue (Million), by Technology 2024 & 2032
- Figure 15: North America Night Vision Devices Industry Revenue Share (%), by Technology 2024 & 2032
- Figure 16: North America Night Vision Devices Industry Revenue (Million), by Application 2024 & 2032
- Figure 17: North America Night Vision Devices Industry Revenue Share (%), by Application 2024 & 2032
- Figure 18: North America Night Vision Devices Industry Revenue (Million), by Country 2024 & 2032
- Figure 19: North America Night Vision Devices Industry Revenue Share (%), by Country 2024 & 2032
- Figure 20: Europe Night Vision Devices Industry Revenue (Million), by Type 2024 & 2032
- Figure 21: Europe Night Vision Devices Industry Revenue Share (%), by Type 2024 & 2032
- Figure 22: Europe Night Vision Devices Industry Revenue (Million), by Technology 2024 & 2032
- Figure 23: Europe Night Vision Devices Industry Revenue Share (%), by Technology 2024 & 2032
- Figure 24: Europe Night Vision Devices Industry Revenue (Million), by Application 2024 & 2032
- Figure 25: Europe Night Vision Devices Industry Revenue Share (%), by Application 2024 & 2032
- Figure 26: Europe Night Vision Devices Industry Revenue (Million), by Country 2024 & 2032
- Figure 27: Europe Night Vision Devices Industry Revenue Share (%), by Country 2024 & 2032
- Figure 28: Asia Pacific Night Vision Devices Industry Revenue (Million), by Type 2024 & 2032
- Figure 29: Asia Pacific Night Vision Devices Industry Revenue Share (%), by Type 2024 & 2032
- Figure 30: Asia Pacific Night Vision Devices Industry Revenue (Million), by Technology 2024 & 2032
- Figure 31: Asia Pacific Night Vision Devices Industry Revenue Share (%), by Technology 2024 & 2032
- Figure 32: Asia Pacific Night Vision Devices Industry Revenue (Million), by Application 2024 & 2032
- Figure 33: Asia Pacific Night Vision Devices Industry Revenue Share (%), by Application 2024 & 2032
- Figure 34: Asia Pacific Night Vision Devices Industry Revenue (Million), by Country 2024 & 2032
- Figure 35: Asia Pacific Night Vision Devices Industry Revenue Share (%), by Country 2024 & 2032
- Figure 36: Latin America Night Vision Devices Industry Revenue (Million), by Type 2024 & 2032
- Figure 37: Latin America Night Vision Devices Industry Revenue Share (%), by Type 2024 & 2032
- Figure 38: Latin America Night Vision Devices Industry Revenue (Million), by Technology 2024 & 2032
- Figure 39: Latin America Night Vision Devices Industry Revenue Share (%), by Technology 2024 & 2032
- Figure 40: Latin America Night Vision Devices Industry Revenue (Million), by Application 2024 & 2032
- Figure 41: Latin America Night Vision Devices Industry Revenue Share (%), by Application 2024 & 2032
- Figure 42: Latin America Night Vision Devices Industry Revenue (Million), by Country 2024 & 2032
- Figure 43: Latin America Night Vision Devices Industry Revenue Share (%), by Country 2024 & 2032
- Figure 44: Middle East and Africa Night Vision Devices Industry Revenue (Million), by Type 2024 & 2032
- Figure 45: Middle East and Africa Night Vision Devices Industry Revenue Share (%), by Type 2024 & 2032
- Figure 46: Middle East and Africa Night Vision Devices Industry Revenue (Million), by Technology 2024 & 2032
- Figure 47: Middle East and Africa Night Vision Devices Industry Revenue Share (%), by Technology 2024 & 2032
- Figure 48: Middle East and Africa Night Vision Devices Industry Revenue (Million), by Application 2024 & 2032
- Figure 49: Middle East and Africa Night Vision Devices Industry Revenue Share (%), by Application 2024 & 2032
- Figure 50: Middle East and Africa Night Vision Devices Industry Revenue (Million), by Country 2024 & 2032
- Figure 51: Middle East and Africa Night Vision Devices Industry Revenue Share (%), by Country 2024 & 2032
List of Tables
- Table 1: Global Night Vision Devices Industry Revenue Million Forecast, by Region 2019 & 2032
- Table 2: Global Night Vision Devices Industry Revenue Million Forecast, by Type 2019 & 2032
- Table 3: Global Night Vision Devices Industry Revenue Million Forecast, by Technology 2019 & 2032
- Table 4: Global Night Vision Devices Industry Revenue Million Forecast, by Application 2019 & 2032
- Table 5: Global Night Vision Devices Industry Revenue Million Forecast, by Region 2019 & 2032
- Table 6: Global Night Vision Devices Industry Revenue Million Forecast, by Country 2019 & 2032
- Table 7: Night Vision Devices Industry Revenue (Million) Forecast, by Application 2019 & 2032
- Table 8: Global Night Vision Devices Industry Revenue Million Forecast, by Country 2019 & 2032
- Table 9: Night Vision Devices Industry Revenue (Million) Forecast, by Application 2019 & 2032
- Table 10: Global Night Vision Devices Industry Revenue Million Forecast, by Country 2019 & 2032
- Table 11: Night Vision Devices Industry Revenue (Million) Forecast, by Application 2019 & 2032
- Table 12: Global Night Vision Devices Industry Revenue Million Forecast, by Country 2019 & 2032
- Table 13: Night Vision Devices Industry Revenue (Million) Forecast, by Application 2019 & 2032
- Table 14: Global Night Vision Devices Industry Revenue Million Forecast, by Country 2019 & 2032
- Table 15: Night Vision Devices Industry Revenue (Million) Forecast, by Application 2019 & 2032
- Table 16: Global Night Vision Devices Industry Revenue Million Forecast, by Type 2019 & 2032
- Table 17: Global Night Vision Devices Industry Revenue Million Forecast, by Technology 2019 & 2032
- Table 18: Global Night Vision Devices Industry Revenue Million Forecast, by Application 2019 & 2032
- Table 19: Global Night Vision Devices Industry Revenue Million Forecast, by Country 2019 & 2032
- Table 20: Global Night Vision Devices Industry Revenue Million Forecast, by Type 2019 & 2032
- Table 21: Global Night Vision Devices Industry Revenue Million Forecast, by Technology 2019 & 2032
- Table 22: Global Night Vision Devices Industry Revenue Million Forecast, by Application 2019 & 2032
- Table 23: Global Night Vision Devices Industry Revenue Million Forecast, by Country 2019 & 2032
- Table 24: Global Night Vision Devices Industry Revenue Million Forecast, by Type 2019 & 2032
- Table 25: Global Night Vision Devices Industry Revenue Million Forecast, by Technology 2019 & 2032
- Table 26: Global Night Vision Devices Industry Revenue Million Forecast, by Application 2019 & 2032
- Table 27: Global Night Vision Devices Industry Revenue Million Forecast, by Country 2019 & 2032
- Table 28: Global Night Vision Devices Industry Revenue Million Forecast, by Type 2019 & 2032
- Table 29: Global Night Vision Devices Industry Revenue Million Forecast, by Technology 2019 & 2032
- Table 30: Global Night Vision Devices Industry Revenue Million Forecast, by Application 2019 & 2032
- Table 31: Global Night Vision Devices Industry Revenue Million Forecast, by Country 2019 & 2032
- Table 32: Global Night Vision Devices Industry Revenue Million Forecast, by Type 2019 & 2032
- Table 33: Global Night Vision Devices Industry Revenue Million Forecast, by Technology 2019 & 2032
- Table 34: Global Night Vision Devices Industry Revenue Million Forecast, by Application 2019 & 2032
- Table 35: Global Night Vision Devices Industry Revenue Million Forecast, by Country 2019 & 2032
Frequently Asked Questions
1. What is the projected Compound Annual Growth Rate (CAGR) of the Night Vision Devices Industry?
The projected CAGR is approximately 7.97%.
2. Which companies are prominent players in the Night Vision Devices Industry?
Key companies in the market include L3Harris Technologies Inc, TACTICAL NIGHT VISION COMPANY, Exosens, Raytheon Technologies Corporation, Tak technologies private Limited, Satir, nivisys LLC, Excelitas Technologies Corp, sharp Corporation, Elibit Systems Ltd, BAE Systems PLC, EOTECH LLC, Thales Group SA, Opgal Optronic Industries Ltd, Apresys International Inc, Luna Optics Inc, Panasonic Holding Corporation, American Technologies Network Corp, Bushnell Inc, Teledyne FLIR LLC.
3. What are the main segments of the Night Vision Devices Industry?
The market segments include Type, Technology, Application.
4. Can you provide details about the market size?
The market size is estimated to be USD 8.68 Million as of 2022.
5. What are some drivers contributing to market growth?
Increasing Military Expenditure; Increasing Adoption from Law Enforcement.
6. What are the notable trends driving market growth?
Surveillance Applications to Hold Significant Share.
7. Are there any restraints impacting market growth?
High Costs Associated with Maintenance.
8. Can you provide examples of recent developments in the market?
November 2023 - Night Vision LLC, a subsidiary of Elbit Systems of America, announced that it secured USD 500 million from the US Department of Defense to enhance the US Marine Corps’ efficiency with the supply of Squad Binocular Night Vision Goggle (SBNVG) systems. The contract is expected to be completed by 2028, aiming to equip the Marines with technology for nighttime situational awareness, with work to be executed in Roanoke, Virginia.
9. What pricing options are available for accessing the report?
Pricing options include single-user, multi-user, and enterprise licenses priced at USD 4750, USD 5250, and USD 8750 respectively.
10. Is the market size provided in terms of value or volume?
The market size is provided in terms of value, measured in Million.
11. Are there any specific market keywords associated with the report?
Yes, the market keyword associated with the report is "Night Vision Devices Industry," which aids in identifying and referencing the specific market segment covered.
12. How do I determine which pricing option suits my needs best?
The pricing options vary based on user requirements and access needs. Individual users may opt for single-user licenses, while businesses requiring broader access may choose multi-user or enterprise licenses for cost-effective access to the report.
13. Are there any additional resources or data provided in the Night Vision Devices Industry report?
While the report offers comprehensive insights, it's advisable to review the specific contents or supplementary materials provided to ascertain if additional resources or data are available.
14. How can I stay updated on further developments or reports in the Night Vision Devices Industry?
To stay informed about further developments, trends, and reports in the Night Vision Devices Industry, consider subscribing to industry newsletters, following relevant companies and organizations, or regularly checking reputable industry news sources and publications.
Methodology
Step 1 - Identification of Relevant Samples Size from Population Database


Step 2 - Approaches for Defining Global Market Size (Value, Volume* & Price*)

Note*: In applicable scenarios
Step 3 - Data Sources
Primary Research
- Web Analytics
- Survey Reports
- Research Institute
- Latest Research Reports
- Opinion Leaders
Secondary Research
- Annual Reports
- White Paper
- Latest Press Release
- Industry Association
- Paid Database
- Investor Presentations

Step 4 - Data Triangulation
Involves using different sources of information in order to increase the validity of a study
These sources are likely to be stakeholders in a program - participants, other researchers, program staff, other community members, and so on.
Then we put all data in single framework & apply various statistical tools to find out the dynamic on the market.
During the analysis stage, feedback from the stakeholder groups would be compared to determine areas of agreement as well as areas of divergence
