

Key Insights
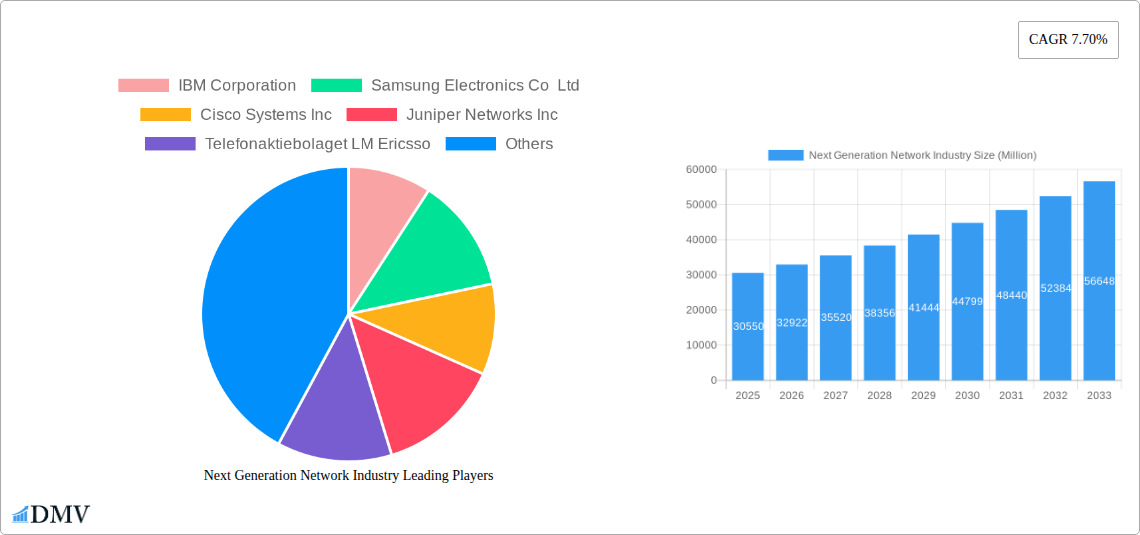
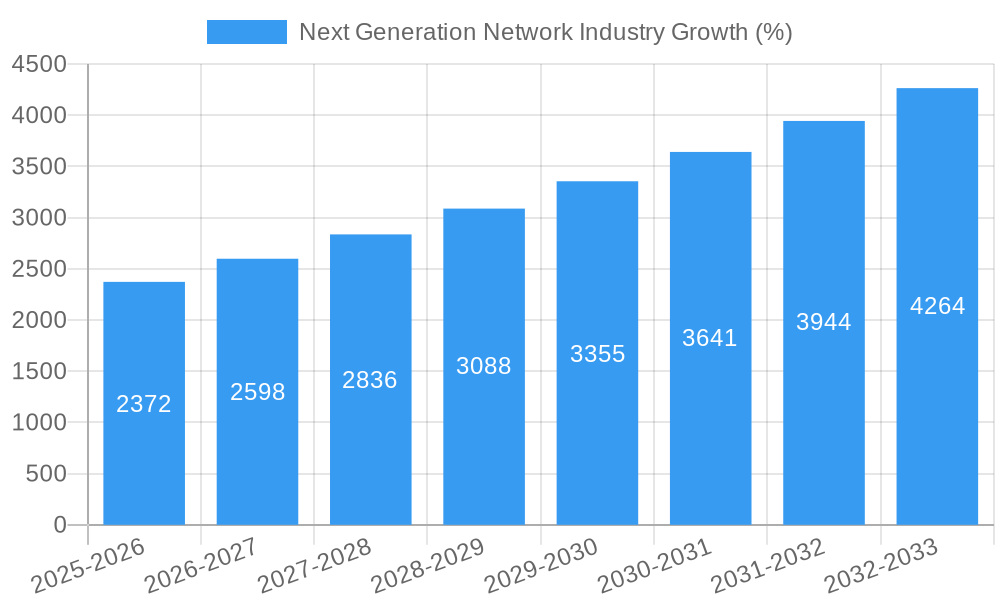
The Next Generation Network (NGN) industry is experiencing robust growth, projected to reach a market size of $30.55 billion in 2025, expanding at a Compound Annual Growth Rate (CAGR) of 7.70% from 2025 to 2033. This growth is fueled by several key drivers. The increasing demand for high-bandwidth applications like cloud computing, video streaming, and the Internet of Things (IoT) is a primary catalyst. Furthermore, the ongoing digital transformation initiatives across various sectors, including telecommunications, government, and enterprises, are pushing the adoption of NGN solutions that offer enhanced scalability, flexibility, and security compared to legacy networks. Government investments in advanced infrastructure and the increasing need for reliable and resilient networks are also significant contributors to market expansion. The industry is witnessing a shift towards software-defined networking (SDN) and network function virtualization (NFV) technologies, enabling greater network agility and cost efficiency. Competition among established players like IBM, Cisco, Huawei, and Nokia, along with emerging technology providers, is fostering innovation and driving down costs, making NGN solutions accessible to a broader range of customers.
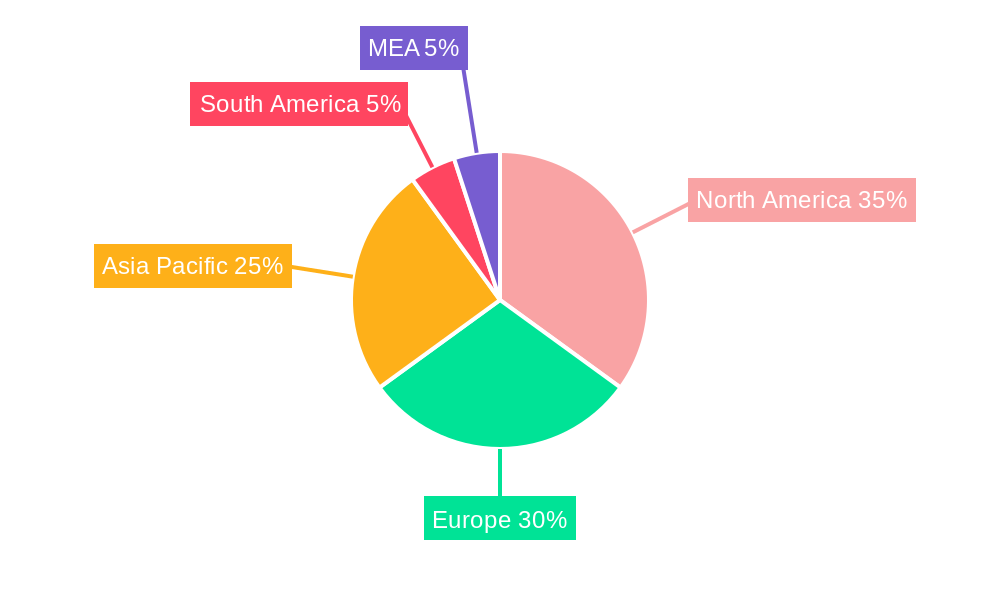
Segment-wise, the software component of NGN solutions is anticipated to experience faster growth than hardware due to its adaptability and scalability. Geographically, North America and Europe currently hold significant market shares, driven by high technological adoption and substantial investments in digital infrastructure. However, the Asia-Pacific region is poised for rapid growth due to increasing internet penetration, expanding digital economies, and significant government investments in network modernization across countries like China, India, and Japan. While the market faces some restraints, such as the high initial investment required for NGN implementation and the complexity of integrating new technologies into existing infrastructure, these challenges are being mitigated by innovative financing models and the growing availability of managed services. The overall outlook for the NGN market remains positive, with continued growth expected throughout the forecast period driven by the unrelenting demand for advanced networking capabilities.
Next Generation Network Industry Market Report: 2019-2033
This comprehensive report provides an in-depth analysis of the Next Generation Network (NGN) industry, projecting a market value of $XX Million by 2033. The study covers the period 2019-2033, with a base year of 2025 and a forecast period of 2025-2033. It examines market trends, technological advancements, leading players, and future opportunities within this dynamic sector. This report is crucial for stakeholders seeking to understand the current landscape and strategize for future growth within the NGN market.
Next Generation Network Industry Market Composition & Trends
The NGN market, valued at $XX Million in 2024, exhibits a moderately concentrated landscape with key players holding significant market shares. IBM Corporation, Samsung Electronics Co Ltd, Cisco Systems Inc, and Huawei Technologies Co Ltd are among the dominant forces, though the exact market share distribution remains dynamic due to ongoing M&A activity and technological innovation. Innovation is driven by the increasing demand for higher bandwidth, lower latency, and improved security, fueling advancements in 5G, software-defined networking (SDN), and network function virtualization (NFV). Regulatory landscapes vary globally, impacting market entry and operation. Substitute products, while limited, include legacy network technologies, but NGN’s superior capabilities are consistently driving market adoption. End-user profiles are diverse, encompassing Telecom and Internet Service Providers (TISPs), governments, and other end-users, each with unique needs and adoption rates.
- Market Concentration: Moderately concentrated, with top players holding approximately XX% of the market share in 2024.
- Innovation Catalysts: 5G deployment, SDN/NFV adoption, and increased demand for enhanced security.
- Regulatory Landscape: Varies significantly across regions, impacting market access and expansion strategies.
- M&A Activity: Significant M&A activity observed in the historical period (2019-2024), with total deal values exceeding $XX Million. Several deals involved strategic acquisitions of smaller companies specializing in specific NGN technologies.
Next Generation Network Industry Industry Evolution
The NGN industry has witnessed remarkable growth during the historical period (2019-2024), driven primarily by increased data consumption, the proliferation of smart devices, and the expansion of cloud services. The market exhibited a Compound Annual Growth Rate (CAGR) of XX% during this period, and this momentum is expected to continue. Technological advancements, including the development of 5G, improved fiber optic infrastructure, and the rise of edge computing, are significantly reshaping the industry. Consumer demand for faster, more reliable, and secure connectivity is also a major driver, particularly in regions with growing internet penetration rates. The adoption of SDN and NFV is accelerating, allowing for more flexible and efficient network management. We project a CAGR of XX% from 2025 to 2033, reaching a market value of $XX Million.
Leading Regions, Countries, or Segments in Next Generation Network Industry
The North American region currently holds the largest market share within the NGN industry, primarily due to substantial investments in infrastructure upgrades and a high level of technological adoption. Within the offering segments, the Hardware segment currently leads, but the Software and Services segments are experiencing rapid growth due to increasing demand for advanced network management and security solutions. Among end-users, TISPs represent the largest segment, followed by the Government sector, which is investing heavily in securing its network infrastructure.
- Key Drivers for North American Dominance: High levels of private and public investment in infrastructure, strong technological innovation, and a large base of TISPs.
- Hardware Segment: Leading segment due to high demand for 5G infrastructure and advanced networking equipment.
- Software Segment: Rapid growth fueled by the increasing adoption of SDN and NFV solutions.
- Services Segment: Strong growth driven by the need for network management, security, and consulting services.
- Telecom and Internet Service Providers (TISPs): Largest end-user segment, driving demand for advanced networking capabilities.
- Government Sector: Significant investments in secure network infrastructure, contributing to market growth.
Next Generation Network Industry Product Innovations
Recent innovations encompass advanced routing protocols, improved network security features, and the integration of AI/ML for network optimization and predictive maintenance. Next-generation routers and switches are incorporating advanced functionalities such as 10G/40G/100G Ethernet and higher speeds. Software-defined networking (SDN) and network function virtualization (NFV) solutions are increasingly being adopted to enhance network agility and flexibility, while edge computing is gaining traction to reduce latency and improve network performance for various applications like IoT devices and autonomous vehicles.
Propelling Factors for Next Generation Network Industry Growth
Several factors are driving the growth of the NGN industry. Technological advancements, especially in 5G and edge computing, are creating new opportunities for higher bandwidth and low latency applications. The increasing demand for data and improved connectivity across various sectors is propelling the industry. Favorable government policies and regulatory frameworks in several regions support investments in NGN infrastructure. For example, many governments are investing heavily in the development and deployment of 5G networks, boosting the market.
Obstacles in the Next Generation Network Industry Market
The NGN market faces challenges, including the high initial investment costs associated with infrastructure upgrades and the complexity of integrating new technologies into existing networks. Supply chain disruptions and the increasing price of raw materials also contribute to higher costs and project delays. Regulatory hurdles vary across regions, creating complexities for global companies. Competition from established players and new entrants is intensifying, placing pressure on profitability.
Future Opportunities in Next Generation Network Industry
Emerging opportunities lie in the expansion of 5G and 6G technologies, the growth of the Internet of Things (IoT), and the increasing adoption of edge computing solutions. Further integration of AI/ML in network management offers significant potential. New markets in developing economies with growing internet penetration present attractive expansion opportunities. The development of innovative security solutions is essential to address the increasing cyber threats to NGN.
Major Players in the Next Generation Network Industry Ecosystem
- IBM Corporation
- Samsung Electronics Co Ltd
- Cisco Systems Inc
- Juniper Networks Inc
- Telefonaktiebolaget LM Ericsson
- NEC Corporation
- Huawei Technologies Co Ltd
- ZTE Corporation
- Nokia Corporation
- Ciena Corporation
Key Developments in Next Generation Network Industry Industry
- September 2023: Charter Communications Inc. partnered with Qualcomm Technologies Inc. to launch a next-generation Wi-Fi 7 router, offering 10 Gbps speeds and enhancing residential and SMB connectivity experiences. This significantly boosts the consumer market segment for high-speed internet access.
- February 2024: Schneider Electric, collaborating with Intel and Red Hat, unveiled a Distributed Control Node (DCN) software framework, enabling industrial companies to adopt software-defined, plug-and-produce solutions for enhanced operational efficiency and cost optimization. This development highlights the expanding applications of NGN technology in industrial automation.
Strategic Next Generation Network Industry Market Forecast
The NGN market is poised for continued strong growth, driven by technological innovation, increasing data demand, and substantial investments in infrastructure upgrades. The expanding adoption of 5G, the growth of IoT, and the increasing need for robust network security will fuel market expansion. Emerging markets in developing countries will further contribute to the growth trajectory, presenting significant opportunities for market players. The forecast projects a substantial market expansion, surpassing $XX Million by 2033.
Next Generation Network Industry Segmentation
-
1. Offering
- 1.1. Hardware
- 1.2. Software
- 1.3. Services
-
2. End User
- 2.1. Telecom and Internet Service Providers
- 2.2. Government
- 2.3. Other End-users
Next Generation Network Industry Segmentation By Geography
- 1. North America
- 2. Europe
- 3. Asia Pacific
- 4. Latin America
- 5. Middle East and Africa
Next Generation Network Industry REPORT HIGHLIGHTS
| Aspects | Details |
|---|---|
| Study Period | 2019-2033 |
| Base Year | 2024 |
| Estimated Year | 2025 |
| Forecast Period | 2025-2033 |
| Historical Period | 2019-2024 |
| Growth Rate | CAGR of 7.70% from 2019-2033 |
| Segmentation |
|
Table of Contents
- 1. Introduction
- 1.1. Research Scope
- 1.2. Market Segmentation
- 1.3. Research Methodology
- 1.4. Definitions and Assumptions
- 2. Executive Summary
- 2.1. Introduction
- 3. Market Dynamics
- 3.1. Introduction
- 3.2. Market Drivers
- 3.2.1. Increasing Demand for High-Speed Services
- 3.3. Market Restrains
- 3.3.1. High Costs Related to the Infrastructure
- 3.4. Market Trends
- 3.4.1. Hardware Offering Holds Significant Market Share
- 4. Market Factor Analysis
- 4.1. Porters Five Forces
- 4.2. Supply/Value Chain
- 4.3. PESTEL analysis
- 4.4. Market Entropy
- 4.5. Patent/Trademark Analysis
- 5. Global Next Generation Network Industry Analysis, Insights and Forecast, 2019-2031
- 5.1. Market Analysis, Insights and Forecast - by Offering
- 5.1.1. Hardware
- 5.1.2. Software
- 5.1.3. Services
- 5.2. Market Analysis, Insights and Forecast - by End User
- 5.2.1. Telecom and Internet Service Providers
- 5.2.2. Government
- 5.2.3. Other End-users
- 5.3. Market Analysis, Insights and Forecast - by Region
- 5.3.1. North America
- 5.3.2. Europe
- 5.3.3. Asia Pacific
- 5.3.4. Latin America
- 5.3.5. Middle East and Africa
- 5.1. Market Analysis, Insights and Forecast - by Offering
- 6. North America Next Generation Network Industry Analysis, Insights and Forecast, 2019-2031
- 6.1. Market Analysis, Insights and Forecast - by Offering
- 6.1.1. Hardware
- 6.1.2. Software
- 6.1.3. Services
- 6.2. Market Analysis, Insights and Forecast - by End User
- 6.2.1. Telecom and Internet Service Providers
- 6.2.2. Government
- 6.2.3. Other End-users
- 6.1. Market Analysis, Insights and Forecast - by Offering
- 7. Europe Next Generation Network Industry Analysis, Insights and Forecast, 2019-2031
- 7.1. Market Analysis, Insights and Forecast - by Offering
- 7.1.1. Hardware
- 7.1.2. Software
- 7.1.3. Services
- 7.2. Market Analysis, Insights and Forecast - by End User
- 7.2.1. Telecom and Internet Service Providers
- 7.2.2. Government
- 7.2.3. Other End-users
- 7.1. Market Analysis, Insights and Forecast - by Offering
- 8. Asia Pacific Next Generation Network Industry Analysis, Insights and Forecast, 2019-2031
- 8.1. Market Analysis, Insights and Forecast - by Offering
- 8.1.1. Hardware
- 8.1.2. Software
- 8.1.3. Services
- 8.2. Market Analysis, Insights and Forecast - by End User
- 8.2.1. Telecom and Internet Service Providers
- 8.2.2. Government
- 8.2.3. Other End-users
- 8.1. Market Analysis, Insights and Forecast - by Offering
- 9. Latin America Next Generation Network Industry Analysis, Insights and Forecast, 2019-2031
- 9.1. Market Analysis, Insights and Forecast - by Offering
- 9.1.1. Hardware
- 9.1.2. Software
- 9.1.3. Services
- 9.2. Market Analysis, Insights and Forecast - by End User
- 9.2.1. Telecom and Internet Service Providers
- 9.2.2. Government
- 9.2.3. Other End-users
- 9.1. Market Analysis, Insights and Forecast - by Offering
- 10. Middle East and Africa Next Generation Network Industry Analysis, Insights and Forecast, 2019-2031
- 10.1. Market Analysis, Insights and Forecast - by Offering
- 10.1.1. Hardware
- 10.1.2. Software
- 10.1.3. Services
- 10.2. Market Analysis, Insights and Forecast - by End User
- 10.2.1. Telecom and Internet Service Providers
- 10.2.2. Government
- 10.2.3. Other End-users
- 10.1. Market Analysis, Insights and Forecast - by Offering
- 11. North America Next Generation Network Industry Analysis, Insights and Forecast, 2019-2031
- 11.1. Market Analysis, Insights and Forecast - By Country/Sub-region
- 11.1.1 United States
- 11.1.2 Canada
- 11.1.3 Mexico
- 12. Europe Next Generation Network Industry Analysis, Insights and Forecast, 2019-2031
- 12.1. Market Analysis, Insights and Forecast - By Country/Sub-region
- 12.1.1 Germany
- 12.1.2 United Kingdom
- 12.1.3 France
- 12.1.4 Spain
- 12.1.5 Italy
- 12.1.6 Spain
- 12.1.7 Belgium
- 12.1.8 Netherland
- 12.1.9 Nordics
- 12.1.10 Rest of Europe
- 13. Asia Pacific Next Generation Network Industry Analysis, Insights and Forecast, 2019-2031
- 13.1. Market Analysis, Insights and Forecast - By Country/Sub-region
- 13.1.1 China
- 13.1.2 Japan
- 13.1.3 India
- 13.1.4 South Korea
- 13.1.5 Southeast Asia
- 13.1.6 Australia
- 13.1.7 Indonesia
- 13.1.8 Phillipes
- 13.1.9 Singapore
- 13.1.10 Thailandc
- 13.1.11 Rest of Asia Pacific
- 14. South America Next Generation Network Industry Analysis, Insights and Forecast, 2019-2031
- 14.1. Market Analysis, Insights and Forecast - By Country/Sub-region
- 14.1.1 Brazil
- 14.1.2 Argentina
- 14.1.3 Peru
- 14.1.4 Chile
- 14.1.5 Colombia
- 14.1.6 Ecuador
- 14.1.7 Venezuela
- 14.1.8 Rest of South America
- 15. North America Next Generation Network Industry Analysis, Insights and Forecast, 2019-2031
- 15.1. Market Analysis, Insights and Forecast - By Country/Sub-region
- 15.1.1 United States
- 15.1.2 Canada
- 15.1.3 Mexico
- 16. MEA Next Generation Network Industry Analysis, Insights and Forecast, 2019-2031
- 16.1. Market Analysis, Insights and Forecast - By Country/Sub-region
- 16.1.1 United Arab Emirates
- 16.1.2 Saudi Arabia
- 16.1.3 South Africa
- 16.1.4 Rest of Middle East and Africa
- 17. Competitive Analysis
- 17.1. Global Market Share Analysis 2024
- 17.2. Company Profiles
- 17.2.1 IBM Corporation
- 17.2.1.1. Overview
- 17.2.1.2. Products
- 17.2.1.3. SWOT Analysis
- 17.2.1.4. Recent Developments
- 17.2.1.5. Financials (Based on Availability)
- 17.2.2 Samsung Electronics Co Ltd
- 17.2.2.1. Overview
- 17.2.2.2. Products
- 17.2.2.3. SWOT Analysis
- 17.2.2.4. Recent Developments
- 17.2.2.5. Financials (Based on Availability)
- 17.2.3 Cisco Systems Inc
- 17.2.3.1. Overview
- 17.2.3.2. Products
- 17.2.3.3. SWOT Analysis
- 17.2.3.4. Recent Developments
- 17.2.3.5. Financials (Based on Availability)
- 17.2.4 Juniper Networks Inc
- 17.2.4.1. Overview
- 17.2.4.2. Products
- 17.2.4.3. SWOT Analysis
- 17.2.4.4. Recent Developments
- 17.2.4.5. Financials (Based on Availability)
- 17.2.5 Telefonaktiebolaget LM Ericsso
- 17.2.5.1. Overview
- 17.2.5.2. Products
- 17.2.5.3. SWOT Analysis
- 17.2.5.4. Recent Developments
- 17.2.5.5. Financials (Based on Availability)
- 17.2.6 NEC Corporation
- 17.2.6.1. Overview
- 17.2.6.2. Products
- 17.2.6.3. SWOT Analysis
- 17.2.6.4. Recent Developments
- 17.2.6.5. Financials (Based on Availability)
- 17.2.7 Huawei Technologies Co Ltd
- 17.2.7.1. Overview
- 17.2.7.2. Products
- 17.2.7.3. SWOT Analysis
- 17.2.7.4. Recent Developments
- 17.2.7.5. Financials (Based on Availability)
- 17.2.8 ZTE Corporation
- 17.2.8.1. Overview
- 17.2.8.2. Products
- 17.2.8.3. SWOT Analysis
- 17.2.8.4. Recent Developments
- 17.2.8.5. Financials (Based on Availability)
- 17.2.9 Nokia Corporation
- 17.2.9.1. Overview
- 17.2.9.2. Products
- 17.2.9.3. SWOT Analysis
- 17.2.9.4. Recent Developments
- 17.2.9.5. Financials (Based on Availability)
- 17.2.10 Ciena Corporation
- 17.2.10.1. Overview
- 17.2.10.2. Products
- 17.2.10.3. SWOT Analysis
- 17.2.10.4. Recent Developments
- 17.2.10.5. Financials (Based on Availability)
- 17.2.1 IBM Corporation
List of Figures
- Figure 1: Global Next Generation Network Industry Revenue Breakdown (Million, %) by Region 2024 & 2032
- Figure 2: North America Next Generation Network Industry Revenue (Million), by Country 2024 & 2032
- Figure 3: North America Next Generation Network Industry Revenue Share (%), by Country 2024 & 2032
- Figure 4: Europe Next Generation Network Industry Revenue (Million), by Country 2024 & 2032
- Figure 5: Europe Next Generation Network Industry Revenue Share (%), by Country 2024 & 2032
- Figure 6: Asia Pacific Next Generation Network Industry Revenue (Million), by Country 2024 & 2032
- Figure 7: Asia Pacific Next Generation Network Industry Revenue Share (%), by Country 2024 & 2032
- Figure 8: South America Next Generation Network Industry Revenue (Million), by Country 2024 & 2032
- Figure 9: South America Next Generation Network Industry Revenue Share (%), by Country 2024 & 2032
- Figure 10: North America Next Generation Network Industry Revenue (Million), by Country 2024 & 2032
- Figure 11: North America Next Generation Network Industry Revenue Share (%), by Country 2024 & 2032
- Figure 12: MEA Next Generation Network Industry Revenue (Million), by Country 2024 & 2032
- Figure 13: MEA Next Generation Network Industry Revenue Share (%), by Country 2024 & 2032
- Figure 14: North America Next Generation Network Industry Revenue (Million), by Offering 2024 & 2032
- Figure 15: North America Next Generation Network Industry Revenue Share (%), by Offering 2024 & 2032
- Figure 16: North America Next Generation Network Industry Revenue (Million), by End User 2024 & 2032
- Figure 17: North America Next Generation Network Industry Revenue Share (%), by End User 2024 & 2032
- Figure 18: North America Next Generation Network Industry Revenue (Million), by Country 2024 & 2032
- Figure 19: North America Next Generation Network Industry Revenue Share (%), by Country 2024 & 2032
- Figure 20: Europe Next Generation Network Industry Revenue (Million), by Offering 2024 & 2032
- Figure 21: Europe Next Generation Network Industry Revenue Share (%), by Offering 2024 & 2032
- Figure 22: Europe Next Generation Network Industry Revenue (Million), by End User 2024 & 2032
- Figure 23: Europe Next Generation Network Industry Revenue Share (%), by End User 2024 & 2032
- Figure 24: Europe Next Generation Network Industry Revenue (Million), by Country 2024 & 2032
- Figure 25: Europe Next Generation Network Industry Revenue Share (%), by Country 2024 & 2032
- Figure 26: Asia Pacific Next Generation Network Industry Revenue (Million), by Offering 2024 & 2032
- Figure 27: Asia Pacific Next Generation Network Industry Revenue Share (%), by Offering 2024 & 2032
- Figure 28: Asia Pacific Next Generation Network Industry Revenue (Million), by End User 2024 & 2032
- Figure 29: Asia Pacific Next Generation Network Industry Revenue Share (%), by End User 2024 & 2032
- Figure 30: Asia Pacific Next Generation Network Industry Revenue (Million), by Country 2024 & 2032
- Figure 31: Asia Pacific Next Generation Network Industry Revenue Share (%), by Country 2024 & 2032
- Figure 32: Latin America Next Generation Network Industry Revenue (Million), by Offering 2024 & 2032
- Figure 33: Latin America Next Generation Network Industry Revenue Share (%), by Offering 2024 & 2032
- Figure 34: Latin America Next Generation Network Industry Revenue (Million), by End User 2024 & 2032
- Figure 35: Latin America Next Generation Network Industry Revenue Share (%), by End User 2024 & 2032
- Figure 36: Latin America Next Generation Network Industry Revenue (Million), by Country 2024 & 2032
- Figure 37: Latin America Next Generation Network Industry Revenue Share (%), by Country 2024 & 2032
- Figure 38: Middle East and Africa Next Generation Network Industry Revenue (Million), by Offering 2024 & 2032
- Figure 39: Middle East and Africa Next Generation Network Industry Revenue Share (%), by Offering 2024 & 2032
- Figure 40: Middle East and Africa Next Generation Network Industry Revenue (Million), by End User 2024 & 2032
- Figure 41: Middle East and Africa Next Generation Network Industry Revenue Share (%), by End User 2024 & 2032
- Figure 42: Middle East and Africa Next Generation Network Industry Revenue (Million), by Country 2024 & 2032
- Figure 43: Middle East and Africa Next Generation Network Industry Revenue Share (%), by Country 2024 & 2032
List of Tables
- Table 1: Global Next Generation Network Industry Revenue Million Forecast, by Region 2019 & 2032
- Table 2: Global Next Generation Network Industry Revenue Million Forecast, by Offering 2019 & 2032
- Table 3: Global Next Generation Network Industry Revenue Million Forecast, by End User 2019 & 2032
- Table 4: Global Next Generation Network Industry Revenue Million Forecast, by Region 2019 & 2032
- Table 5: Global Next Generation Network Industry Revenue Million Forecast, by Country 2019 & 2032
- Table 6: United States Next Generation Network Industry Revenue (Million) Forecast, by Application 2019 & 2032
- Table 7: Canada Next Generation Network Industry Revenue (Million) Forecast, by Application 2019 & 2032
- Table 8: Mexico Next Generation Network Industry Revenue (Million) Forecast, by Application 2019 & 2032
- Table 9: Global Next Generation Network Industry Revenue Million Forecast, by Country 2019 & 2032
- Table 10: Germany Next Generation Network Industry Revenue (Million) Forecast, by Application 2019 & 2032
- Table 11: United Kingdom Next Generation Network Industry Revenue (Million) Forecast, by Application 2019 & 2032
- Table 12: France Next Generation Network Industry Revenue (Million) Forecast, by Application 2019 & 2032
- Table 13: Spain Next Generation Network Industry Revenue (Million) Forecast, by Application 2019 & 2032
- Table 14: Italy Next Generation Network Industry Revenue (Million) Forecast, by Application 2019 & 2032
- Table 15: Spain Next Generation Network Industry Revenue (Million) Forecast, by Application 2019 & 2032
- Table 16: Belgium Next Generation Network Industry Revenue (Million) Forecast, by Application 2019 & 2032
- Table 17: Netherland Next Generation Network Industry Revenue (Million) Forecast, by Application 2019 & 2032
- Table 18: Nordics Next Generation Network Industry Revenue (Million) Forecast, by Application 2019 & 2032
- Table 19: Rest of Europe Next Generation Network Industry Revenue (Million) Forecast, by Application 2019 & 2032
- Table 20: Global Next Generation Network Industry Revenue Million Forecast, by Country 2019 & 2032
- Table 21: China Next Generation Network Industry Revenue (Million) Forecast, by Application 2019 & 2032
- Table 22: Japan Next Generation Network Industry Revenue (Million) Forecast, by Application 2019 & 2032
- Table 23: India Next Generation Network Industry Revenue (Million) Forecast, by Application 2019 & 2032
- Table 24: South Korea Next Generation Network Industry Revenue (Million) Forecast, by Application 2019 & 2032
- Table 25: Southeast Asia Next Generation Network Industry Revenue (Million) Forecast, by Application 2019 & 2032
- Table 26: Australia Next Generation Network Industry Revenue (Million) Forecast, by Application 2019 & 2032
- Table 27: Indonesia Next Generation Network Industry Revenue (Million) Forecast, by Application 2019 & 2032
- Table 28: Phillipes Next Generation Network Industry Revenue (Million) Forecast, by Application 2019 & 2032
- Table 29: Singapore Next Generation Network Industry Revenue (Million) Forecast, by Application 2019 & 2032
- Table 30: Thailandc Next Generation Network Industry Revenue (Million) Forecast, by Application 2019 & 2032
- Table 31: Rest of Asia Pacific Next Generation Network Industry Revenue (Million) Forecast, by Application 2019 & 2032
- Table 32: Global Next Generation Network Industry Revenue Million Forecast, by Country 2019 & 2032
- Table 33: Brazil Next Generation Network Industry Revenue (Million) Forecast, by Application 2019 & 2032
- Table 34: Argentina Next Generation Network Industry Revenue (Million) Forecast, by Application 2019 & 2032
- Table 35: Peru Next Generation Network Industry Revenue (Million) Forecast, by Application 2019 & 2032
- Table 36: Chile Next Generation Network Industry Revenue (Million) Forecast, by Application 2019 & 2032
- Table 37: Colombia Next Generation Network Industry Revenue (Million) Forecast, by Application 2019 & 2032
- Table 38: Ecuador Next Generation Network Industry Revenue (Million) Forecast, by Application 2019 & 2032
- Table 39: Venezuela Next Generation Network Industry Revenue (Million) Forecast, by Application 2019 & 2032
- Table 40: Rest of South America Next Generation Network Industry Revenue (Million) Forecast, by Application 2019 & 2032
- Table 41: Global Next Generation Network Industry Revenue Million Forecast, by Country 2019 & 2032
- Table 42: United States Next Generation Network Industry Revenue (Million) Forecast, by Application 2019 & 2032
- Table 43: Canada Next Generation Network Industry Revenue (Million) Forecast, by Application 2019 & 2032
- Table 44: Mexico Next Generation Network Industry Revenue (Million) Forecast, by Application 2019 & 2032
- Table 45: Global Next Generation Network Industry Revenue Million Forecast, by Country 2019 & 2032
- Table 46: United Arab Emirates Next Generation Network Industry Revenue (Million) Forecast, by Application 2019 & 2032
- Table 47: Saudi Arabia Next Generation Network Industry Revenue (Million) Forecast, by Application 2019 & 2032
- Table 48: South Africa Next Generation Network Industry Revenue (Million) Forecast, by Application 2019 & 2032
- Table 49: Rest of Middle East and Africa Next Generation Network Industry Revenue (Million) Forecast, by Application 2019 & 2032
- Table 50: Global Next Generation Network Industry Revenue Million Forecast, by Offering 2019 & 2032
- Table 51: Global Next Generation Network Industry Revenue Million Forecast, by End User 2019 & 2032
- Table 52: Global Next Generation Network Industry Revenue Million Forecast, by Country 2019 & 2032
- Table 53: Global Next Generation Network Industry Revenue Million Forecast, by Offering 2019 & 2032
- Table 54: Global Next Generation Network Industry Revenue Million Forecast, by End User 2019 & 2032
- Table 55: Global Next Generation Network Industry Revenue Million Forecast, by Country 2019 & 2032
- Table 56: Global Next Generation Network Industry Revenue Million Forecast, by Offering 2019 & 2032
- Table 57: Global Next Generation Network Industry Revenue Million Forecast, by End User 2019 & 2032
- Table 58: Global Next Generation Network Industry Revenue Million Forecast, by Country 2019 & 2032
- Table 59: Global Next Generation Network Industry Revenue Million Forecast, by Offering 2019 & 2032
- Table 60: Global Next Generation Network Industry Revenue Million Forecast, by End User 2019 & 2032
- Table 61: Global Next Generation Network Industry Revenue Million Forecast, by Country 2019 & 2032
- Table 62: Global Next Generation Network Industry Revenue Million Forecast, by Offering 2019 & 2032
- Table 63: Global Next Generation Network Industry Revenue Million Forecast, by End User 2019 & 2032
- Table 64: Global Next Generation Network Industry Revenue Million Forecast, by Country 2019 & 2032
Frequently Asked Questions
1. What is the projected Compound Annual Growth Rate (CAGR) of the Next Generation Network Industry?
The projected CAGR is approximately 7.70%.
2. Which companies are prominent players in the Next Generation Network Industry?
Key companies in the market include IBM Corporation, Samsung Electronics Co Ltd, Cisco Systems Inc, Juniper Networks Inc, Telefonaktiebolaget LM Ericsso, NEC Corporation, Huawei Technologies Co Ltd, ZTE Corporation, Nokia Corporation, Ciena Corporation.
3. What are the main segments of the Next Generation Network Industry?
The market segments include Offering, End User.
4. Can you provide details about the market size?
The market size is estimated to be USD 30.55 Million as of 2022.
5. What are some drivers contributing to market growth?
Increasing Demand for High-Speed Services.
6. What are the notable trends driving market growth?
Hardware Offering Holds Significant Market Share.
7. Are there any restraints impacting market growth?
High Costs Related to the Infrastructure.
8. Can you provide examples of recent developments in the market?
February 2024 - Schneider Electric, delivering next-generation, open automation infrastructure in collaboration with the technology companies Intel and Red Hat, released a Distributed Control Node (DCN) software framework. An expansion of Schneider Electric's EcoStruxure Automation Expert, this new framework allows industrial companies to move to a software-defined, plug-and-produce solution, enabling them to augment their operations, ensure quality, minimize complexity, and optimize costs.
9. What pricing options are available for accessing the report?
Pricing options include single-user, multi-user, and enterprise licenses priced at USD 4750, USD 5250, and USD 8750 respectively.
10. Is the market size provided in terms of value or volume?
The market size is provided in terms of value, measured in Million.
11. Are there any specific market keywords associated with the report?
Yes, the market keyword associated with the report is "Next Generation Network Industry," which aids in identifying and referencing the specific market segment covered.
12. How do I determine which pricing option suits my needs best?
The pricing options vary based on user requirements and access needs. Individual users may opt for single-user licenses, while businesses requiring broader access may choose multi-user or enterprise licenses for cost-effective access to the report.
13. Are there any additional resources or data provided in the Next Generation Network Industry report?
While the report offers comprehensive insights, it's advisable to review the specific contents or supplementary materials provided to ascertain if additional resources or data are available.
14. How can I stay updated on further developments or reports in the Next Generation Network Industry?
To stay informed about further developments, trends, and reports in the Next Generation Network Industry, consider subscribing to industry newsletters, following relevant companies and organizations, or regularly checking reputable industry news sources and publications.
Methodology
Step 1 - Identification of Relevant Samples Size from Population Database


Step 2 - Approaches for Defining Global Market Size (Value, Volume* & Price*)

Note*: In applicable scenarios
Step 3 - Data Sources
Primary Research
- Web Analytics
- Survey Reports
- Research Institute
- Latest Research Reports
- Opinion Leaders
Secondary Research
- Annual Reports
- White Paper
- Latest Press Release
- Industry Association
- Paid Database
- Investor Presentations

Step 4 - Data Triangulation
Involves using different sources of information in order to increase the validity of a study
These sources are likely to be stakeholders in a program - participants, other researchers, program staff, other community members, and so on.
Then we put all data in single framework & apply various statistical tools to find out the dynamic on the market.
During the analysis stage, feedback from the stakeholder groups would be compared to determine areas of agreement as well as areas of divergence
