

Key Insights
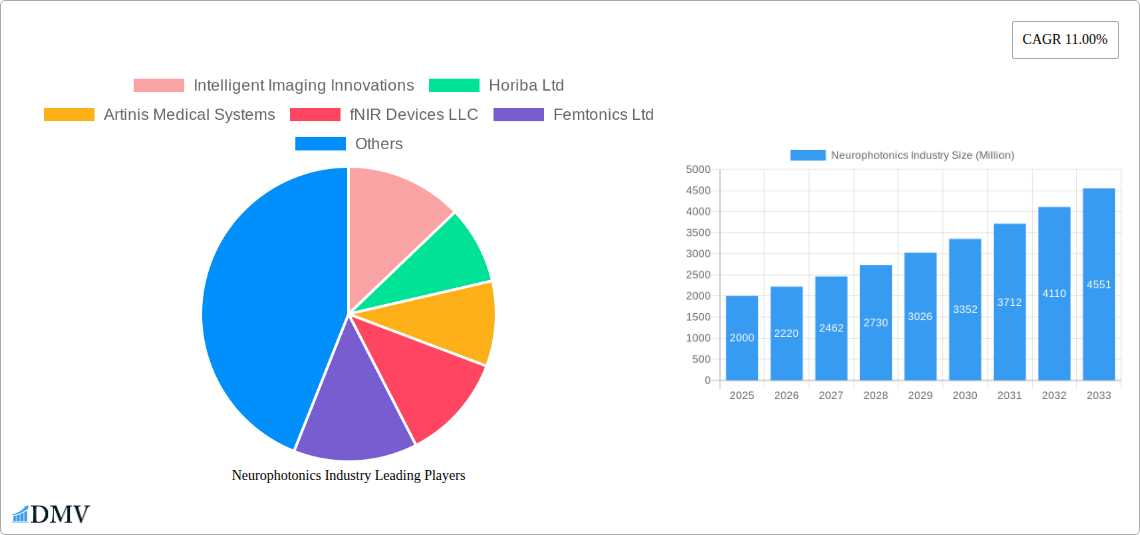
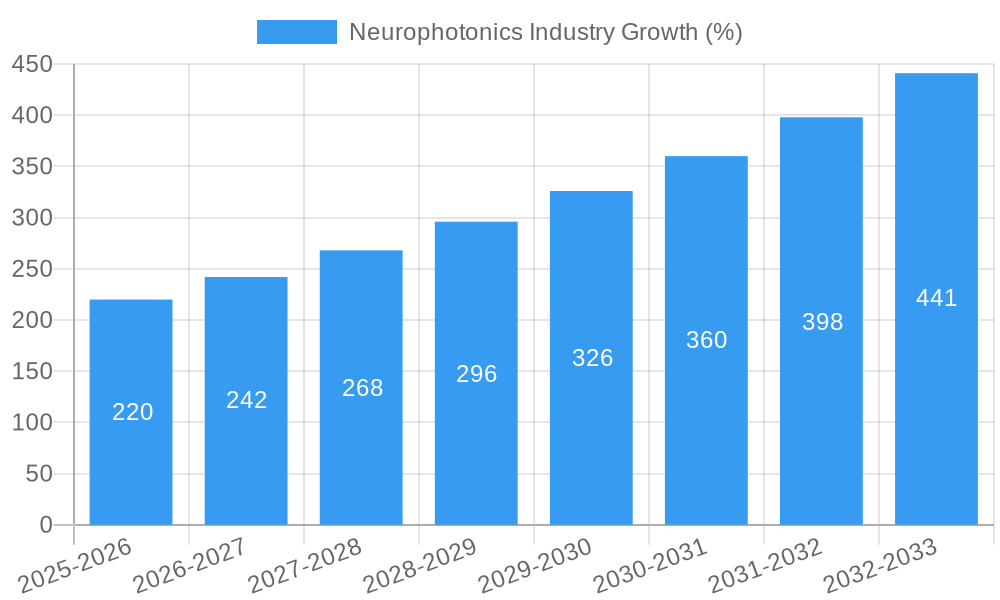
The neurophotonics market, valued at approximately $2 billion in 2025, is experiencing robust growth, projected to reach $5 billion by 2033, exhibiting a Compound Annual Growth Rate (CAGR) of 11%. This expansion is fueled by several key drivers. Advancements in imaging technologies, particularly microscopy and spectroscopy techniques, are enabling increasingly sophisticated investigations of neural structures and functions. The rising prevalence of neurological disorders, including Alzheimer's disease, Parkinson's disease, and traumatic brain injuries, is driving demand for advanced diagnostic and therapeutic tools. Furthermore, the growing adoption of multimodal imaging systems, which combine various optical techniques for comprehensive neural analysis, is significantly contributing to market growth. The research sector is a major consumer of neurophotonics technologies, with ongoing efforts to understand brain function and develop novel treatments constantly requiring advanced instrumentation. Therapeutic applications, including neurosurgery and optogenetics, are also emerging as significant growth drivers, as these fields benefit from the high precision and minimally invasive nature of photonics-based techniques.
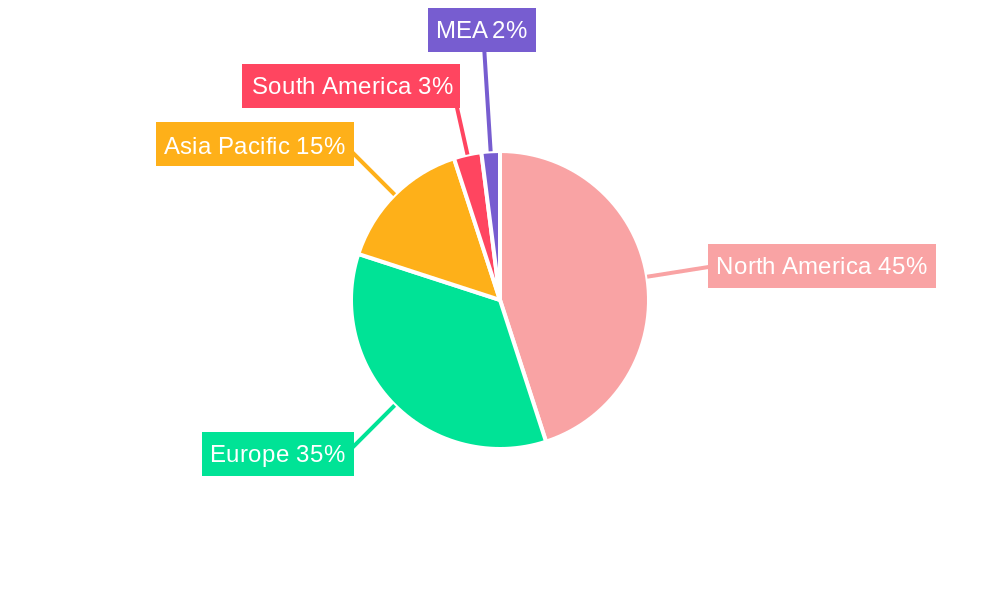
However, the market faces certain restraints. The high cost of neurophotonics equipment and the need for specialized expertise limit accessibility, especially in resource-constrained settings. The complexity of data analysis associated with advanced neurophotonics systems also presents a challenge. Despite these challenges, the market's growth trajectory remains positive, fueled by continuous technological innovations, increasing research funding, and a growing awareness of the potential of neurophotonics in addressing pressing neurological healthcare needs. The market segmentation reveals that microscopy currently holds the largest share of the system type segment, driven by its extensive use in basic and translational neuroscience research, while diagnostic applications are driving a significant portion of market growth within the application segment. Geographic segmentation shows North America and Europe currently dominating market share, reflecting the higher concentration of research facilities and advanced healthcare infrastructure in these regions. However, the Asia-Pacific region is projected to experience substantial growth in the coming years, driven by increased research investments and expanding healthcare infrastructure.
Neurophotonics Industry Market Report: 2019-2033 Forecast
This comprehensive report provides an in-depth analysis of the Neurophotonics industry, projecting a market value of $XX Million by 2033. It examines market trends, leading players, technological advancements, and future growth opportunities, offering crucial insights for stakeholders seeking to navigate this rapidly evolving sector. The study period spans 2019-2033, with 2025 serving as both the base and estimated year. The forecast period covers 2025-2033, and the historical period encompasses 2019-2024.
Neurophotonics Industry Market Composition & Trends
The Neurophotonics market, valued at $XX Million in 2025, exhibits a moderately concentrated landscape. Key players like Horiba Ltd, Carl Zeiss AG, and Leica Microsystems hold significant market share, while smaller companies like Intelligent Imaging Innovations, Artinis Medical Systems, fNIR Devices LLC, Femtonics Ltd, Cairn Research, Hitachi Ltd, and HemoPhotonics contribute to the competitive dynamics. Innovation is driven by advancements in optical imaging technologies and the growing need for minimally invasive neurological diagnostics and therapeutics. Regulatory landscapes vary across geographies, influencing market access and adoption rates. Substitute products, such as traditional neuroimaging techniques, pose some competitive pressure, but the unique advantages of neurophotonics in terms of resolution and non-invasiveness are increasingly driving adoption. End-users include research institutions, hospitals, and pharmaceutical companies.
- Market Share Distribution (2025): Horiba Ltd (XX%), Carl Zeiss AG (XX%), Leica Microsystems (XX%), Others (XX%).
- M&A Activity (2019-2024): XX deals totaling approximately $XX Million in value.
- Key End-Users: Research institutions (XX%), Hospitals (XX%), Pharmaceutical companies (XX%).
Neurophotonics Industry Industry Evolution
The Neurophotonics market demonstrates a robust growth trajectory, driven by technological advancements such as improved sensitivity and resolution in optical imaging systems, along with miniaturization and portability of devices. From 2019 to 2024, the market experienced a Compound Annual Growth Rate (CAGR) of XX%, reaching $XX Million in 2024. This growth is further fueled by the increasing demand for precise and non-invasive neurodiagnostic and therapeutic tools. The rising prevalence of neurological disorders and growing investments in research and development are also key factors. The shift in consumer demand is towards more accurate, faster, and user-friendly systems, driving innovation in user interfaces and data analysis software. We project a CAGR of XX% from 2025 to 2033, pushing the market value to $XX Million by 2033. Adoption rates are increasing across diverse applications due to technological improvements and a greater understanding of the clinical value of neurophotonics.
Leading Regions, Countries, or Segments in Neurophotonics Industry
North America currently holds the leading position in the neurophotonics market, driven by substantial investments in research, a well-established healthcare infrastructure, and the presence of major players. Europe follows closely, with strong academic and industrial collaboration in this field.
- Key Drivers for North American Dominance:
- High levels of R&D funding in neuroscience and medical technology.
- Stringent regulatory frameworks supporting innovation and market entry.
- Presence of major neurophotonics companies and research institutions.
- System Type: Microscopy holds the largest segment share (XX%), driven by its widespread use in both basic research and clinical settings. Spectroscopy (XX%) and Multimodal (XX%) imaging are also experiencing significant growth, owing to their enhanced capabilities.
- Application: Research (XX%) currently dominates, but the Diagnostics (XX%) and Therapeutics (XX%) segments are expected to see substantial growth due to the clinical translation of neurophotonics technologies.
Neurophotonics Industry Product Innovations
Recent innovations focus on enhanced sensitivity, improved resolution, and miniaturized devices for in-vivo applications. The development of advanced light sources, detectors, and image processing algorithms has significantly improved the quality and speed of neurophotonics data acquisition. New applications, such as functional near-infrared spectroscopy (fNIRS) for brain-computer interfaces (BCIs) and targeted therapies, are driving market expansion. The unique selling proposition of many neurophotonics products lies in their non-invasive nature, allowing for repeated measurements without the need for surgery or ionizing radiation.
Propelling Factors for Neurophotonics Industry Growth
Technological advancements in optical imaging, improved data analysis techniques, and miniaturization are primary growth drivers. Increased funding for neuroscience research and a growing prevalence of neurological disorders create a high demand for effective diagnostic and therapeutic tools. Favorable regulatory environments in key markets are further accelerating market growth. For example, the FDA approval of specific neurophotonics devices accelerates adoption in clinical settings.
Obstacles in the Neurophotonics Industry Market
High initial investment costs, complex data analysis procedures, and the need for specialized expertise can hinder wider adoption. Supply chain disruptions can impact the availability of critical components, potentially impacting production timelines and market supply. Competition from established neuroimaging techniques and varying regulatory approvals across regions present additional challenges. These factors may cause a slowdown in market growth by approximately XX% in specific regions during the forecast period.
Future Opportunities in Neurophotonics Industry
The integration of neurophotonics with artificial intelligence (AI) for automated data analysis and improved diagnostic accuracy offers significant opportunities. Expanding applications in personalized medicine and the development of novel therapeutic modalities using light-based techniques represent lucrative avenues for market growth. New applications in areas such as ophthalmology and cardiology are emerging, broadening the market potential beyond neurological applications.
Major Players in the Neurophotonics Industry Ecosystem
- Intelligent Imaging Innovations
- Horiba Ltd
- Artinis Medical Systems
- fNIR Devices LLC
- Femtonics Ltd
- Cairn Research
- Hitachi Ltd
- Carl Zeiss AG
- Leica Microsystems
- HemoPhotonics
Key Developments in Neurophotonics Industry Industry
- 2022 Q4: Horiba Ltd launched a new generation of multiphoton microscopy system.
- 2023 Q1: Carl Zeiss AG announced a strategic partnership to develop AI-powered neurophotonics software.
- 2023 Q3: A significant merger between two smaller neurophotonics companies resulted in expansion into new application areas. (Further details unavailable, data pending.)
Strategic Neurophotonics Industry Market Forecast
The Neurophotonics market is poised for substantial growth, driven by continuous technological advancements, increasing demand for non-invasive neurodiagnostic and therapeutic tools, and expanding applications across various medical fields. The convergence of neurophotonics with AI and other advanced technologies will further propel market expansion, creating new opportunities for market entrants and established players alike. The market is projected to reach $XX Million by 2033, demonstrating significant growth potential.
Neurophotonics Industry Segmentation
-
1. System Type
- 1.1. Microscopy
- 1.2. Spectroscopy
- 1.3. Multimodal
- 1.4. Other System Type
-
2. Application
- 2.1. Research
- 2.2. Diagnostics
- 2.3. Therapeutics
Neurophotonics Industry Segmentation By Geography
- 1. North America
- 2. Europe
- 3. Asia Pacific
- 4. Rest of World
Neurophotonics Industry REPORT HIGHLIGHTS
| Aspects | Details |
|---|---|
| Study Period | 2019-2033 |
| Base Year | 2024 |
| Estimated Year | 2025 |
| Forecast Period | 2025-2033 |
| Historical Period | 2019-2024 |
| Growth Rate | CAGR of 11.00% from 2019-2033 |
| Segmentation |
|
Table of Contents
- 1. Introduction
- 1.1. Research Scope
- 1.2. Market Segmentation
- 1.3. Research Methodology
- 1.4. Definitions and Assumptions
- 2. Executive Summary
- 2.1. Introduction
- 3. Market Dynamics
- 3.1. Introduction
- 3.2. Market Drivers
- 3.2.1. ; Increasing Government Initiative for Research and Development; Technological Advancement in Pain Detection Technology
- 3.3. Market Restrains
- 3.3.1. ; Accessing the Human Brain in Live Individuals is Difficult
- 3.4. Market Trends
- 3.4.1. Increasing Research Activities Offers Potential Growth
- 4. Market Factor Analysis
- 4.1. Porters Five Forces
- 4.2. Supply/Value Chain
- 4.3. PESTEL analysis
- 4.4. Market Entropy
- 4.5. Patent/Trademark Analysis
- 5. Global Neurophotonics Industry Analysis, Insights and Forecast, 2019-2031
- 5.1. Market Analysis, Insights and Forecast - by System Type
- 5.1.1. Microscopy
- 5.1.2. Spectroscopy
- 5.1.3. Multimodal
- 5.1.4. Other System Type
- 5.2. Market Analysis, Insights and Forecast - by Application
- 5.2.1. Research
- 5.2.2. Diagnostics
- 5.2.3. Therapeutics
- 5.3. Market Analysis, Insights and Forecast - by Region
- 5.3.1. North America
- 5.3.2. Europe
- 5.3.3. Asia Pacific
- 5.3.4. Rest of World
- 5.1. Market Analysis, Insights and Forecast - by System Type
- 6. North America Neurophotonics Industry Analysis, Insights and Forecast, 2019-2031
- 6.1. Market Analysis, Insights and Forecast - by System Type
- 6.1.1. Microscopy
- 6.1.2. Spectroscopy
- 6.1.3. Multimodal
- 6.1.4. Other System Type
- 6.2. Market Analysis, Insights and Forecast - by Application
- 6.2.1. Research
- 6.2.2. Diagnostics
- 6.2.3. Therapeutics
- 6.1. Market Analysis, Insights and Forecast - by System Type
- 7. Europe Neurophotonics Industry Analysis, Insights and Forecast, 2019-2031
- 7.1. Market Analysis, Insights and Forecast - by System Type
- 7.1.1. Microscopy
- 7.1.2. Spectroscopy
- 7.1.3. Multimodal
- 7.1.4. Other System Type
- 7.2. Market Analysis, Insights and Forecast - by Application
- 7.2.1. Research
- 7.2.2. Diagnostics
- 7.2.3. Therapeutics
- 7.1. Market Analysis, Insights and Forecast - by System Type
- 8. Asia Pacific Neurophotonics Industry Analysis, Insights and Forecast, 2019-2031
- 8.1. Market Analysis, Insights and Forecast - by System Type
- 8.1.1. Microscopy
- 8.1.2. Spectroscopy
- 8.1.3. Multimodal
- 8.1.4. Other System Type
- 8.2. Market Analysis, Insights and Forecast - by Application
- 8.2.1. Research
- 8.2.2. Diagnostics
- 8.2.3. Therapeutics
- 8.1. Market Analysis, Insights and Forecast - by System Type
- 9. Rest of World Neurophotonics Industry Analysis, Insights and Forecast, 2019-2031
- 9.1. Market Analysis, Insights and Forecast - by System Type
- 9.1.1. Microscopy
- 9.1.2. Spectroscopy
- 9.1.3. Multimodal
- 9.1.4. Other System Type
- 9.2. Market Analysis, Insights and Forecast - by Application
- 9.2.1. Research
- 9.2.2. Diagnostics
- 9.2.3. Therapeutics
- 9.1. Market Analysis, Insights and Forecast - by System Type
- 10. North America Neurophotonics Industry Analysis, Insights and Forecast, 2019-2031
- 10.1. Market Analysis, Insights and Forecast - By Country/Sub-region
- 10.1.1. undefined
- 11. Europe Neurophotonics Industry Analysis, Insights and Forecast, 2019-2031
- 11.1. Market Analysis, Insights and Forecast - By Country/Sub-region
- 11.1.1. undefined
- 12. Asia Pacific Neurophotonics Industry Analysis, Insights and Forecast, 2019-2031
- 12.1. Market Analysis, Insights and Forecast - By Country/Sub-region
- 12.1.1. undefined
- 13. South America Neurophotonics Industry Analysis, Insights and Forecast, 2019-2031
- 13.1. Market Analysis, Insights and Forecast - By Country/Sub-region
- 13.1.1. undefined
- 14. North America Neurophotonics Industry Analysis, Insights and Forecast, 2019-2031
- 14.1. Market Analysis, Insights and Forecast - By Country/Sub-region
- 14.1.1. undefined
- 15. MEA Neurophotonics Industry Analysis, Insights and Forecast, 2019-2031
- 15.1. Market Analysis, Insights and Forecast - By Country/Sub-region
- 15.1.1. undefined
- 16. Competitive Analysis
- 16.1. Global Market Share Analysis 2024
- 16.2. Company Profiles
- 16.2.1 Intelligent Imaging Innovations
- 16.2.1.1. Overview
- 16.2.1.2. Products
- 16.2.1.3. SWOT Analysis
- 16.2.1.4. Recent Developments
- 16.2.1.5. Financials (Based on Availability)
- 16.2.2 Horiba Ltd
- 16.2.2.1. Overview
- 16.2.2.2. Products
- 16.2.2.3. SWOT Analysis
- 16.2.2.4. Recent Developments
- 16.2.2.5. Financials (Based on Availability)
- 16.2.3 Artinis Medical Systems
- 16.2.3.1. Overview
- 16.2.3.2. Products
- 16.2.3.3. SWOT Analysis
- 16.2.3.4. Recent Developments
- 16.2.3.5. Financials (Based on Availability)
- 16.2.4 fNIR Devices LLC
- 16.2.4.1. Overview
- 16.2.4.2. Products
- 16.2.4.3. SWOT Analysis
- 16.2.4.4. Recent Developments
- 16.2.4.5. Financials (Based on Availability)
- 16.2.5 Femtonics Ltd
- 16.2.5.1. Overview
- 16.2.5.2. Products
- 16.2.5.3. SWOT Analysis
- 16.2.5.4. Recent Developments
- 16.2.5.5. Financials (Based on Availability)
- 16.2.6 Cairn Research
- 16.2.6.1. Overview
- 16.2.6.2. Products
- 16.2.6.3. SWOT Analysis
- 16.2.6.4. Recent Developments
- 16.2.6.5. Financials (Based on Availability)
- 16.2.7 Hitachi Ltd
- 16.2.7.1. Overview
- 16.2.7.2. Products
- 16.2.7.3. SWOT Analysis
- 16.2.7.4. Recent Developments
- 16.2.7.5. Financials (Based on Availability)
- 16.2.8 Carl Zeiss AG
- 16.2.8.1. Overview
- 16.2.8.2. Products
- 16.2.8.3. SWOT Analysis
- 16.2.8.4. Recent Developments
- 16.2.8.5. Financials (Based on Availability)
- 16.2.9 Leica Microsystems
- 16.2.9.1. Overview
- 16.2.9.2. Products
- 16.2.9.3. SWOT Analysis
- 16.2.9.4. Recent Developments
- 16.2.9.5. Financials (Based on Availability)
- 16.2.10 HemoPhotonics
- 16.2.10.1. Overview
- 16.2.10.2. Products
- 16.2.10.3. SWOT Analysis
- 16.2.10.4. Recent Developments
- 16.2.10.5. Financials (Based on Availability)
- 16.2.1 Intelligent Imaging Innovations
List of Figures
- Figure 1: Global Neurophotonics Industry Revenue Breakdown (Million, %) by Region 2024 & 2032
- Figure 2: Global Neurophotonics Industry Volume Breakdown (K Unit, %) by Region 2024 & 2032
- Figure 3: North America Neurophotonics Industry Revenue (Million), by Country 2024 & 2032
- Figure 4: North America Neurophotonics Industry Volume (K Unit), by Country 2024 & 2032
- Figure 5: North America Neurophotonics Industry Revenue Share (%), by Country 2024 & 2032
- Figure 6: North America Neurophotonics Industry Volume Share (%), by Country 2024 & 2032
- Figure 7: Europe Neurophotonics Industry Revenue (Million), by Country 2024 & 2032
- Figure 8: Europe Neurophotonics Industry Volume (K Unit), by Country 2024 & 2032
- Figure 9: Europe Neurophotonics Industry Revenue Share (%), by Country 2024 & 2032
- Figure 10: Europe Neurophotonics Industry Volume Share (%), by Country 2024 & 2032
- Figure 11: Asia Pacific Neurophotonics Industry Revenue (Million), by Country 2024 & 2032
- Figure 12: Asia Pacific Neurophotonics Industry Volume (K Unit), by Country 2024 & 2032
- Figure 13: Asia Pacific Neurophotonics Industry Revenue Share (%), by Country 2024 & 2032
- Figure 14: Asia Pacific Neurophotonics Industry Volume Share (%), by Country 2024 & 2032
- Figure 15: South America Neurophotonics Industry Revenue (Million), by Country 2024 & 2032
- Figure 16: South America Neurophotonics Industry Volume (K Unit), by Country 2024 & 2032
- Figure 17: South America Neurophotonics Industry Revenue Share (%), by Country 2024 & 2032
- Figure 18: South America Neurophotonics Industry Volume Share (%), by Country 2024 & 2032
- Figure 19: North America Neurophotonics Industry Revenue (Million), by Country 2024 & 2032
- Figure 20: North America Neurophotonics Industry Volume (K Unit), by Country 2024 & 2032
- Figure 21: North America Neurophotonics Industry Revenue Share (%), by Country 2024 & 2032
- Figure 22: North America Neurophotonics Industry Volume Share (%), by Country 2024 & 2032
- Figure 23: MEA Neurophotonics Industry Revenue (Million), by Country 2024 & 2032
- Figure 24: MEA Neurophotonics Industry Volume (K Unit), by Country 2024 & 2032
- Figure 25: MEA Neurophotonics Industry Revenue Share (%), by Country 2024 & 2032
- Figure 26: MEA Neurophotonics Industry Volume Share (%), by Country 2024 & 2032
- Figure 27: North America Neurophotonics Industry Revenue (Million), by System Type 2024 & 2032
- Figure 28: North America Neurophotonics Industry Volume (K Unit), by System Type 2024 & 2032
- Figure 29: North America Neurophotonics Industry Revenue Share (%), by System Type 2024 & 2032
- Figure 30: North America Neurophotonics Industry Volume Share (%), by System Type 2024 & 2032
- Figure 31: North America Neurophotonics Industry Revenue (Million), by Application 2024 & 2032
- Figure 32: North America Neurophotonics Industry Volume (K Unit), by Application 2024 & 2032
- Figure 33: North America Neurophotonics Industry Revenue Share (%), by Application 2024 & 2032
- Figure 34: North America Neurophotonics Industry Volume Share (%), by Application 2024 & 2032
- Figure 35: North America Neurophotonics Industry Revenue (Million), by Country 2024 & 2032
- Figure 36: North America Neurophotonics Industry Volume (K Unit), by Country 2024 & 2032
- Figure 37: North America Neurophotonics Industry Revenue Share (%), by Country 2024 & 2032
- Figure 38: North America Neurophotonics Industry Volume Share (%), by Country 2024 & 2032
- Figure 39: Europe Neurophotonics Industry Revenue (Million), by System Type 2024 & 2032
- Figure 40: Europe Neurophotonics Industry Volume (K Unit), by System Type 2024 & 2032
- Figure 41: Europe Neurophotonics Industry Revenue Share (%), by System Type 2024 & 2032
- Figure 42: Europe Neurophotonics Industry Volume Share (%), by System Type 2024 & 2032
- Figure 43: Europe Neurophotonics Industry Revenue (Million), by Application 2024 & 2032
- Figure 44: Europe Neurophotonics Industry Volume (K Unit), by Application 2024 & 2032
- Figure 45: Europe Neurophotonics Industry Revenue Share (%), by Application 2024 & 2032
- Figure 46: Europe Neurophotonics Industry Volume Share (%), by Application 2024 & 2032
- Figure 47: Europe Neurophotonics Industry Revenue (Million), by Country 2024 & 2032
- Figure 48: Europe Neurophotonics Industry Volume (K Unit), by Country 2024 & 2032
- Figure 49: Europe Neurophotonics Industry Revenue Share (%), by Country 2024 & 2032
- Figure 50: Europe Neurophotonics Industry Volume Share (%), by Country 2024 & 2032
- Figure 51: Asia Pacific Neurophotonics Industry Revenue (Million), by System Type 2024 & 2032
- Figure 52: Asia Pacific Neurophotonics Industry Volume (K Unit), by System Type 2024 & 2032
- Figure 53: Asia Pacific Neurophotonics Industry Revenue Share (%), by System Type 2024 & 2032
- Figure 54: Asia Pacific Neurophotonics Industry Volume Share (%), by System Type 2024 & 2032
- Figure 55: Asia Pacific Neurophotonics Industry Revenue (Million), by Application 2024 & 2032
- Figure 56: Asia Pacific Neurophotonics Industry Volume (K Unit), by Application 2024 & 2032
- Figure 57: Asia Pacific Neurophotonics Industry Revenue Share (%), by Application 2024 & 2032
- Figure 58: Asia Pacific Neurophotonics Industry Volume Share (%), by Application 2024 & 2032
- Figure 59: Asia Pacific Neurophotonics Industry Revenue (Million), by Country 2024 & 2032
- Figure 60: Asia Pacific Neurophotonics Industry Volume (K Unit), by Country 2024 & 2032
- Figure 61: Asia Pacific Neurophotonics Industry Revenue Share (%), by Country 2024 & 2032
- Figure 62: Asia Pacific Neurophotonics Industry Volume Share (%), by Country 2024 & 2032
- Figure 63: Rest of World Neurophotonics Industry Revenue (Million), by System Type 2024 & 2032
- Figure 64: Rest of World Neurophotonics Industry Volume (K Unit), by System Type 2024 & 2032
- Figure 65: Rest of World Neurophotonics Industry Revenue Share (%), by System Type 2024 & 2032
- Figure 66: Rest of World Neurophotonics Industry Volume Share (%), by System Type 2024 & 2032
- Figure 67: Rest of World Neurophotonics Industry Revenue (Million), by Application 2024 & 2032
- Figure 68: Rest of World Neurophotonics Industry Volume (K Unit), by Application 2024 & 2032
- Figure 69: Rest of World Neurophotonics Industry Revenue Share (%), by Application 2024 & 2032
- Figure 70: Rest of World Neurophotonics Industry Volume Share (%), by Application 2024 & 2032
- Figure 71: Rest of World Neurophotonics Industry Revenue (Million), by Country 2024 & 2032
- Figure 72: Rest of World Neurophotonics Industry Volume (K Unit), by Country 2024 & 2032
- Figure 73: Rest of World Neurophotonics Industry Revenue Share (%), by Country 2024 & 2032
- Figure 74: Rest of World Neurophotonics Industry Volume Share (%), by Country 2024 & 2032
List of Tables
- Table 1: Global Neurophotonics Industry Revenue Million Forecast, by Region 2019 & 2032
- Table 2: Global Neurophotonics Industry Volume K Unit Forecast, by Region 2019 & 2032
- Table 3: Global Neurophotonics Industry Revenue Million Forecast, by System Type 2019 & 2032
- Table 4: Global Neurophotonics Industry Volume K Unit Forecast, by System Type 2019 & 2032
- Table 5: Global Neurophotonics Industry Revenue Million Forecast, by Application 2019 & 2032
- Table 6: Global Neurophotonics Industry Volume K Unit Forecast, by Application 2019 & 2032
- Table 7: Global Neurophotonics Industry Revenue Million Forecast, by Region 2019 & 2032
- Table 8: Global Neurophotonics Industry Volume K Unit Forecast, by Region 2019 & 2032
- Table 9: Global Neurophotonics Industry Revenue Million Forecast, by Country 2019 & 2032
- Table 10: Global Neurophotonics Industry Volume K Unit Forecast, by Country 2019 & 2032
- Table 11: Global Neurophotonics Industry Revenue Million Forecast, by Country 2019 & 2032
- Table 12: Global Neurophotonics Industry Volume K Unit Forecast, by Country 2019 & 2032
- Table 13: Global Neurophotonics Industry Revenue Million Forecast, by Country 2019 & 2032
- Table 14: Global Neurophotonics Industry Volume K Unit Forecast, by Country 2019 & 2032
- Table 15: Global Neurophotonics Industry Revenue Million Forecast, by Country 2019 & 2032
- Table 16: Global Neurophotonics Industry Volume K Unit Forecast, by Country 2019 & 2032
- Table 17: Global Neurophotonics Industry Revenue Million Forecast, by Country 2019 & 2032
- Table 18: Global Neurophotonics Industry Volume K Unit Forecast, by Country 2019 & 2032
- Table 19: Global Neurophotonics Industry Revenue Million Forecast, by Country 2019 & 2032
- Table 20: Global Neurophotonics Industry Volume K Unit Forecast, by Country 2019 & 2032
- Table 21: Global Neurophotonics Industry Revenue Million Forecast, by System Type 2019 & 2032
- Table 22: Global Neurophotonics Industry Volume K Unit Forecast, by System Type 2019 & 2032
- Table 23: Global Neurophotonics Industry Revenue Million Forecast, by Application 2019 & 2032
- Table 24: Global Neurophotonics Industry Volume K Unit Forecast, by Application 2019 & 2032
- Table 25: Global Neurophotonics Industry Revenue Million Forecast, by Country 2019 & 2032
- Table 26: Global Neurophotonics Industry Volume K Unit Forecast, by Country 2019 & 2032
- Table 27: Global Neurophotonics Industry Revenue Million Forecast, by System Type 2019 & 2032
- Table 28: Global Neurophotonics Industry Volume K Unit Forecast, by System Type 2019 & 2032
- Table 29: Global Neurophotonics Industry Revenue Million Forecast, by Application 2019 & 2032
- Table 30: Global Neurophotonics Industry Volume K Unit Forecast, by Application 2019 & 2032
- Table 31: Global Neurophotonics Industry Revenue Million Forecast, by Country 2019 & 2032
- Table 32: Global Neurophotonics Industry Volume K Unit Forecast, by Country 2019 & 2032
- Table 33: Global Neurophotonics Industry Revenue Million Forecast, by System Type 2019 & 2032
- Table 34: Global Neurophotonics Industry Volume K Unit Forecast, by System Type 2019 & 2032
- Table 35: Global Neurophotonics Industry Revenue Million Forecast, by Application 2019 & 2032
- Table 36: Global Neurophotonics Industry Volume K Unit Forecast, by Application 2019 & 2032
- Table 37: Global Neurophotonics Industry Revenue Million Forecast, by Country 2019 & 2032
- Table 38: Global Neurophotonics Industry Volume K Unit Forecast, by Country 2019 & 2032
- Table 39: Global Neurophotonics Industry Revenue Million Forecast, by System Type 2019 & 2032
- Table 40: Global Neurophotonics Industry Volume K Unit Forecast, by System Type 2019 & 2032
- Table 41: Global Neurophotonics Industry Revenue Million Forecast, by Application 2019 & 2032
- Table 42: Global Neurophotonics Industry Volume K Unit Forecast, by Application 2019 & 2032
- Table 43: Global Neurophotonics Industry Revenue Million Forecast, by Country 2019 & 2032
- Table 44: Global Neurophotonics Industry Volume K Unit Forecast, by Country 2019 & 2032
Frequently Asked Questions
1. What is the projected Compound Annual Growth Rate (CAGR) of the Neurophotonics Industry?
The projected CAGR is approximately 11.00%.
2. Which companies are prominent players in the Neurophotonics Industry?
Key companies in the market include Intelligent Imaging Innovations, Horiba Ltd, Artinis Medical Systems, fNIR Devices LLC, Femtonics Ltd, Cairn Research, Hitachi Ltd , Carl Zeiss AG, Leica Microsystems, HemoPhotonics.
3. What are the main segments of the Neurophotonics Industry?
The market segments include System Type, Application.
4. Can you provide details about the market size?
The market size is estimated to be USD XX Million as of 2022.
5. What are some drivers contributing to market growth?
; Increasing Government Initiative for Research and Development; Technological Advancement in Pain Detection Technology.
6. What are the notable trends driving market growth?
Increasing Research Activities Offers Potential Growth.
7. Are there any restraints impacting market growth?
; Accessing the Human Brain in Live Individuals is Difficult.
8. Can you provide examples of recent developments in the market?
N/A
9. What pricing options are available for accessing the report?
Pricing options include single-user, multi-user, and enterprise licenses priced at USD 4750, USD 5250, and USD 8750 respectively.
10. Is the market size provided in terms of value or volume?
The market size is provided in terms of value, measured in Million and volume, measured in K Unit.
11. Are there any specific market keywords associated with the report?
Yes, the market keyword associated with the report is "Neurophotonics Industry," which aids in identifying and referencing the specific market segment covered.
12. How do I determine which pricing option suits my needs best?
The pricing options vary based on user requirements and access needs. Individual users may opt for single-user licenses, while businesses requiring broader access may choose multi-user or enterprise licenses for cost-effective access to the report.
13. Are there any additional resources or data provided in the Neurophotonics Industry report?
While the report offers comprehensive insights, it's advisable to review the specific contents or supplementary materials provided to ascertain if additional resources or data are available.
14. How can I stay updated on further developments or reports in the Neurophotonics Industry?
To stay informed about further developments, trends, and reports in the Neurophotonics Industry, consider subscribing to industry newsletters, following relevant companies and organizations, or regularly checking reputable industry news sources and publications.
Methodology
Step 1 - Identification of Relevant Samples Size from Population Database


Step 2 - Approaches for Defining Global Market Size (Value, Volume* & Price*)

Note*: In applicable scenarios
Step 3 - Data Sources
Primary Research
- Web Analytics
- Survey Reports
- Research Institute
- Latest Research Reports
- Opinion Leaders
Secondary Research
- Annual Reports
- White Paper
- Latest Press Release
- Industry Association
- Paid Database
- Investor Presentations

Step 4 - Data Triangulation
Involves using different sources of information in order to increase the validity of a study
These sources are likely to be stakeholders in a program - participants, other researchers, program staff, other community members, and so on.
Then we put all data in single framework & apply various statistical tools to find out the dynamic on the market.
During the analysis stage, feedback from the stakeholder groups would be compared to determine areas of agreement as well as areas of divergence
