

Key Insights
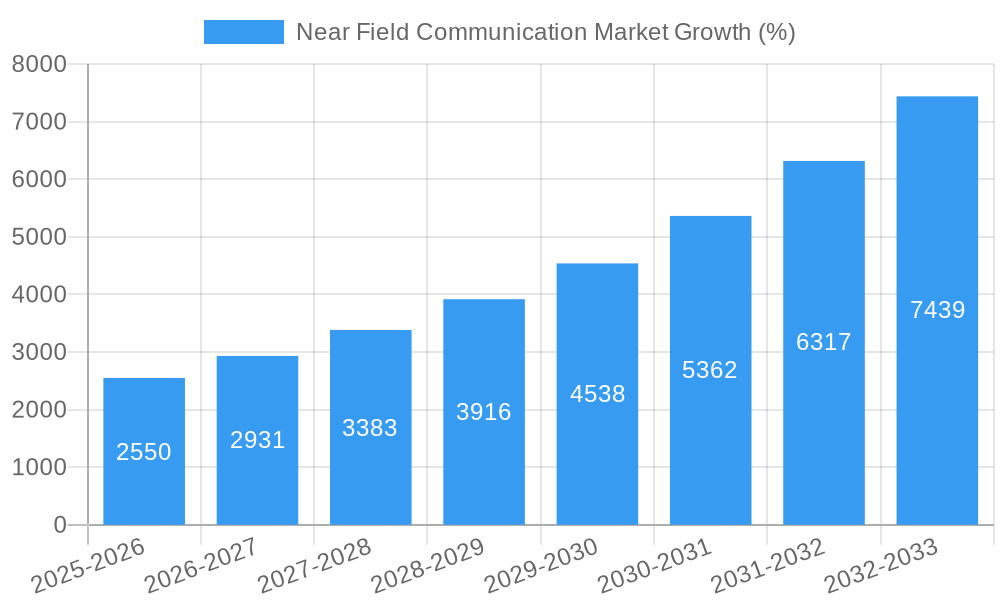
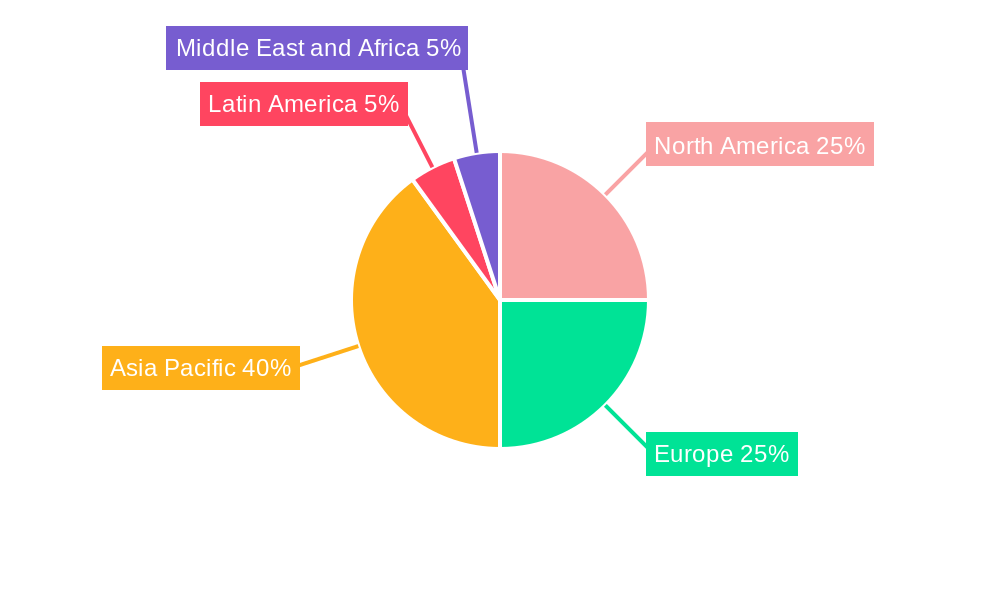
The Near Field Communication (NFC) market is experiencing robust growth, driven by the increasing adoption of contactless payment solutions, the expansion of mobile payment systems, and the proliferation of smartphones equipped with NFC capabilities. The market's Compound Annual Growth Rate (CAGR) of 17% from 2019 to 2024 suggests a significant upward trajectory, projecting substantial market expansion throughout the forecast period (2025-2033). Key market segments, including smartphones, PCs, and other consumer electronics, are contributing significantly to this growth. The BFSI (Banking, Financial Services, and Insurance) sector is a major end-user vertical, leveraging NFC for secure transactions and digital banking initiatives. Other significant end-user verticals include IT & Telecommunications, Retail, Healthcare, and Hospitality & Transportation, all witnessing increasing NFC integration for improved efficiency and enhanced user experiences. While specific regional market share data is unavailable, the global nature of NFC technology suggests a relatively balanced distribution across North America, Europe, and Asia Pacific, with Asia Pacific potentially holding the largest share due to its high smartphone penetration and expanding digital economy. Leading companies like STMicroelectronics, Infineon Technologies, NXP Semiconductors, and others are actively contributing to technological advancements and market expansion through innovations in NFC chipsets and solutions.
The continued growth of the NFC market is anticipated to be fueled by several factors. The increasing demand for secure and convenient contactless payment methods, particularly in emerging markets, will be a primary driver. Furthermore, the growing adoption of Internet of Things (IoT) devices and the expanding use of NFC for access control and data transfer in various applications, including healthcare and transportation, will further contribute to market expansion. However, potential restraints might include security concerns related to data breaches and the need for widespread NFC infrastructure development in certain regions. Nevertheless, the overall market outlook remains positive, indicating substantial opportunities for growth and innovation within the NFC ecosystem over the next decade.
Near Field Communication (NFC) Market Report: 2019-2033 Forecast
This comprehensive report provides an in-depth analysis of the Near Field Communication (NFC) market, offering invaluable insights for stakeholders seeking to navigate this rapidly evolving landscape. From market sizing and segmentation to competitive analysis and future projections, this report equips you with the knowledge to make informed strategic decisions. The study period covers 2019-2033, with 2025 as the base and estimated year, and a forecast period of 2025-2033. The historical period analyzed is 2019-2024. The market is valued at xx Million in 2025 and is projected to reach xx Million by 2033, exhibiting a CAGR of xx% during the forecast period.
Near Field Communication Market Composition & Trends
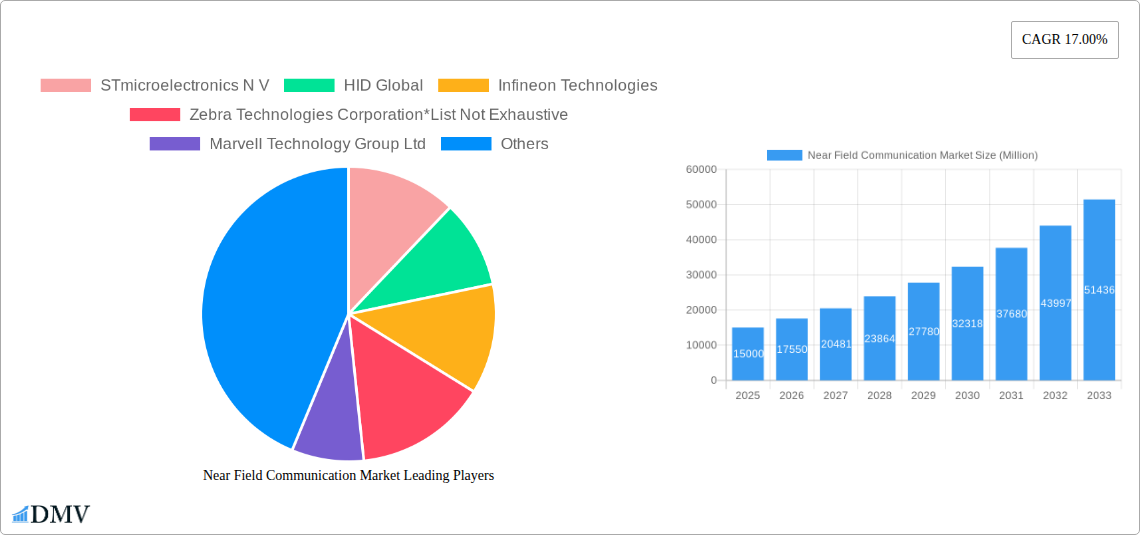
This section delves into the intricate dynamics of the NFC market, examining its structure, driving forces, and challenges. We analyze market concentration, revealing the share held by key players such as STmicroelectronics N V, HID Global, Infineon Technologies, and Zebra Technologies Corporation (among others). The report also explores innovation catalysts, including advancements in chip technology and antenna design, and assesses the impact of regulatory landscapes on market growth. Furthermore, it investigates substitute technologies and their potential to disrupt the NFC market. End-user profiles are comprehensively analyzed, outlining the unique needs and preferences of various segments. Finally, the report details significant M&A activities within the industry, including deal values and their impact on market consolidation. For instance, the report quantifies the market share distribution, revealing that the top 5 players hold approximately xx% of the market in 2025, and assesses the total value of M&A deals within the last 5 years at approximately xx Million.
- Market Concentration: Analysis of market share distribution among key players.
- Innovation Catalysts: Examination of technological advancements driving market growth.
- Regulatory Landscape: Assessment of regulatory frameworks and their impact.
- Substitute Products: Evaluation of alternative technologies and their competitive threat.
- End-User Profiles: Detailed analysis of end-user segments and their specific requirements.
- M&A Activities: Overview of mergers and acquisitions, including deal values and their consequences.
Near Field Communication Market Industry Evolution
This section provides a detailed chronological account of the NFC market's evolution, highlighting key milestones and growth patterns. We trace the market's trajectory from its inception to its current state, analyzing growth trajectories, technological advancements, and evolving consumer preferences. Specific data points like compound annual growth rates (CAGRs) and adoption rates across various end-user segments are presented, showcasing the dynamic nature of the market and its responsiveness to technological innovation and shifts in consumer behavior. This analysis includes a discussion of the factors that have propelled the market's growth, and an examination of the technological advancements that have enabled and facilitated this growth, as well as the impact of changing consumer habits on market demand. The report also quantifies the market growth rate at xx% for the historical period and projects xx% growth for the forecast period.
Leading Regions, Countries, or Segments in Near Field Communication Market
This section identifies the leading regions, countries, and segments within the NFC market. We examine both By End-Device (Smartphone, PCs and Other Consumer Electronics, Medical Equipment, Other End-Devices) and By End-user Vertical (BFSI, IT & Telecommunications, Retail, Healthcare, Hospitality and Transportation, Other End-users) segments. The analysis highlights the dominant segment and explores the factors driving its success. We utilize bullet points to outline key drivers such as investment trends and regulatory support, alongside detailed paragraphs providing comprehensive insights into the dominance factors.
- By End-Device: Smartphones consistently dominate, driven by increasing smartphone penetration and NFC integration in mobile payment systems.
- By End-user Vertical: The Retail sector is a leading adopter, fueled by the growing prevalence of contactless payments and inventory management systems.
- Key Drivers:
- Significant investments in contactless payment infrastructure.
- Government support for digital transformation initiatives.
- Increasing consumer demand for convenient and secure transactions.
Near Field Communication Market Product Innovations
This section showcases recent advancements in NFC technology, including new product applications and performance metrics. We highlight unique selling propositions and technological breakthroughs that are shaping the future of the NFC market, such as improvements in power consumption, data transfer speeds, and security features. These innovations are enabling wider adoption and pushing the boundaries of what is possible with near-field communication technology.
Propelling Factors for Near Field Communication Market Growth
Several factors are driving the growth of the NFC market. Technological advancements, such as enhanced security features and improved data transfer speeds, are key drivers. Economic factors, including the rising adoption of contactless payments and the increasing demand for convenient and secure transactions, play a significant role. Favorable regulatory environments, such as government initiatives promoting digital payments, are also contributing to the market's expansion.
Obstacles in the Near Field Communication Market
Despite the growth potential, several challenges hinder the widespread adoption of NFC technology. Regulatory hurdles, such as varying standards across different regions, create complexities for businesses seeking global expansion. Supply chain disruptions, particularly those related to semiconductor shortages, can impact production and availability of NFC-enabled devices. Intense competition among established players and emerging entrants further complicates the market landscape. These factors represent quantifiable impacts, leading to delayed project timelines and increased costs.
Future Opportunities in Near Field Communication Market
The NFC market presents significant opportunities for growth in untapped markets and through innovative applications. Expanding into emerging economies with increasing smartphone penetration offers substantial potential. The integration of NFC technology into new devices and applications, such as Internet of Things (IoT) devices and wearable technology, will unlock new avenues for growth. Moreover, the development of new functionalities and enhanced security features will attract new users and broaden the market reach.
Major Players in the Near Field Communication Market Ecosystem
- STmicroelectronics N V
- HID Global
- Infineon Technologies
- Zebra Technologies Corporation
- Marvell Technology Group Ltd
- NXP Semiconductors
- Smartrac N V
- Toshiba Electronic Devices & Storage Corporation
- Texas Instruments Incorporated
- Shanghai Fudan Microelectronics Group Company Limited
Key Developments in Near Field Communication Market Industry
- [Month, Year]: Company A launches new NFC chip with enhanced security features.
- [Month, Year]: Company B and Company C announce a strategic partnership to develop next-generation NFC solutions.
- [Month, Year]: New NFC standard is adopted globally, streamlining interoperability.
Strategic Near Field Communication Market Forecast
The NFC market is poised for continued growth, driven by technological advancements and increasing demand for contactless solutions. Future opportunities lie in expanding into new applications and markets, particularly in emerging economies. The market's potential is substantial, with significant growth expected across various segments, driven by factors such as the increasing adoption of contactless payments and the growing need for secure and convenient transactions. The market is expected to witness a significant upswing in growth during the forecast period.
Near Field Communication Market Segmentation
-
1. End-Device
- 1.1. Smartphone
- 1.2. PCs and Other Consumer Electronics
- 1.3. Medical Equipment
- 1.4. Other End-Devices
-
2. End-user Vertical
- 2.1. BFSI
- 2.2. IT & Telecommunications
- 2.3. Retail
- 2.4. Healthcare
- 2.5. Hospitality and Transportation
- 2.6. Other End-users
Near Field Communication Market Segmentation By Geography
- 1. North America
- 2. Europe
- 3. Asia Pacific
- 4. Latin America
- 5. Middle East and Africa
Near Field Communication Market REPORT HIGHLIGHTS
| Aspects | Details |
|---|---|
| Study Period | 2019-2033 |
| Base Year | 2024 |
| Estimated Year | 2025 |
| Forecast Period | 2025-2033 |
| Historical Period | 2019-2024 |
| Growth Rate | CAGR of 17.00% from 2019-2033 |
| Segmentation |
|
Table of Contents
- 1. Introduction
- 1.1. Research Scope
- 1.2. Market Segmentation
- 1.3. Research Methodology
- 1.4. Definitions and Assumptions
- 2. Executive Summary
- 2.1. Introduction
- 3. Market Dynamics
- 3.1. Introduction
- 3.2. Market Drivers
- 3.2.1. ; Increasing acceptance of contactless payments and authentication
- 3.3. Market Restrains
- 3.3.1. Complexities Associated with the Technology
- 3.4. Market Trends
- 3.4.1. Healthcare Industry Offers Potential Growth
- 4. Market Factor Analysis
- 4.1. Porters Five Forces
- 4.2. Supply/Value Chain
- 4.3. PESTEL analysis
- 4.4. Market Entropy
- 4.5. Patent/Trademark Analysis
- 5. Global Near Field Communication Market Analysis, Insights and Forecast, 2019-2031
- 5.1. Market Analysis, Insights and Forecast - by End-Device
- 5.1.1. Smartphone
- 5.1.2. PCs and Other Consumer Electronics
- 5.1.3. Medical Equipment
- 5.1.4. Other End-Devices
- 5.2. Market Analysis, Insights and Forecast - by End-user Vertical
- 5.2.1. BFSI
- 5.2.2. IT & Telecommunications
- 5.2.3. Retail
- 5.2.4. Healthcare
- 5.2.5. Hospitality and Transportation
- 5.2.6. Other End-users
- 5.3. Market Analysis, Insights and Forecast - by Region
- 5.3.1. North America
- 5.3.2. Europe
- 5.3.3. Asia Pacific
- 5.3.4. Latin America
- 5.3.5. Middle East and Africa
- 5.1. Market Analysis, Insights and Forecast - by End-Device
- 6. North America Near Field Communication Market Analysis, Insights and Forecast, 2019-2031
- 6.1. Market Analysis, Insights and Forecast - by End-Device
- 6.1.1. Smartphone
- 6.1.2. PCs and Other Consumer Electronics
- 6.1.3. Medical Equipment
- 6.1.4. Other End-Devices
- 6.2. Market Analysis, Insights and Forecast - by End-user Vertical
- 6.2.1. BFSI
- 6.2.2. IT & Telecommunications
- 6.2.3. Retail
- 6.2.4. Healthcare
- 6.2.5. Hospitality and Transportation
- 6.2.6. Other End-users
- 6.1. Market Analysis, Insights and Forecast - by End-Device
- 7. Europe Near Field Communication Market Analysis, Insights and Forecast, 2019-2031
- 7.1. Market Analysis, Insights and Forecast - by End-Device
- 7.1.1. Smartphone
- 7.1.2. PCs and Other Consumer Electronics
- 7.1.3. Medical Equipment
- 7.1.4. Other End-Devices
- 7.2. Market Analysis, Insights and Forecast - by End-user Vertical
- 7.2.1. BFSI
- 7.2.2. IT & Telecommunications
- 7.2.3. Retail
- 7.2.4. Healthcare
- 7.2.5. Hospitality and Transportation
- 7.2.6. Other End-users
- 7.1. Market Analysis, Insights and Forecast - by End-Device
- 8. Asia Pacific Near Field Communication Market Analysis, Insights and Forecast, 2019-2031
- 8.1. Market Analysis, Insights and Forecast - by End-Device
- 8.1.1. Smartphone
- 8.1.2. PCs and Other Consumer Electronics
- 8.1.3. Medical Equipment
- 8.1.4. Other End-Devices
- 8.2. Market Analysis, Insights and Forecast - by End-user Vertical
- 8.2.1. BFSI
- 8.2.2. IT & Telecommunications
- 8.2.3. Retail
- 8.2.4. Healthcare
- 8.2.5. Hospitality and Transportation
- 8.2.6. Other End-users
- 8.1. Market Analysis, Insights and Forecast - by End-Device
- 9. Latin America Near Field Communication Market Analysis, Insights and Forecast, 2019-2031
- 9.1. Market Analysis, Insights and Forecast - by End-Device
- 9.1.1. Smartphone
- 9.1.2. PCs and Other Consumer Electronics
- 9.1.3. Medical Equipment
- 9.1.4. Other End-Devices
- 9.2. Market Analysis, Insights and Forecast - by End-user Vertical
- 9.2.1. BFSI
- 9.2.2. IT & Telecommunications
- 9.2.3. Retail
- 9.2.4. Healthcare
- 9.2.5. Hospitality and Transportation
- 9.2.6. Other End-users
- 9.1. Market Analysis, Insights and Forecast - by End-Device
- 10. Middle East and Africa Near Field Communication Market Analysis, Insights and Forecast, 2019-2031
- 10.1. Market Analysis, Insights and Forecast - by End-Device
- 10.1.1. Smartphone
- 10.1.2. PCs and Other Consumer Electronics
- 10.1.3. Medical Equipment
- 10.1.4. Other End-Devices
- 10.2. Market Analysis, Insights and Forecast - by End-user Vertical
- 10.2.1. BFSI
- 10.2.2. IT & Telecommunications
- 10.2.3. Retail
- 10.2.4. Healthcare
- 10.2.5. Hospitality and Transportation
- 10.2.6. Other End-users
- 10.1. Market Analysis, Insights and Forecast - by End-Device
- 11. North America Near Field Communication Market Analysis, Insights and Forecast, 2019-2031
- 11.1. Market Analysis, Insights and Forecast - By Country/Sub-region
- 11.1.1.
- 12. Europe Near Field Communication Market Analysis, Insights and Forecast, 2019-2031
- 12.1. Market Analysis, Insights and Forecast - By Country/Sub-region
- 12.1.1.
- 13. Asia Pacific Near Field Communication Market Analysis, Insights and Forecast, 2019-2031
- 13.1. Market Analysis, Insights and Forecast - By Country/Sub-region
- 13.1.1.
- 14. Latin America Near Field Communication Market Analysis, Insights and Forecast, 2019-2031
- 14.1. Market Analysis, Insights and Forecast - By Country/Sub-region
- 14.1.1.
- 15. Middle East and Africa Near Field Communication Market Analysis, Insights and Forecast, 2019-2031
- 15.1. Market Analysis, Insights and Forecast - By Country/Sub-region
- 15.1.1.
- 16. Competitive Analysis
- 16.1. Global Market Share Analysis 2024
- 16.2. Company Profiles
- 16.2.1 STmicroelectronics N V
- 16.2.1.1. Overview
- 16.2.1.2. Products
- 16.2.1.3. SWOT Analysis
- 16.2.1.4. Recent Developments
- 16.2.1.5. Financials (Based on Availability)
- 16.2.2 HID Global
- 16.2.2.1. Overview
- 16.2.2.2. Products
- 16.2.2.3. SWOT Analysis
- 16.2.2.4. Recent Developments
- 16.2.2.5. Financials (Based on Availability)
- 16.2.3 Infineon Technologies
- 16.2.3.1. Overview
- 16.2.3.2. Products
- 16.2.3.3. SWOT Analysis
- 16.2.3.4. Recent Developments
- 16.2.3.5. Financials (Based on Availability)
- 16.2.4 Zebra Technologies Corporation*List Not Exhaustive
- 16.2.4.1. Overview
- 16.2.4.2. Products
- 16.2.4.3. SWOT Analysis
- 16.2.4.4. Recent Developments
- 16.2.4.5. Financials (Based on Availability)
- 16.2.5 Marvell Technology Group Ltd
- 16.2.5.1. Overview
- 16.2.5.2. Products
- 16.2.5.3. SWOT Analysis
- 16.2.5.4. Recent Developments
- 16.2.5.5. Financials (Based on Availability)
- 16.2.6 NXP Semiconductors
- 16.2.6.1. Overview
- 16.2.6.2. Products
- 16.2.6.3. SWOT Analysis
- 16.2.6.4. Recent Developments
- 16.2.6.5. Financials (Based on Availability)
- 16.2.7 Smartrac N V
- 16.2.7.1. Overview
- 16.2.7.2. Products
- 16.2.7.3. SWOT Analysis
- 16.2.7.4. Recent Developments
- 16.2.7.5. Financials (Based on Availability)
- 16.2.8 Toshiba Electronic Devices & Storage Corporation
- 16.2.8.1. Overview
- 16.2.8.2. Products
- 16.2.8.3. SWOT Analysis
- 16.2.8.4. Recent Developments
- 16.2.8.5. Financials (Based on Availability)
- 16.2.9 Texas Instruments Incorporated
- 16.2.9.1. Overview
- 16.2.9.2. Products
- 16.2.9.3. SWOT Analysis
- 16.2.9.4. Recent Developments
- 16.2.9.5. Financials (Based on Availability)
- 16.2.10 Shanghai Fudan Microelectronics Group Company Limited
- 16.2.10.1. Overview
- 16.2.10.2. Products
- 16.2.10.3. SWOT Analysis
- 16.2.10.4. Recent Developments
- 16.2.10.5. Financials (Based on Availability)
- 16.2.1 STmicroelectronics N V
List of Figures
- Figure 1: Global Near Field Communication Market Revenue Breakdown (Million, %) by Region 2024 & 2032
- Figure 2: North America Near Field Communication Market Revenue (Million), by Country 2024 & 2032
- Figure 3: North America Near Field Communication Market Revenue Share (%), by Country 2024 & 2032
- Figure 4: Europe Near Field Communication Market Revenue (Million), by Country 2024 & 2032
- Figure 5: Europe Near Field Communication Market Revenue Share (%), by Country 2024 & 2032
- Figure 6: Asia Pacific Near Field Communication Market Revenue (Million), by Country 2024 & 2032
- Figure 7: Asia Pacific Near Field Communication Market Revenue Share (%), by Country 2024 & 2032
- Figure 8: Latin America Near Field Communication Market Revenue (Million), by Country 2024 & 2032
- Figure 9: Latin America Near Field Communication Market Revenue Share (%), by Country 2024 & 2032
- Figure 10: Middle East and Africa Near Field Communication Market Revenue (Million), by Country 2024 & 2032
- Figure 11: Middle East and Africa Near Field Communication Market Revenue Share (%), by Country 2024 & 2032
- Figure 12: North America Near Field Communication Market Revenue (Million), by End-Device 2024 & 2032
- Figure 13: North America Near Field Communication Market Revenue Share (%), by End-Device 2024 & 2032
- Figure 14: North America Near Field Communication Market Revenue (Million), by End-user Vertical 2024 & 2032
- Figure 15: North America Near Field Communication Market Revenue Share (%), by End-user Vertical 2024 & 2032
- Figure 16: North America Near Field Communication Market Revenue (Million), by Country 2024 & 2032
- Figure 17: North America Near Field Communication Market Revenue Share (%), by Country 2024 & 2032
- Figure 18: Europe Near Field Communication Market Revenue (Million), by End-Device 2024 & 2032
- Figure 19: Europe Near Field Communication Market Revenue Share (%), by End-Device 2024 & 2032
- Figure 20: Europe Near Field Communication Market Revenue (Million), by End-user Vertical 2024 & 2032
- Figure 21: Europe Near Field Communication Market Revenue Share (%), by End-user Vertical 2024 & 2032
- Figure 22: Europe Near Field Communication Market Revenue (Million), by Country 2024 & 2032
- Figure 23: Europe Near Field Communication Market Revenue Share (%), by Country 2024 & 2032
- Figure 24: Asia Pacific Near Field Communication Market Revenue (Million), by End-Device 2024 & 2032
- Figure 25: Asia Pacific Near Field Communication Market Revenue Share (%), by End-Device 2024 & 2032
- Figure 26: Asia Pacific Near Field Communication Market Revenue (Million), by End-user Vertical 2024 & 2032
- Figure 27: Asia Pacific Near Field Communication Market Revenue Share (%), by End-user Vertical 2024 & 2032
- Figure 28: Asia Pacific Near Field Communication Market Revenue (Million), by Country 2024 & 2032
- Figure 29: Asia Pacific Near Field Communication Market Revenue Share (%), by Country 2024 & 2032
- Figure 30: Latin America Near Field Communication Market Revenue (Million), by End-Device 2024 & 2032
- Figure 31: Latin America Near Field Communication Market Revenue Share (%), by End-Device 2024 & 2032
- Figure 32: Latin America Near Field Communication Market Revenue (Million), by End-user Vertical 2024 & 2032
- Figure 33: Latin America Near Field Communication Market Revenue Share (%), by End-user Vertical 2024 & 2032
- Figure 34: Latin America Near Field Communication Market Revenue (Million), by Country 2024 & 2032
- Figure 35: Latin America Near Field Communication Market Revenue Share (%), by Country 2024 & 2032
- Figure 36: Middle East and Africa Near Field Communication Market Revenue (Million), by End-Device 2024 & 2032
- Figure 37: Middle East and Africa Near Field Communication Market Revenue Share (%), by End-Device 2024 & 2032
- Figure 38: Middle East and Africa Near Field Communication Market Revenue (Million), by End-user Vertical 2024 & 2032
- Figure 39: Middle East and Africa Near Field Communication Market Revenue Share (%), by End-user Vertical 2024 & 2032
- Figure 40: Middle East and Africa Near Field Communication Market Revenue (Million), by Country 2024 & 2032
- Figure 41: Middle East and Africa Near Field Communication Market Revenue Share (%), by Country 2024 & 2032
List of Tables
- Table 1: Global Near Field Communication Market Revenue Million Forecast, by Region 2019 & 2032
- Table 2: Global Near Field Communication Market Revenue Million Forecast, by End-Device 2019 & 2032
- Table 3: Global Near Field Communication Market Revenue Million Forecast, by End-user Vertical 2019 & 2032
- Table 4: Global Near Field Communication Market Revenue Million Forecast, by Region 2019 & 2032
- Table 5: Global Near Field Communication Market Revenue Million Forecast, by Country 2019 & 2032
- Table 6: Near Field Communication Market Revenue (Million) Forecast, by Application 2019 & 2032
- Table 7: Global Near Field Communication Market Revenue Million Forecast, by Country 2019 & 2032
- Table 8: Near Field Communication Market Revenue (Million) Forecast, by Application 2019 & 2032
- Table 9: Global Near Field Communication Market Revenue Million Forecast, by Country 2019 & 2032
- Table 10: Near Field Communication Market Revenue (Million) Forecast, by Application 2019 & 2032
- Table 11: Global Near Field Communication Market Revenue Million Forecast, by Country 2019 & 2032
- Table 12: Near Field Communication Market Revenue (Million) Forecast, by Application 2019 & 2032
- Table 13: Global Near Field Communication Market Revenue Million Forecast, by Country 2019 & 2032
- Table 14: Near Field Communication Market Revenue (Million) Forecast, by Application 2019 & 2032
- Table 15: Global Near Field Communication Market Revenue Million Forecast, by End-Device 2019 & 2032
- Table 16: Global Near Field Communication Market Revenue Million Forecast, by End-user Vertical 2019 & 2032
- Table 17: Global Near Field Communication Market Revenue Million Forecast, by Country 2019 & 2032
- Table 18: Global Near Field Communication Market Revenue Million Forecast, by End-Device 2019 & 2032
- Table 19: Global Near Field Communication Market Revenue Million Forecast, by End-user Vertical 2019 & 2032
- Table 20: Global Near Field Communication Market Revenue Million Forecast, by Country 2019 & 2032
- Table 21: Global Near Field Communication Market Revenue Million Forecast, by End-Device 2019 & 2032
- Table 22: Global Near Field Communication Market Revenue Million Forecast, by End-user Vertical 2019 & 2032
- Table 23: Global Near Field Communication Market Revenue Million Forecast, by Country 2019 & 2032
- Table 24: Global Near Field Communication Market Revenue Million Forecast, by End-Device 2019 & 2032
- Table 25: Global Near Field Communication Market Revenue Million Forecast, by End-user Vertical 2019 & 2032
- Table 26: Global Near Field Communication Market Revenue Million Forecast, by Country 2019 & 2032
- Table 27: Global Near Field Communication Market Revenue Million Forecast, by End-Device 2019 & 2032
- Table 28: Global Near Field Communication Market Revenue Million Forecast, by End-user Vertical 2019 & 2032
- Table 29: Global Near Field Communication Market Revenue Million Forecast, by Country 2019 & 2032
Frequently Asked Questions
1. What is the projected Compound Annual Growth Rate (CAGR) of the Near Field Communication Market?
The projected CAGR is approximately 17.00%.
2. Which companies are prominent players in the Near Field Communication Market?
Key companies in the market include STmicroelectronics N V, HID Global, Infineon Technologies, Zebra Technologies Corporation*List Not Exhaustive, Marvell Technology Group Ltd, NXP Semiconductors, Smartrac N V, Toshiba Electronic Devices & Storage Corporation, Texas Instruments Incorporated, Shanghai Fudan Microelectronics Group Company Limited.
3. What are the main segments of the Near Field Communication Market?
The market segments include End-Device, End-user Vertical.
4. Can you provide details about the market size?
The market size is estimated to be USD XX Million as of 2022.
5. What are some drivers contributing to market growth?
; Increasing acceptance of contactless payments and authentication.
6. What are the notable trends driving market growth?
Healthcare Industry Offers Potential Growth.
7. Are there any restraints impacting market growth?
Complexities Associated with the Technology.
8. Can you provide examples of recent developments in the market?
N/A
9. What pricing options are available for accessing the report?
Pricing options include single-user, multi-user, and enterprise licenses priced at USD 4750, USD 5250, and USD 8750 respectively.
10. Is the market size provided in terms of value or volume?
The market size is provided in terms of value, measured in Million.
11. Are there any specific market keywords associated with the report?
Yes, the market keyword associated with the report is "Near Field Communication Market," which aids in identifying and referencing the specific market segment covered.
12. How do I determine which pricing option suits my needs best?
The pricing options vary based on user requirements and access needs. Individual users may opt for single-user licenses, while businesses requiring broader access may choose multi-user or enterprise licenses for cost-effective access to the report.
13. Are there any additional resources or data provided in the Near Field Communication Market report?
While the report offers comprehensive insights, it's advisable to review the specific contents or supplementary materials provided to ascertain if additional resources or data are available.
14. How can I stay updated on further developments or reports in the Near Field Communication Market?
To stay informed about further developments, trends, and reports in the Near Field Communication Market, consider subscribing to industry newsletters, following relevant companies and organizations, or regularly checking reputable industry news sources and publications.
Methodology
Step 1 - Identification of Relevant Samples Size from Population Database


Step 2 - Approaches for Defining Global Market Size (Value, Volume* & Price*)

Note*: In applicable scenarios
Step 3 - Data Sources
Primary Research
- Web Analytics
- Survey Reports
- Research Institute
- Latest Research Reports
- Opinion Leaders
Secondary Research
- Annual Reports
- White Paper
- Latest Press Release
- Industry Association
- Paid Database
- Investor Presentations

Step 4 - Data Triangulation
Involves using different sources of information in order to increase the validity of a study
These sources are likely to be stakeholders in a program - participants, other researchers, program staff, other community members, and so on.
Then we put all data in single framework & apply various statistical tools to find out the dynamic on the market.
During the analysis stage, feedback from the stakeholder groups would be compared to determine areas of agreement as well as areas of divergence
