

Key Insights
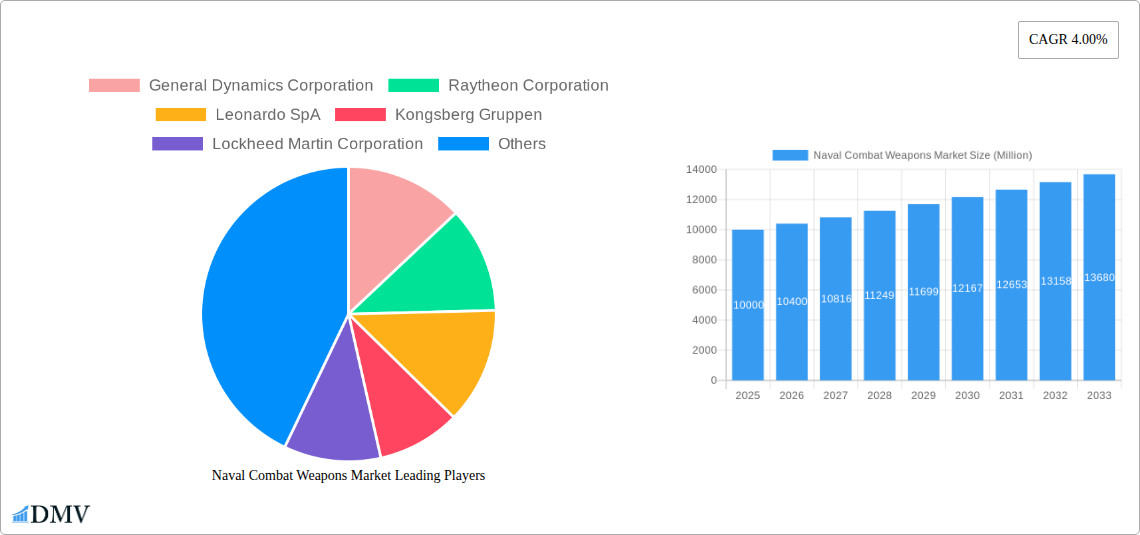
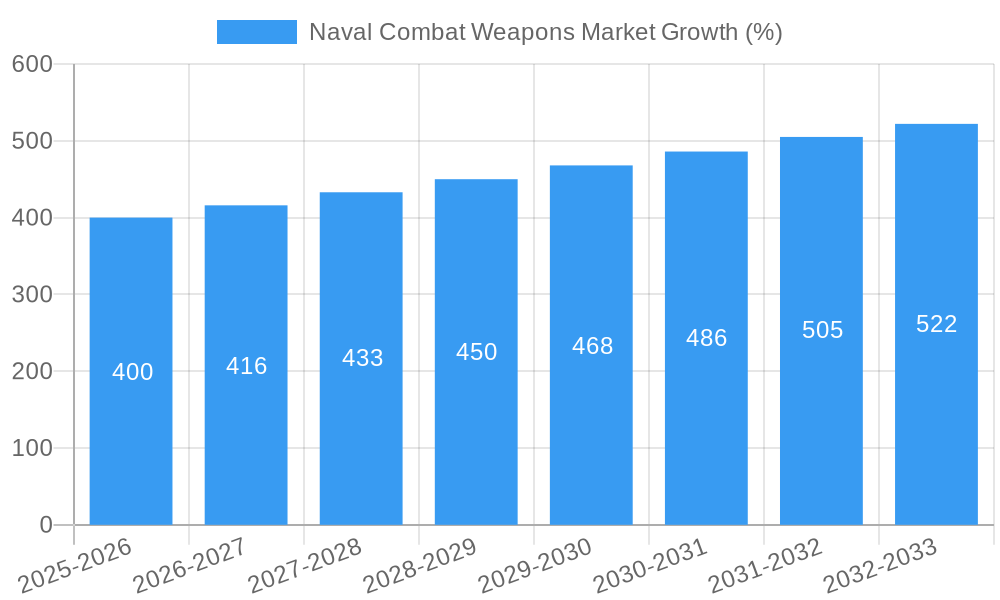
The Naval Combat Weapons market, valued at approximately $XX million in 2025, is projected to experience robust growth, exhibiting a Compound Annual Growth Rate (CAGR) of 4.00% from 2025 to 2033. This expansion is fueled by several key drivers. Firstly, escalating geopolitical tensions and the intensifying need for naval modernization across various nations are significantly boosting demand for advanced combat weapons systems. Secondly, technological advancements, such as the integration of artificial intelligence (AI) and improved precision-guided munitions, are enhancing the capabilities and effectiveness of these weapons, further driving market growth. Finally, the increasing focus on asymmetric warfare necessitates the development and deployment of versatile and adaptable naval combat weapons, contributing to the market's expansion. The market is segmented by platform type (underwater-based, surface-based) and application (small patrol boats, large aircraft carriers, submarines). Growth is expected to be particularly strong in the underwater-based weapons segment driven by the development of quieter and more effective torpedoes and anti-submarine warfare systems. Similarly, the large aircraft carrier application segment is likely to see considerable growth, reflecting the strategic importance of these vessels in modern naval operations. However, budgetary constraints in some regions and the lengthy procurement cycles associated with naval weaponry could act as market restraints.
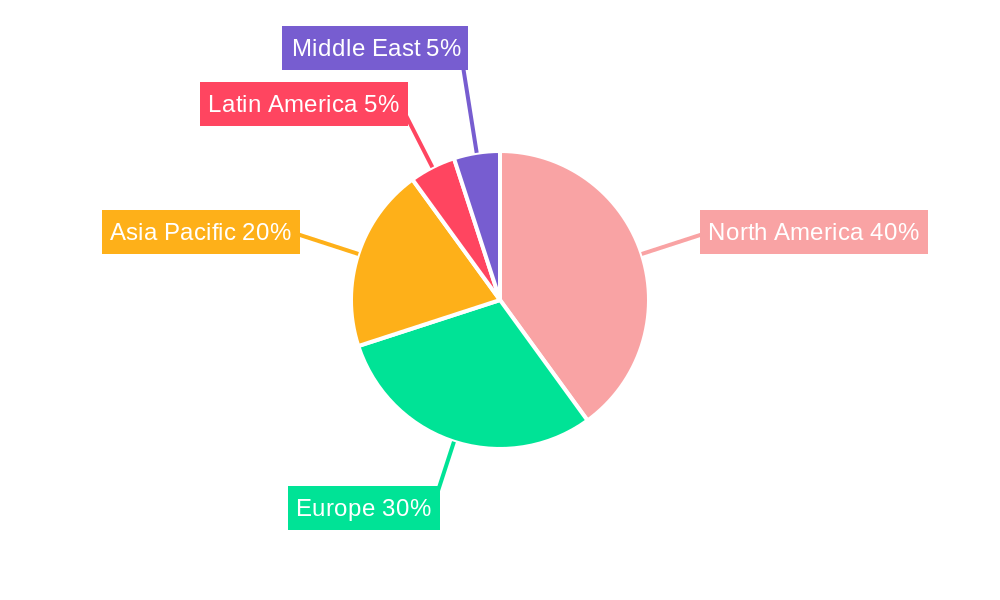
The competitive landscape is marked by the presence of established defense contractors like General Dynamics, Raytheon, Lockheed Martin, and others. These companies are actively investing in research and development to maintain their market share and introduce innovative solutions. Regional analysis indicates that North America and Europe currently dominate the market, owing to their significant naval capabilities and robust defense budgets. However, the Asia-Pacific region is expected to witness significant growth in the forecast period, driven by increasing defense spending and naval modernization initiatives in countries like India and China. The Middle East region also presents considerable growth potential due to geopolitical instability and the consequent need for enhanced naval defense capabilities. The ongoing investments in naval modernization across various regions indicate that the long-term growth trajectory of the naval combat weapons market remains optimistic.
Naval Combat Weapons Market: A Comprehensive Report (2019-2033)
This insightful report provides a detailed analysis of the global Naval Combat Weapons market, offering a comprehensive overview of market trends, leading players, technological advancements, and future growth prospects. The study covers the period from 2019 to 2033, with a base year of 2025 and a forecast period extending to 2033. The report is invaluable for stakeholders, investors, and industry professionals seeking to understand and capitalize on the opportunities within this dynamic sector. The market is estimated to be valued at xx Million in 2025 and is projected to reach xx Million by 2033.
Naval Combat Weapons Market Composition & Trends
The global Naval Combat Weapons market exhibits a moderately concentrated landscape, with key players like General Dynamics Corporation, Raytheon Corporation, Leonardo SpA, Kongsberg Gruppen, and Lockheed Martin Corporation holding significant market share. Market share distribution in 2025 is estimated as follows: General Dynamics (15%), Raytheon (12%), Leonardo (10%), Kongsberg (8%), Lockheed Martin (7%), others (48%). Innovation is primarily driven by advancements in guided missile technology, autonomous systems, and improved sensor capabilities. Stringent regulatory frameworks governing the production and export of naval weapons significantly influence market dynamics. Substitute products, while limited, include legacy weapon systems still in service. The end-user profile comprises primarily naval forces of various countries, with significant demand from major global powers and emerging naval nations. M&A activities in the past five years have totaled approximately xx Million, with the majority of deals focused on enhancing technological capabilities and expanding geographic reach.
- Market Concentration: Moderately concentrated, with a few dominant players.
- Innovation Catalysts: Guided missile technology, autonomous systems, improved sensors.
- Regulatory Landscape: Stringent, impacting production and export.
- Substitute Products: Limited, primarily legacy systems.
- End-User Profile: Primarily naval forces of various countries.
- M&A Activity: Approximately xx Million in the past five years.
Naval Combat Weapons Market Industry Evolution
The Naval Combat Weapons market has witnessed substantial growth over the historical period (2019-2024), experiencing a Compound Annual Growth Rate (CAGR) of xx%. This growth is primarily fueled by escalating geopolitical tensions, increased defense budgets globally, and the modernization of naval fleets worldwide. Technological advancements, particularly in areas like precision-guided munitions, hypersonic weapons, and unmanned underwater vehicles (UUVs), are revolutionizing naval warfare capabilities. Demand for advanced weapons systems is particularly high among large aircraft carriers and submarines, reflecting the strategic importance of these platforms. The adoption rate of new technologies is increasing steadily, driven by the need for improved accuracy, range, and lethality. However, economic downturns in certain regions and budget constraints in some countries can impact market growth. The forecast period (2025-2033) anticipates a CAGR of xx%, driven by continued technological innovation, rising defense spending in key regions, and the growing adoption of networked combat systems. Emerging technologies like directed energy weapons and artificial intelligence (AI) integrated systems are poised to further transform the market in the coming years.
Leading Regions, Countries, or Segments in Naval Combat Weapons Market
The North American region currently dominates the Naval Combat Weapons market, driven by strong defense budgets, technological advancements, and a robust domestic naval industry. This dominance is further fortified by substantial investment in research and development, government procurement policies favoring domestic companies, and a strong presence of major industry players. Europe also holds a substantial market share.
- Dominant Region: North America
- Key Drivers (North America): High defense spending, technological leadership, strong domestic industry.
- Key Drivers (Europe): Significant defense budgets, strong industrial base, international collaborations.
Segment Analysis:
- Underwater-Based Naval Combat Weapons: This segment is experiencing rapid growth due to advancements in submarine technology and the increasing importance of anti-submarine warfare (ASW).
- Surface-Based Combat Weapons: This segment maintains a significant market share, driven by the modernization of surface fleets and the development of advanced guided missile systems.
- Small Patrol Boats: This segment is growing due to the increasing need for coastal security and anti-piracy operations.
- Large Aircraft Carriers: This segment represents a significant portion of the market, reflecting the strategic importance of these platforms.
- Submarines: This segment is experiencing strong growth due to technological advancements and their strategic importance.
Naval Combat Weapons Market Product Innovations
Recent innovations include the development of hypersonic missiles with significantly increased speed and range, precision-guided munitions with improved accuracy, and autonomous underwater vehicles (UUVs) capable of performing various missions without human intervention. These advancements enhance the effectiveness and lethality of naval combat weapons, enabling greater accuracy, range, and survivability in modern naval warfare. Unique selling propositions include enhanced target acquisition capabilities, improved countermeasure resistance, and reduced collateral damage.
Propelling Factors for Naval Combat Weapons Market Growth
The Naval Combat Weapons market is propelled by several factors. Firstly, rising geopolitical tensions and increased defense spending by major global powers significantly boost demand. Secondly, technological advancements, such as the development of hypersonic weapons and AI-integrated systems, lead to enhanced combat capabilities, fostering further investment. Thirdly, the modernization of existing naval fleets and the construction of new vessels necessitate the procurement of advanced weapons systems. Finally, government regulations emphasizing the importance of naval power and the need for advanced defense systems further support market growth.
Obstacles in the Naval Combat Weapons Market
Challenges facing the market include stringent export controls, which limit the reach of certain products and technologies. Supply chain disruptions, particularly concerning critical components and raw materials, can affect production and delivery timelines. Furthermore, intense competition from established and emerging players, often involving price wars and technological rivalry, poses a continuous challenge. These factors can collectively impact market growth and profitability.
Future Opportunities in Naval Combat Weapons Market
Emerging opportunities lie in the development and adoption of directed energy weapons, autonomous weapons systems, and AI-enhanced targeting systems. Expanding into new markets, particularly in emerging economies with growing naval capabilities, presents substantial potential. Furthermore, advancements in hypersonic technology and the development of countermeasures against these weapons will shape future market trends.
Major Players in the Naval Combat Weapons Market Ecosystem
- General Dynamics Corporation
- Raytheon Corporation
- Leonardo SpA
- Kongsberg Gruppen
- Lockheed Martin Corporation
- Terma
- QinetiQ Group
- Elbit Systems
- Thales Corporation
- L3 Harris Corporation
- BAE Systems Plc
- SAAB AB
Key Developments in Naval Combat Weapons Market Industry
- January 2023: Raytheon successfully tested a new hypersonic missile.
- June 2022: Lockheed Martin secured a major contract for the supply of advanced guided missiles.
- October 2021: General Dynamics announced a strategic partnership to develop autonomous underwater vehicles.
- March 2020: BAE Systems showcased a new anti-submarine warfare system.
(Further detailed developments can be included here)
Strategic Naval Combat Weapons Market Forecast
The Naval Combat Weapons market is poised for sustained growth over the forecast period (2025-2033), driven by ongoing geopolitical uncertainties, investments in naval modernization, and the continuous development of cutting-edge technologies. The increasing adoption of autonomous systems and the integration of AI will redefine naval combat capabilities, creating significant opportunities for market participants. The potential for market expansion is substantial, particularly in emerging markets with increasing defense budgets and a need for advanced naval weaponry.
Naval Combat Weapons Market Segmentation
- 1. Production Analysis
- 2. Consumption Analysis
- 3. Import Market Analysis (Value & Volume)
- 4. Export Market Analysis (Value & Volume)
- 5. Price Trend Analysis
Naval Combat Weapons Market Segmentation By Geography
-
1. North America
- 1.1. United States
- 1.2. Canada
- 1.3. Mexico
-
2. South America
- 2.1. Brazil
- 2.2. Argentina
- 2.3. Rest of South America
-
3. Europe
- 3.1. United Kingdom
- 3.2. Germany
- 3.3. France
- 3.4. Italy
- 3.5. Spain
- 3.6. Russia
- 3.7. Benelux
- 3.8. Nordics
- 3.9. Rest of Europe
-
4. Middle East & Africa
- 4.1. Turkey
- 4.2. Israel
- 4.3. GCC
- 4.4. North Africa
- 4.5. South Africa
- 4.6. Rest of Middle East & Africa
-
5. Asia Pacific
- 5.1. China
- 5.2. India
- 5.3. Japan
- 5.4. South Korea
- 5.5. ASEAN
- 5.6. Oceania
- 5.7. Rest of Asia Pacific
Naval Combat Weapons Market REPORT HIGHLIGHTS
| Aspects | Details |
|---|---|
| Study Period | 2019-2033 |
| Base Year | 2024 |
| Estimated Year | 2025 |
| Forecast Period | 2025-2033 |
| Historical Period | 2019-2024 |
| Growth Rate | CAGR of 4.00% from 2019-2033 |
| Segmentation |
|
Table of Contents
- 1. Introduction
- 1.1. Research Scope
- 1.2. Market Segmentation
- 1.3. Research Methodology
- 1.4. Definitions and Assumptions
- 2. Executive Summary
- 2.1. Introduction
- 3. Market Dynamics
- 3.1. Introduction
- 3.2. Market Drivers
- 3.2.1. Increase in Internet of Things (IoT) and Autonomous Systems; Rise in Demand for Military and Defense Satellite Communication Solutions
- 3.3. Market Restrains
- 3.3.1. Cybersecurity Threats to Satellite Communication; Interference in Transmission of Data
- 3.4. Market Trends
- 3.4.1. Submarines Segment Will Showcase Significant Growth During the Forecast Period
- 4. Market Factor Analysis
- 4.1. Porters Five Forces
- 4.2. Supply/Value Chain
- 4.3. PESTEL analysis
- 4.4. Market Entropy
- 4.5. Patent/Trademark Analysis
- 5. Global Naval Combat Weapons Market Analysis, Insights and Forecast, 2019-2031
- 5.1. Market Analysis, Insights and Forecast - by Production Analysis
- 5.2. Market Analysis, Insights and Forecast - by Consumption Analysis
- 5.3. Market Analysis, Insights and Forecast - by Import Market Analysis (Value & Volume)
- 5.4. Market Analysis, Insights and Forecast - by Export Market Analysis (Value & Volume)
- 5.5. Market Analysis, Insights and Forecast - by Price Trend Analysis
- 5.6. Market Analysis, Insights and Forecast - by Region
- 5.6.1. North America
- 5.6.2. South America
- 5.6.3. Europe
- 5.6.4. Middle East & Africa
- 5.6.5. Asia Pacific
- 5.1. Market Analysis, Insights and Forecast - by Production Analysis
- 6. North America Naval Combat Weapons Market Analysis, Insights and Forecast, 2019-2031
- 6.1. Market Analysis, Insights and Forecast - by Production Analysis
- 6.2. Market Analysis, Insights and Forecast - by Consumption Analysis
- 6.3. Market Analysis, Insights and Forecast - by Import Market Analysis (Value & Volume)
- 6.4. Market Analysis, Insights and Forecast - by Export Market Analysis (Value & Volume)
- 6.5. Market Analysis, Insights and Forecast - by Price Trend Analysis
- 6.1. Market Analysis, Insights and Forecast - by Production Analysis
- 7. South America Naval Combat Weapons Market Analysis, Insights and Forecast, 2019-2031
- 7.1. Market Analysis, Insights and Forecast - by Production Analysis
- 7.2. Market Analysis, Insights and Forecast - by Consumption Analysis
- 7.3. Market Analysis, Insights and Forecast - by Import Market Analysis (Value & Volume)
- 7.4. Market Analysis, Insights and Forecast - by Export Market Analysis (Value & Volume)
- 7.5. Market Analysis, Insights and Forecast - by Price Trend Analysis
- 7.1. Market Analysis, Insights and Forecast - by Production Analysis
- 8. Europe Naval Combat Weapons Market Analysis, Insights and Forecast, 2019-2031
- 8.1. Market Analysis, Insights and Forecast - by Production Analysis
- 8.2. Market Analysis, Insights and Forecast - by Consumption Analysis
- 8.3. Market Analysis, Insights and Forecast - by Import Market Analysis (Value & Volume)
- 8.4. Market Analysis, Insights and Forecast - by Export Market Analysis (Value & Volume)
- 8.5. Market Analysis, Insights and Forecast - by Price Trend Analysis
- 8.1. Market Analysis, Insights and Forecast - by Production Analysis
- 9. Middle East & Africa Naval Combat Weapons Market Analysis, Insights and Forecast, 2019-2031
- 9.1. Market Analysis, Insights and Forecast - by Production Analysis
- 9.2. Market Analysis, Insights and Forecast - by Consumption Analysis
- 9.3. Market Analysis, Insights and Forecast - by Import Market Analysis (Value & Volume)
- 9.4. Market Analysis, Insights and Forecast - by Export Market Analysis (Value & Volume)
- 9.5. Market Analysis, Insights and Forecast - by Price Trend Analysis
- 9.1. Market Analysis, Insights and Forecast - by Production Analysis
- 10. Asia Pacific Naval Combat Weapons Market Analysis, Insights and Forecast, 2019-2031
- 10.1. Market Analysis, Insights and Forecast - by Production Analysis
- 10.2. Market Analysis, Insights and Forecast - by Consumption Analysis
- 10.3. Market Analysis, Insights and Forecast - by Import Market Analysis (Value & Volume)
- 10.4. Market Analysis, Insights and Forecast - by Export Market Analysis (Value & Volume)
- 10.5. Market Analysis, Insights and Forecast - by Price Trend Analysis
- 10.1. Market Analysis, Insights and Forecast - by Production Analysis
- 11. North America Naval Combat Weapons Market Analysis, Insights and Forecast, 2019-2031
- 11.1. Market Analysis, Insights and Forecast - By Country/Sub-region
- 11.1.1 United States
- 11.1.2 Canada
- 12. Europe Naval Combat Weapons Market Analysis, Insights and Forecast, 2019-2031
- 12.1. Market Analysis, Insights and Forecast - By Country/Sub-region
- 12.1.1 Germany
- 12.1.2 United Kingdom
- 12.1.3 France
- 12.1.4 Russia
- 12.1.5 Spain
- 12.1.6 Rest of Europe
- 13. Asia Pacific Naval Combat Weapons Market Analysis, Insights and Forecast, 2019-2031
- 13.1. Market Analysis, Insights and Forecast - By Country/Sub-region
- 13.1.1 India
- 13.1.2 China
- 13.1.3 Japan
- 13.1.4 Rest of Asia Pacific
- 14. Latin America Naval Combat Weapons Market Analysis, Insights and Forecast, 2019-2031
- 14.1. Market Analysis, Insights and Forecast - By Country/Sub-region
- 14.1.1 Brazil
- 14.1.2 Rest of Latin America
- 15. Middle East Naval Combat Weapons Market Analysis, Insights and Forecast, 2019-2031
- 15.1. Market Analysis, Insights and Forecast - By Country/Sub-region
- 15.1.1 United Arab Emirates
- 15.1.2 Saudi Arabia
- 15.1.3 South Africa
- 15.1.4 Rest of Middle East and Africa
- 16. Competitive Analysis
- 16.1. Global Market Share Analysis 2024
- 16.2. Company Profiles
- 16.2.1 General Dynamics Corporation
- 16.2.1.1. Overview
- 16.2.1.2. Products
- 16.2.1.3. SWOT Analysis
- 16.2.1.4. Recent Developments
- 16.2.1.5. Financials (Based on Availability)
- 16.2.2 Raytheon Corporation
- 16.2.2.1. Overview
- 16.2.2.2. Products
- 16.2.2.3. SWOT Analysis
- 16.2.2.4. Recent Developments
- 16.2.2.5. Financials (Based on Availability)
- 16.2.3 Leonardo SpA
- 16.2.3.1. Overview
- 16.2.3.2. Products
- 16.2.3.3. SWOT Analysis
- 16.2.3.4. Recent Developments
- 16.2.3.5. Financials (Based on Availability)
- 16.2.4 Kongsberg Gruppen
- 16.2.4.1. Overview
- 16.2.4.2. Products
- 16.2.4.3. SWOT Analysis
- 16.2.4.4. Recent Developments
- 16.2.4.5. Financials (Based on Availability)
- 16.2.5 Lockheed Martin Corporation
- 16.2.5.1. Overview
- 16.2.5.2. Products
- 16.2.5.3. SWOT Analysis
- 16.2.5.4. Recent Developments
- 16.2.5.5. Financials (Based on Availability)
- 16.2.6 Terma
- 16.2.6.1. Overview
- 16.2.6.2. Products
- 16.2.6.3. SWOT Analysis
- 16.2.6.4. Recent Developments
- 16.2.6.5. Financials (Based on Availability)
- 16.2.7 QinetiQ Grou
- 16.2.7.1. Overview
- 16.2.7.2. Products
- 16.2.7.3. SWOT Analysis
- 16.2.7.4. Recent Developments
- 16.2.7.5. Financials (Based on Availability)
- 16.2.8 Elbit Systems
- 16.2.8.1. Overview
- 16.2.8.2. Products
- 16.2.8.3. SWOT Analysis
- 16.2.8.4. Recent Developments
- 16.2.8.5. Financials (Based on Availability)
- 16.2.9 Thales Corporation
- 16.2.9.1. Overview
- 16.2.9.2. Products
- 16.2.9.3. SWOT Analysis
- 16.2.9.4. Recent Developments
- 16.2.9.5. Financials (Based on Availability)
- 16.2.10 L3 Harris Corporation
- 16.2.10.1. Overview
- 16.2.10.2. Products
- 16.2.10.3. SWOT Analysis
- 16.2.10.4. Recent Developments
- 16.2.10.5. Financials (Based on Availability)
- 16.2.11 BAE Systems Plc
- 16.2.11.1. Overview
- 16.2.11.2. Products
- 16.2.11.3. SWOT Analysis
- 16.2.11.4. Recent Developments
- 16.2.11.5. Financials (Based on Availability)
- 16.2.12 SAAB AB
- 16.2.12.1. Overview
- 16.2.12.2. Products
- 16.2.12.3. SWOT Analysis
- 16.2.12.4. Recent Developments
- 16.2.12.5. Financials (Based on Availability)
- 16.2.1 General Dynamics Corporation
List of Figures
- Figure 1: Global Naval Combat Weapons Market Revenue Breakdown (Million, %) by Region 2024 & 2032
- Figure 2: North America Naval Combat Weapons Market Revenue (Million), by Country 2024 & 2032
- Figure 3: North America Naval Combat Weapons Market Revenue Share (%), by Country 2024 & 2032
- Figure 4: Europe Naval Combat Weapons Market Revenue (Million), by Country 2024 & 2032
- Figure 5: Europe Naval Combat Weapons Market Revenue Share (%), by Country 2024 & 2032
- Figure 6: Asia Pacific Naval Combat Weapons Market Revenue (Million), by Country 2024 & 2032
- Figure 7: Asia Pacific Naval Combat Weapons Market Revenue Share (%), by Country 2024 & 2032
- Figure 8: Latin America Naval Combat Weapons Market Revenue (Million), by Country 2024 & 2032
- Figure 9: Latin America Naval Combat Weapons Market Revenue Share (%), by Country 2024 & 2032
- Figure 10: Middle East Naval Combat Weapons Market Revenue (Million), by Country 2024 & 2032
- Figure 11: Middle East Naval Combat Weapons Market Revenue Share (%), by Country 2024 & 2032
- Figure 12: North America Naval Combat Weapons Market Revenue (Million), by Production Analysis 2024 & 2032
- Figure 13: North America Naval Combat Weapons Market Revenue Share (%), by Production Analysis 2024 & 2032
- Figure 14: North America Naval Combat Weapons Market Revenue (Million), by Consumption Analysis 2024 & 2032
- Figure 15: North America Naval Combat Weapons Market Revenue Share (%), by Consumption Analysis 2024 & 2032
- Figure 16: North America Naval Combat Weapons Market Revenue (Million), by Import Market Analysis (Value & Volume) 2024 & 2032
- Figure 17: North America Naval Combat Weapons Market Revenue Share (%), by Import Market Analysis (Value & Volume) 2024 & 2032
- Figure 18: North America Naval Combat Weapons Market Revenue (Million), by Export Market Analysis (Value & Volume) 2024 & 2032
- Figure 19: North America Naval Combat Weapons Market Revenue Share (%), by Export Market Analysis (Value & Volume) 2024 & 2032
- Figure 20: North America Naval Combat Weapons Market Revenue (Million), by Price Trend Analysis 2024 & 2032
- Figure 21: North America Naval Combat Weapons Market Revenue Share (%), by Price Trend Analysis 2024 & 2032
- Figure 22: North America Naval Combat Weapons Market Revenue (Million), by Country 2024 & 2032
- Figure 23: North America Naval Combat Weapons Market Revenue Share (%), by Country 2024 & 2032
- Figure 24: South America Naval Combat Weapons Market Revenue (Million), by Production Analysis 2024 & 2032
- Figure 25: South America Naval Combat Weapons Market Revenue Share (%), by Production Analysis 2024 & 2032
- Figure 26: South America Naval Combat Weapons Market Revenue (Million), by Consumption Analysis 2024 & 2032
- Figure 27: South America Naval Combat Weapons Market Revenue Share (%), by Consumption Analysis 2024 & 2032
- Figure 28: South America Naval Combat Weapons Market Revenue (Million), by Import Market Analysis (Value & Volume) 2024 & 2032
- Figure 29: South America Naval Combat Weapons Market Revenue Share (%), by Import Market Analysis (Value & Volume) 2024 & 2032
- Figure 30: South America Naval Combat Weapons Market Revenue (Million), by Export Market Analysis (Value & Volume) 2024 & 2032
- Figure 31: South America Naval Combat Weapons Market Revenue Share (%), by Export Market Analysis (Value & Volume) 2024 & 2032
- Figure 32: South America Naval Combat Weapons Market Revenue (Million), by Price Trend Analysis 2024 & 2032
- Figure 33: South America Naval Combat Weapons Market Revenue Share (%), by Price Trend Analysis 2024 & 2032
- Figure 34: South America Naval Combat Weapons Market Revenue (Million), by Country 2024 & 2032
- Figure 35: South America Naval Combat Weapons Market Revenue Share (%), by Country 2024 & 2032
- Figure 36: Europe Naval Combat Weapons Market Revenue (Million), by Production Analysis 2024 & 2032
- Figure 37: Europe Naval Combat Weapons Market Revenue Share (%), by Production Analysis 2024 & 2032
- Figure 38: Europe Naval Combat Weapons Market Revenue (Million), by Consumption Analysis 2024 & 2032
- Figure 39: Europe Naval Combat Weapons Market Revenue Share (%), by Consumption Analysis 2024 & 2032
- Figure 40: Europe Naval Combat Weapons Market Revenue (Million), by Import Market Analysis (Value & Volume) 2024 & 2032
- Figure 41: Europe Naval Combat Weapons Market Revenue Share (%), by Import Market Analysis (Value & Volume) 2024 & 2032
- Figure 42: Europe Naval Combat Weapons Market Revenue (Million), by Export Market Analysis (Value & Volume) 2024 & 2032
- Figure 43: Europe Naval Combat Weapons Market Revenue Share (%), by Export Market Analysis (Value & Volume) 2024 & 2032
- Figure 44: Europe Naval Combat Weapons Market Revenue (Million), by Price Trend Analysis 2024 & 2032
- Figure 45: Europe Naval Combat Weapons Market Revenue Share (%), by Price Trend Analysis 2024 & 2032
- Figure 46: Europe Naval Combat Weapons Market Revenue (Million), by Country 2024 & 2032
- Figure 47: Europe Naval Combat Weapons Market Revenue Share (%), by Country 2024 & 2032
- Figure 48: Middle East & Africa Naval Combat Weapons Market Revenue (Million), by Production Analysis 2024 & 2032
- Figure 49: Middle East & Africa Naval Combat Weapons Market Revenue Share (%), by Production Analysis 2024 & 2032
- Figure 50: Middle East & Africa Naval Combat Weapons Market Revenue (Million), by Consumption Analysis 2024 & 2032
- Figure 51: Middle East & Africa Naval Combat Weapons Market Revenue Share (%), by Consumption Analysis 2024 & 2032
- Figure 52: Middle East & Africa Naval Combat Weapons Market Revenue (Million), by Import Market Analysis (Value & Volume) 2024 & 2032
- Figure 53: Middle East & Africa Naval Combat Weapons Market Revenue Share (%), by Import Market Analysis (Value & Volume) 2024 & 2032
- Figure 54: Middle East & Africa Naval Combat Weapons Market Revenue (Million), by Export Market Analysis (Value & Volume) 2024 & 2032
- Figure 55: Middle East & Africa Naval Combat Weapons Market Revenue Share (%), by Export Market Analysis (Value & Volume) 2024 & 2032
- Figure 56: Middle East & Africa Naval Combat Weapons Market Revenue (Million), by Price Trend Analysis 2024 & 2032
- Figure 57: Middle East & Africa Naval Combat Weapons Market Revenue Share (%), by Price Trend Analysis 2024 & 2032
- Figure 58: Middle East & Africa Naval Combat Weapons Market Revenue (Million), by Country 2024 & 2032
- Figure 59: Middle East & Africa Naval Combat Weapons Market Revenue Share (%), by Country 2024 & 2032
- Figure 60: Asia Pacific Naval Combat Weapons Market Revenue (Million), by Production Analysis 2024 & 2032
- Figure 61: Asia Pacific Naval Combat Weapons Market Revenue Share (%), by Production Analysis 2024 & 2032
- Figure 62: Asia Pacific Naval Combat Weapons Market Revenue (Million), by Consumption Analysis 2024 & 2032
- Figure 63: Asia Pacific Naval Combat Weapons Market Revenue Share (%), by Consumption Analysis 2024 & 2032
- Figure 64: Asia Pacific Naval Combat Weapons Market Revenue (Million), by Import Market Analysis (Value & Volume) 2024 & 2032
- Figure 65: Asia Pacific Naval Combat Weapons Market Revenue Share (%), by Import Market Analysis (Value & Volume) 2024 & 2032
- Figure 66: Asia Pacific Naval Combat Weapons Market Revenue (Million), by Export Market Analysis (Value & Volume) 2024 & 2032
- Figure 67: Asia Pacific Naval Combat Weapons Market Revenue Share (%), by Export Market Analysis (Value & Volume) 2024 & 2032
- Figure 68: Asia Pacific Naval Combat Weapons Market Revenue (Million), by Price Trend Analysis 2024 & 2032
- Figure 69: Asia Pacific Naval Combat Weapons Market Revenue Share (%), by Price Trend Analysis 2024 & 2032
- Figure 70: Asia Pacific Naval Combat Weapons Market Revenue (Million), by Country 2024 & 2032
- Figure 71: Asia Pacific Naval Combat Weapons Market Revenue Share (%), by Country 2024 & 2032
List of Tables
- Table 1: Global Naval Combat Weapons Market Revenue Million Forecast, by Region 2019 & 2032
- Table 2: Global Naval Combat Weapons Market Revenue Million Forecast, by Production Analysis 2019 & 2032
- Table 3: Global Naval Combat Weapons Market Revenue Million Forecast, by Consumption Analysis 2019 & 2032
- Table 4: Global Naval Combat Weapons Market Revenue Million Forecast, by Import Market Analysis (Value & Volume) 2019 & 2032
- Table 5: Global Naval Combat Weapons Market Revenue Million Forecast, by Export Market Analysis (Value & Volume) 2019 & 2032
- Table 6: Global Naval Combat Weapons Market Revenue Million Forecast, by Price Trend Analysis 2019 & 2032
- Table 7: Global Naval Combat Weapons Market Revenue Million Forecast, by Region 2019 & 2032
- Table 8: Global Naval Combat Weapons Market Revenue Million Forecast, by Country 2019 & 2032
- Table 9: United States Naval Combat Weapons Market Revenue (Million) Forecast, by Application 2019 & 2032
- Table 10: Canada Naval Combat Weapons Market Revenue (Million) Forecast, by Application 2019 & 2032
- Table 11: Global Naval Combat Weapons Market Revenue Million Forecast, by Country 2019 & 2032
- Table 12: Germany Naval Combat Weapons Market Revenue (Million) Forecast, by Application 2019 & 2032
- Table 13: United Kingdom Naval Combat Weapons Market Revenue (Million) Forecast, by Application 2019 & 2032
- Table 14: France Naval Combat Weapons Market Revenue (Million) Forecast, by Application 2019 & 2032
- Table 15: Russia Naval Combat Weapons Market Revenue (Million) Forecast, by Application 2019 & 2032
- Table 16: Spain Naval Combat Weapons Market Revenue (Million) Forecast, by Application 2019 & 2032
- Table 17: Rest of Europe Naval Combat Weapons Market Revenue (Million) Forecast, by Application 2019 & 2032
- Table 18: Global Naval Combat Weapons Market Revenue Million Forecast, by Country 2019 & 2032
- Table 19: India Naval Combat Weapons Market Revenue (Million) Forecast, by Application 2019 & 2032
- Table 20: China Naval Combat Weapons Market Revenue (Million) Forecast, by Application 2019 & 2032
- Table 21: Japan Naval Combat Weapons Market Revenue (Million) Forecast, by Application 2019 & 2032
- Table 22: Rest of Asia Pacific Naval Combat Weapons Market Revenue (Million) Forecast, by Application 2019 & 2032
- Table 23: Global Naval Combat Weapons Market Revenue Million Forecast, by Country 2019 & 2032
- Table 24: Brazil Naval Combat Weapons Market Revenue (Million) Forecast, by Application 2019 & 2032
- Table 25: Rest of Latin America Naval Combat Weapons Market Revenue (Million) Forecast, by Application 2019 & 2032
- Table 26: Global Naval Combat Weapons Market Revenue Million Forecast, by Country 2019 & 2032
- Table 27: United Arab Emirates Naval Combat Weapons Market Revenue (Million) Forecast, by Application 2019 & 2032
- Table 28: Saudi Arabia Naval Combat Weapons Market Revenue (Million) Forecast, by Application 2019 & 2032
- Table 29: South Africa Naval Combat Weapons Market Revenue (Million) Forecast, by Application 2019 & 2032
- Table 30: Rest of Middle East and Africa Naval Combat Weapons Market Revenue (Million) Forecast, by Application 2019 & 2032
- Table 31: Global Naval Combat Weapons Market Revenue Million Forecast, by Production Analysis 2019 & 2032
- Table 32: Global Naval Combat Weapons Market Revenue Million Forecast, by Consumption Analysis 2019 & 2032
- Table 33: Global Naval Combat Weapons Market Revenue Million Forecast, by Import Market Analysis (Value & Volume) 2019 & 2032
- Table 34: Global Naval Combat Weapons Market Revenue Million Forecast, by Export Market Analysis (Value & Volume) 2019 & 2032
- Table 35: Global Naval Combat Weapons Market Revenue Million Forecast, by Price Trend Analysis 2019 & 2032
- Table 36: Global Naval Combat Weapons Market Revenue Million Forecast, by Country 2019 & 2032
- Table 37: United States Naval Combat Weapons Market Revenue (Million) Forecast, by Application 2019 & 2032
- Table 38: Canada Naval Combat Weapons Market Revenue (Million) Forecast, by Application 2019 & 2032
- Table 39: Mexico Naval Combat Weapons Market Revenue (Million) Forecast, by Application 2019 & 2032
- Table 40: Global Naval Combat Weapons Market Revenue Million Forecast, by Production Analysis 2019 & 2032
- Table 41: Global Naval Combat Weapons Market Revenue Million Forecast, by Consumption Analysis 2019 & 2032
- Table 42: Global Naval Combat Weapons Market Revenue Million Forecast, by Import Market Analysis (Value & Volume) 2019 & 2032
- Table 43: Global Naval Combat Weapons Market Revenue Million Forecast, by Export Market Analysis (Value & Volume) 2019 & 2032
- Table 44: Global Naval Combat Weapons Market Revenue Million Forecast, by Price Trend Analysis 2019 & 2032
- Table 45: Global Naval Combat Weapons Market Revenue Million Forecast, by Country 2019 & 2032
- Table 46: Brazil Naval Combat Weapons Market Revenue (Million) Forecast, by Application 2019 & 2032
- Table 47: Argentina Naval Combat Weapons Market Revenue (Million) Forecast, by Application 2019 & 2032
- Table 48: Rest of South America Naval Combat Weapons Market Revenue (Million) Forecast, by Application 2019 & 2032
- Table 49: Global Naval Combat Weapons Market Revenue Million Forecast, by Production Analysis 2019 & 2032
- Table 50: Global Naval Combat Weapons Market Revenue Million Forecast, by Consumption Analysis 2019 & 2032
- Table 51: Global Naval Combat Weapons Market Revenue Million Forecast, by Import Market Analysis (Value & Volume) 2019 & 2032
- Table 52: Global Naval Combat Weapons Market Revenue Million Forecast, by Export Market Analysis (Value & Volume) 2019 & 2032
- Table 53: Global Naval Combat Weapons Market Revenue Million Forecast, by Price Trend Analysis 2019 & 2032
- Table 54: Global Naval Combat Weapons Market Revenue Million Forecast, by Country 2019 & 2032
- Table 55: United Kingdom Naval Combat Weapons Market Revenue (Million) Forecast, by Application 2019 & 2032
- Table 56: Germany Naval Combat Weapons Market Revenue (Million) Forecast, by Application 2019 & 2032
- Table 57: France Naval Combat Weapons Market Revenue (Million) Forecast, by Application 2019 & 2032
- Table 58: Italy Naval Combat Weapons Market Revenue (Million) Forecast, by Application 2019 & 2032
- Table 59: Spain Naval Combat Weapons Market Revenue (Million) Forecast, by Application 2019 & 2032
- Table 60: Russia Naval Combat Weapons Market Revenue (Million) Forecast, by Application 2019 & 2032
- Table 61: Benelux Naval Combat Weapons Market Revenue (Million) Forecast, by Application 2019 & 2032
- Table 62: Nordics Naval Combat Weapons Market Revenue (Million) Forecast, by Application 2019 & 2032
- Table 63: Rest of Europe Naval Combat Weapons Market Revenue (Million) Forecast, by Application 2019 & 2032
- Table 64: Global Naval Combat Weapons Market Revenue Million Forecast, by Production Analysis 2019 & 2032
- Table 65: Global Naval Combat Weapons Market Revenue Million Forecast, by Consumption Analysis 2019 & 2032
- Table 66: Global Naval Combat Weapons Market Revenue Million Forecast, by Import Market Analysis (Value & Volume) 2019 & 2032
- Table 67: Global Naval Combat Weapons Market Revenue Million Forecast, by Export Market Analysis (Value & Volume) 2019 & 2032
- Table 68: Global Naval Combat Weapons Market Revenue Million Forecast, by Price Trend Analysis 2019 & 2032
- Table 69: Global Naval Combat Weapons Market Revenue Million Forecast, by Country 2019 & 2032
- Table 70: Turkey Naval Combat Weapons Market Revenue (Million) Forecast, by Application 2019 & 2032
- Table 71: Israel Naval Combat Weapons Market Revenue (Million) Forecast, by Application 2019 & 2032
- Table 72: GCC Naval Combat Weapons Market Revenue (Million) Forecast, by Application 2019 & 2032
- Table 73: North Africa Naval Combat Weapons Market Revenue (Million) Forecast, by Application 2019 & 2032
- Table 74: South Africa Naval Combat Weapons Market Revenue (Million) Forecast, by Application 2019 & 2032
- Table 75: Rest of Middle East & Africa Naval Combat Weapons Market Revenue (Million) Forecast, by Application 2019 & 2032
- Table 76: Global Naval Combat Weapons Market Revenue Million Forecast, by Production Analysis 2019 & 2032
- Table 77: Global Naval Combat Weapons Market Revenue Million Forecast, by Consumption Analysis 2019 & 2032
- Table 78: Global Naval Combat Weapons Market Revenue Million Forecast, by Import Market Analysis (Value & Volume) 2019 & 2032
- Table 79: Global Naval Combat Weapons Market Revenue Million Forecast, by Export Market Analysis (Value & Volume) 2019 & 2032
- Table 80: Global Naval Combat Weapons Market Revenue Million Forecast, by Price Trend Analysis 2019 & 2032
- Table 81: Global Naval Combat Weapons Market Revenue Million Forecast, by Country 2019 & 2032
- Table 82: China Naval Combat Weapons Market Revenue (Million) Forecast, by Application 2019 & 2032
- Table 83: India Naval Combat Weapons Market Revenue (Million) Forecast, by Application 2019 & 2032
- Table 84: Japan Naval Combat Weapons Market Revenue (Million) Forecast, by Application 2019 & 2032
- Table 85: South Korea Naval Combat Weapons Market Revenue (Million) Forecast, by Application 2019 & 2032
- Table 86: ASEAN Naval Combat Weapons Market Revenue (Million) Forecast, by Application 2019 & 2032
- Table 87: Oceania Naval Combat Weapons Market Revenue (Million) Forecast, by Application 2019 & 2032
- Table 88: Rest of Asia Pacific Naval Combat Weapons Market Revenue (Million) Forecast, by Application 2019 & 2032
Frequently Asked Questions
1. What is the projected Compound Annual Growth Rate (CAGR) of the Naval Combat Weapons Market?
The projected CAGR is approximately 4.00%.
2. Which companies are prominent players in the Naval Combat Weapons Market?
Key companies in the market include General Dynamics Corporation, Raytheon Corporation, Leonardo SpA, Kongsberg Gruppen, Lockheed Martin Corporation, Terma, QinetiQ Grou, Elbit Systems, Thales Corporation, L3 Harris Corporation, BAE Systems Plc, SAAB AB.
3. What are the main segments of the Naval Combat Weapons Market?
The market segments include Production Analysis, Consumption Analysis, Import Market Analysis (Value & Volume), Export Market Analysis (Value & Volume), Price Trend Analysis.
4. Can you provide details about the market size?
The market size is estimated to be USD XX Million as of 2022.
5. What are some drivers contributing to market growth?
Increase in Internet of Things (IoT) and Autonomous Systems; Rise in Demand for Military and Defense Satellite Communication Solutions.
6. What are the notable trends driving market growth?
Submarines Segment Will Showcase Significant Growth During the Forecast Period.
7. Are there any restraints impacting market growth?
Cybersecurity Threats to Satellite Communication; Interference in Transmission of Data.
8. Can you provide examples of recent developments in the market?
N/A
9. What pricing options are available for accessing the report?
Pricing options include single-user, multi-user, and enterprise licenses priced at USD 4750, USD 5250, and USD 8750 respectively.
10. Is the market size provided in terms of value or volume?
The market size is provided in terms of value, measured in Million.
11. Are there any specific market keywords associated with the report?
Yes, the market keyword associated with the report is "Naval Combat Weapons Market," which aids in identifying and referencing the specific market segment covered.
12. How do I determine which pricing option suits my needs best?
The pricing options vary based on user requirements and access needs. Individual users may opt for single-user licenses, while businesses requiring broader access may choose multi-user or enterprise licenses for cost-effective access to the report.
13. Are there any additional resources or data provided in the Naval Combat Weapons Market report?
While the report offers comprehensive insights, it's advisable to review the specific contents or supplementary materials provided to ascertain if additional resources or data are available.
14. How can I stay updated on further developments or reports in the Naval Combat Weapons Market?
To stay informed about further developments, trends, and reports in the Naval Combat Weapons Market, consider subscribing to industry newsletters, following relevant companies and organizations, or regularly checking reputable industry news sources and publications.
Methodology
Step 1 - Identification of Relevant Samples Size from Population Database


Step 2 - Approaches for Defining Global Market Size (Value, Volume* & Price*)

Note*: In applicable scenarios
Step 3 - Data Sources
Primary Research
- Web Analytics
- Survey Reports
- Research Institute
- Latest Research Reports
- Opinion Leaders
Secondary Research
- Annual Reports
- White Paper
- Latest Press Release
- Industry Association
- Paid Database
- Investor Presentations

Step 4 - Data Triangulation
Involves using different sources of information in order to increase the validity of a study
These sources are likely to be stakeholders in a program - participants, other researchers, program staff, other community members, and so on.
Then we put all data in single framework & apply various statistical tools to find out the dynamic on the market.
During the analysis stage, feedback from the stakeholder groups would be compared to determine areas of agreement as well as areas of divergence
