

Key Insights
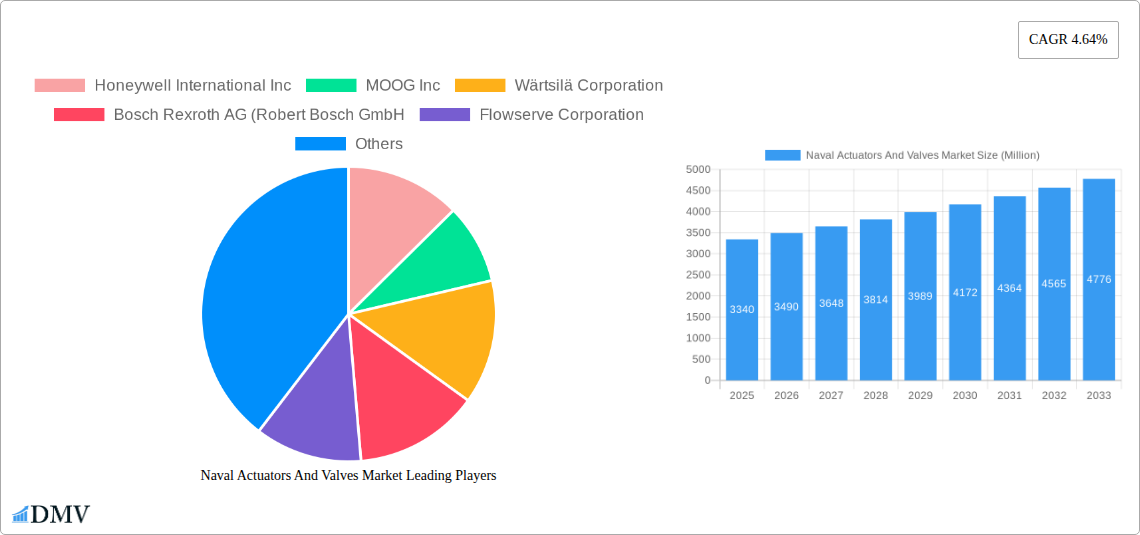
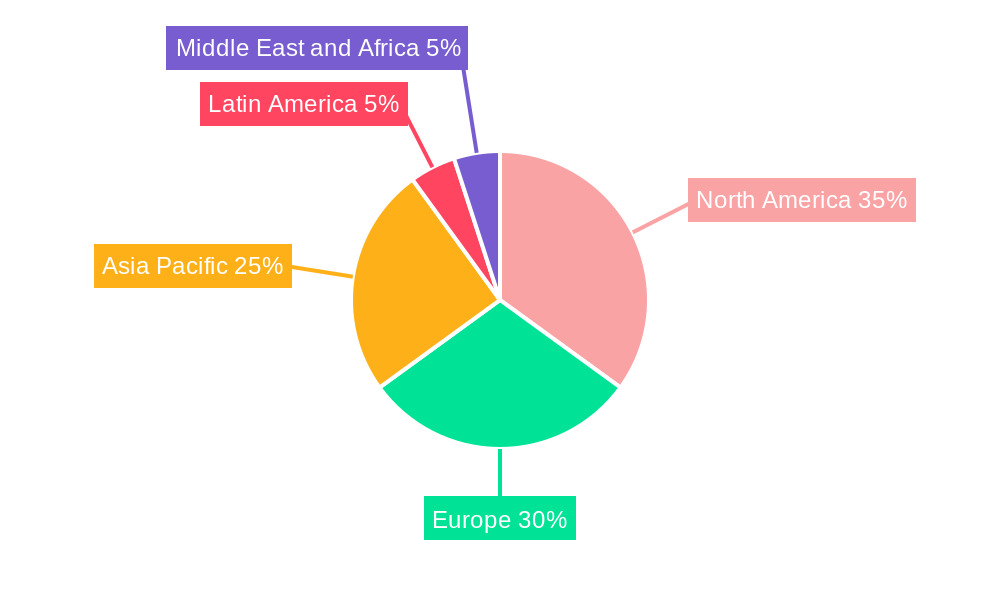
The Naval Actuators and Valves market, valued at $3.34 billion in 2025, is projected to experience robust growth, driven by increasing naval modernization programs globally and the rising demand for advanced automation systems in naval vessels. The market's Compound Annual Growth Rate (CAGR) of 4.64% from 2025 to 2033 indicates a steady expansion, fueled by technological advancements in actuator types (mechanical, hydraulic, pneumatic, electrical, and hybrid) and material composition (aluminum, stainless steel, and alloy-based). The integration of more sophisticated control systems and the increasing adoption of electric and hybrid actuators, offering improved efficiency and reduced maintenance, are key trends shaping market growth. However, factors such as stringent regulatory compliance requirements and the high initial investment costs associated with advanced actuator systems pose challenges to market expansion. The defense segment currently holds a significant market share, but the commercial segment, encompassing applications in offshore drilling and marine transportation, is projected to witness considerable growth owing to increased investments in maritime infrastructure and technological enhancements in these sectors. Geographical distribution reveals strong demand in North America and Europe, but the Asia-Pacific region is expected to exhibit the highest growth rate due to significant naval expansion and modernization initiatives in countries like India and China.
The competitive landscape is characterized by both established players like Honeywell International Inc., MOOG Inc., and Wärtsilä Corporation, and specialized niche players. These companies are focusing on strategic collaborations, technological innovations, and geographic expansion to maintain a strong competitive edge. The ongoing development of energy-efficient, compact, and reliable actuators, coupled with robust after-sales service support, will be critical factors in securing market leadership. Furthermore, the focus on developing systems that enhance operational efficiency, improve safety protocols, and reduce environmental impact will become increasingly important in shaping future market dynamics. The market will also see significant developments in the integration of advanced sensors and data analytics for predictive maintenance and improved system performance.
Dive Deep into the Naval Actuators and Valves Market: A Comprehensive Report (2019-2033)
This insightful report provides a detailed analysis of the global Naval Actuators and Valves Market, offering a comprehensive overview of market dynamics, growth drivers, and future opportunities from 2019 to 2033. The study covers key segments, leading players, and emerging trends, equipping stakeholders with the knowledge to make informed strategic decisions. The market is estimated to reach xx Million by 2025 and is projected to experience substantial growth during the forecast period (2025-2033).
Naval Actuators And Valves Market Market Composition & Trends
This section delves into the competitive landscape, analyzing market concentration, innovation drivers, regulatory frameworks, and substitute product impacts. We examine end-user preferences across defense and commercial sectors, detailing M&A activities and their influence on market share distribution. The report analyzes the market's evolution, noting key trends influencing its trajectory.
- Market Concentration: The market is moderately concentrated, with key players such as Honeywell International Inc, MOOG Inc, and Wärtsilä Corporation holding significant market shares. The report details the precise market share distribution for 2025 (Estimated Year) and projects it for 2033.
- Innovation Catalysts: Advancements in materials science (e.g., lighter, stronger alloys) and automation technologies (e.g., AI-driven control systems) are driving innovation.
- Regulatory Landscape: Stringent safety and environmental regulations impacting naval vessels are shaping product development and adoption.
- Substitute Products: The report analyzes the threat posed by alternative technologies and materials.
- End-User Profiles: Detailed analysis of defense and commercial naval sectors, their specific actuator and valve requirements, and purchasing behavior.
- M&A Activities: The report documents significant M&A deals in the sector during the study period (2019-2024), including deal values (in Millions) where available. XX Million in M&A activity was observed in 2024 alone.
Naval Actuators And Valves Market Industry Evolution
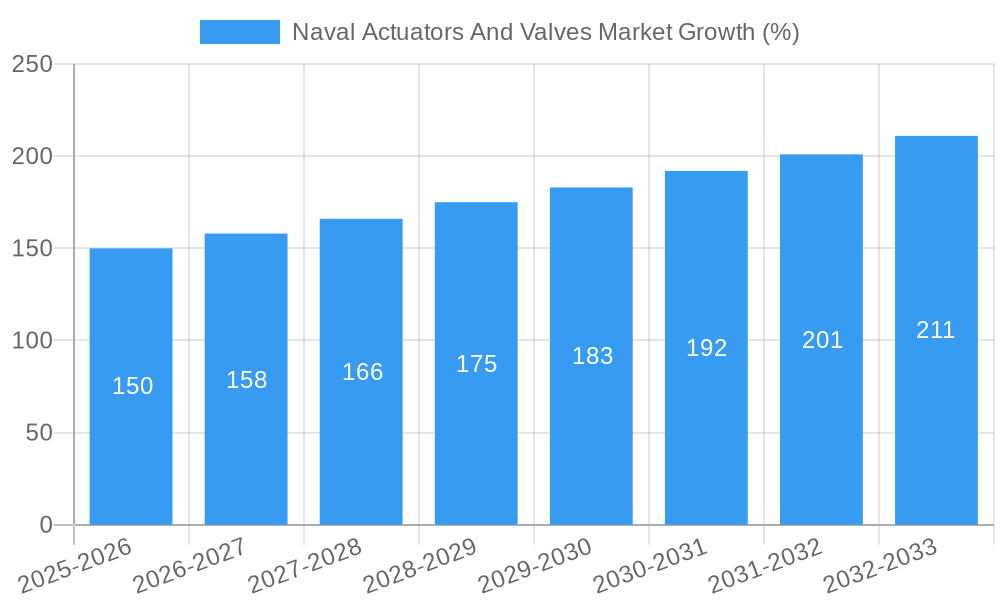
This section provides a comprehensive overview of the Naval Actuators and Valves Market's historical (2019-2024) and projected (2025-2033) growth trajectory. We explore technological advancements such as the integration of smart sensors and predictive maintenance capabilities. The analysis also highlights shifting consumer demands, focusing on the increasing need for enhanced reliability, efficiency, and durability in naval systems. Growth rates for various segments are provided, along with specific adoption metrics for new technologies. The market demonstrated a CAGR of xx% during the historical period and is anticipated to maintain a CAGR of xx% during the forecast period. Specific factors contributing to this growth – such as increasing defense spending and a growing global fleet – are extensively discussed.
Leading Regions, Countries, or Segments in Naval Actuators And Valves Market
This section identifies the dominant regions, countries, and market segments within the Naval Actuators and Valves Market. Key drivers for each are detailed, providing a granular understanding of market dynamics.
- Dominant Region/Country: [Insert Dominant Region/Country - e.g., North America/USA]. Reasons for dominance are detailed in the full report.
- Material Segmentation: A deep dive into the performance and market share of Aluminum, Stainless Steel, and Alloy-based materials.
- Actuator Type Segmentation: Analysis of Mechanical, Hydraulic, Pneumatic, Electrical, and Hybrid actuator types, including adoption rates and growth projections.
- Platform Segmentation: Detailed examination of the Defense and Commercial segments, assessing their respective growth trajectories and drivers.
Key Drivers (Examples):
- Increased investment in naval modernization programs.
- Government regulations mandating advanced safety features.
- Technological advancements leading to enhanced product performance and efficiency.
Naval Actuators And Valves Market Product Innovations
This section highlights recent product innovations, focusing on improved performance metrics (e.g., enhanced reliability, reduced energy consumption, increased lifespan) and unique selling propositions that provide competitive advantages in the market. The integration of advanced materials and technologies has led to the development of lighter, more efficient, and durable naval actuators and valves. Specific examples of innovative products and their key features are detailed in the report.
Propelling Factors for Naval Actuators And Valves Market Growth
Several factors contribute to the growth of the Naval Actuators and Valves Market, including:
- Technological advancements: The development of more efficient and reliable actuators and valves drives market expansion.
- Economic factors: Increased defense spending and shipbuilding activities boost market demand.
- Regulatory influences: Stringent safety and environmental regulations drive the adoption of advanced technologies.
Obstacles in the Naval Actuators And Valves Market Market
Despite the positive growth outlook, the market faces several challenges:
- Regulatory hurdles: Complex regulatory processes can delay product approvals and increase costs.
- Supply chain disruptions: Global supply chain issues can affect the availability of raw materials and components.
- Competitive pressures: Intense competition among established players and new entrants can impact pricing and profitability. The impact of these factors on market growth is quantified within the report.
Future Opportunities in Naval Actuators And Valves Market
Future opportunities include:
- Expansion into new markets: Growing demand in emerging economies presents significant opportunities.
- Development of advanced technologies: Integration of artificial intelligence and machine learning offers scope for innovation.
- Emerging consumer trends: The demand for sustainable and eco-friendly products presents opportunities for green technologies.
Major Players in the Naval Actuators And Valves Market Ecosystem
- Honeywell International Inc
- MOOG Inc
- Wärtsilä Corporation
- Bosch Rexroth AG (Robert Bosch GmbH)
- Flowserve Corporation
- Rotork PLC
- Diakont
- Emerson Electric Co
- Curtiss-Wright Corporation
- Schlumberger Limited
- IMI PLC
- AUMA Riester GmbH & Co KG
Key Developments in Naval Actuators And Valves Market Industry
- [Insert key developments with year/month, emphasizing impact – e.g., "June 2024: Honeywell launched its new line of smart valves, enhancing market competition."] Further detailed developments are included in the full report.
Strategic Naval Actuators And Valves Market Market Forecast
The Naval Actuators and Valves Market is poised for continued growth driven by technological advancements, increasing defense budgets, and stringent regulatory standards. The forecast period (2025-2033) promises substantial market expansion, particularly in the adoption of advanced technologies and expansion into new geographical markets. This report provides a robust framework for stakeholders to navigate the market effectively.
Naval Actuators And Valves Market Segmentation
- 1. Production Analysis
- 2. Consumption Analysis
- 3. Import Market Analysis (Value & Volume)
- 4. Export Market Analysis (Value & Volume)
- 5. Price Trend Analysis
Naval Actuators And Valves Market Segmentation By Geography
-
1. North America
- 1.1. United States
- 1.2. Canada
- 1.3. Mexico
-
2. South America
- 2.1. Brazil
- 2.2. Argentina
- 2.3. Rest of South America
-
3. Europe
- 3.1. United Kingdom
- 3.2. Germany
- 3.3. France
- 3.4. Italy
- 3.5. Spain
- 3.6. Russia
- 3.7. Benelux
- 3.8. Nordics
- 3.9. Rest of Europe
-
4. Middle East & Africa
- 4.1. Turkey
- 4.2. Israel
- 4.3. GCC
- 4.4. North Africa
- 4.5. South Africa
- 4.6. Rest of Middle East & Africa
-
5. Asia Pacific
- 5.1. China
- 5.2. India
- 5.3. Japan
- 5.4. South Korea
- 5.5. ASEAN
- 5.6. Oceania
- 5.7. Rest of Asia Pacific
Naval Actuators And Valves Market REPORT HIGHLIGHTS
| Aspects | Details |
|---|---|
| Study Period | 2019-2033 |
| Base Year | 2024 |
| Estimated Year | 2025 |
| Forecast Period | 2025-2033 |
| Historical Period | 2019-2024 |
| Growth Rate | CAGR of 4.64% from 2019-2033 |
| Segmentation |
|
Table of Contents
- 1. Introduction
- 1.1. Research Scope
- 1.2. Market Segmentation
- 1.3. Research Methodology
- 1.4. Definitions and Assumptions
- 2. Executive Summary
- 2.1. Introduction
- 3. Market Dynamics
- 3.1. Introduction
- 3.2. Market Drivers
- 3.2.1. Increase in Internet of Things (IoT) and Autonomous Systems; Rise in Demand for Military and Defense Satellite Communication Solutions
- 3.3. Market Restrains
- 3.3.1. Cybersecurity Threats to Satellite Communication; Interference in Transmission of Data
- 3.4. Market Trends
- 3.4.1. Defense Segment is Expected to Dominate the Market
- 4. Market Factor Analysis
- 4.1. Porters Five Forces
- 4.2. Supply/Value Chain
- 4.3. PESTEL analysis
- 4.4. Market Entropy
- 4.5. Patent/Trademark Analysis
- 5. Global Naval Actuators And Valves Market Analysis, Insights and Forecast, 2019-2031
- 5.1. Market Analysis, Insights and Forecast - by Production Analysis
- 5.2. Market Analysis, Insights and Forecast - by Consumption Analysis
- 5.3. Market Analysis, Insights and Forecast - by Import Market Analysis (Value & Volume)
- 5.4. Market Analysis, Insights and Forecast - by Export Market Analysis (Value & Volume)
- 5.5. Market Analysis, Insights and Forecast - by Price Trend Analysis
- 5.6. Market Analysis, Insights and Forecast - by Region
- 5.6.1. North America
- 5.6.2. South America
- 5.6.3. Europe
- 5.6.4. Middle East & Africa
- 5.6.5. Asia Pacific
- 5.1. Market Analysis, Insights and Forecast - by Production Analysis
- 6. North America Naval Actuators And Valves Market Analysis, Insights and Forecast, 2019-2031
- 6.1. Market Analysis, Insights and Forecast - by Production Analysis
- 6.2. Market Analysis, Insights and Forecast - by Consumption Analysis
- 6.3. Market Analysis, Insights and Forecast - by Import Market Analysis (Value & Volume)
- 6.4. Market Analysis, Insights and Forecast - by Export Market Analysis (Value & Volume)
- 6.5. Market Analysis, Insights and Forecast - by Price Trend Analysis
- 6.1. Market Analysis, Insights and Forecast - by Production Analysis
- 7. South America Naval Actuators And Valves Market Analysis, Insights and Forecast, 2019-2031
- 7.1. Market Analysis, Insights and Forecast - by Production Analysis
- 7.2. Market Analysis, Insights and Forecast - by Consumption Analysis
- 7.3. Market Analysis, Insights and Forecast - by Import Market Analysis (Value & Volume)
- 7.4. Market Analysis, Insights and Forecast - by Export Market Analysis (Value & Volume)
- 7.5. Market Analysis, Insights and Forecast - by Price Trend Analysis
- 7.1. Market Analysis, Insights and Forecast - by Production Analysis
- 8. Europe Naval Actuators And Valves Market Analysis, Insights and Forecast, 2019-2031
- 8.1. Market Analysis, Insights and Forecast - by Production Analysis
- 8.2. Market Analysis, Insights and Forecast - by Consumption Analysis
- 8.3. Market Analysis, Insights and Forecast - by Import Market Analysis (Value & Volume)
- 8.4. Market Analysis, Insights and Forecast - by Export Market Analysis (Value & Volume)
- 8.5. Market Analysis, Insights and Forecast - by Price Trend Analysis
- 8.1. Market Analysis, Insights and Forecast - by Production Analysis
- 9. Middle East & Africa Naval Actuators And Valves Market Analysis, Insights and Forecast, 2019-2031
- 9.1. Market Analysis, Insights and Forecast - by Production Analysis
- 9.2. Market Analysis, Insights and Forecast - by Consumption Analysis
- 9.3. Market Analysis, Insights and Forecast - by Import Market Analysis (Value & Volume)
- 9.4. Market Analysis, Insights and Forecast - by Export Market Analysis (Value & Volume)
- 9.5. Market Analysis, Insights and Forecast - by Price Trend Analysis
- 9.1. Market Analysis, Insights and Forecast - by Production Analysis
- 10. Asia Pacific Naval Actuators And Valves Market Analysis, Insights and Forecast, 2019-2031
- 10.1. Market Analysis, Insights and Forecast - by Production Analysis
- 10.2. Market Analysis, Insights and Forecast - by Consumption Analysis
- 10.3. Market Analysis, Insights and Forecast - by Import Market Analysis (Value & Volume)
- 10.4. Market Analysis, Insights and Forecast - by Export Market Analysis (Value & Volume)
- 10.5. Market Analysis, Insights and Forecast - by Price Trend Analysis
- 10.1. Market Analysis, Insights and Forecast - by Production Analysis
- 11. North America Naval Actuators And Valves Market Analysis, Insights and Forecast, 2019-2031
- 11.1. Market Analysis, Insights and Forecast - By Country/Sub-region
- 11.1.1 United States
- 11.1.2 Canada
- 12. Europe Naval Actuators And Valves Market Analysis, Insights and Forecast, 2019-2031
- 12.1. Market Analysis, Insights and Forecast - By Country/Sub-region
- 12.1.1 Germany
- 12.1.2 United Kingdom
- 12.1.3 France
- 12.1.4 Russia
- 12.1.5 Rest of Europe
- 13. Asia Pacific Naval Actuators And Valves Market Analysis, Insights and Forecast, 2019-2031
- 13.1. Market Analysis, Insights and Forecast - By Country/Sub-region
- 13.1.1 India
- 13.1.2 China
- 13.1.3 Japan
- 13.1.4 South Korea
- 13.1.5 Rest of Asia Pacific
- 14. Latin America Naval Actuators And Valves Market Analysis, Insights and Forecast, 2019-2031
- 14.1. Market Analysis, Insights and Forecast - By Country/Sub-region
- 14.1.1 Mexico
- 14.1.2 Brazil
- 14.1.3 Rest of Latin America
- 15. Middle East and Africa Naval Actuators And Valves Market Analysis, Insights and Forecast, 2019-2031
- 15.1. Market Analysis, Insights and Forecast - By Country/Sub-region
- 15.1.1 United Arab Emirates
- 15.1.2 Saudi Arabia
- 15.1.3 Egypt
- 15.1.4 Israel
- 15.1.5 Rest of Middle East and Africa
- 16. Competitive Analysis
- 16.1. Global Market Share Analysis 2024
- 16.2. Company Profiles
- 16.2.1 Honeywell International Inc
- 16.2.1.1. Overview
- 16.2.1.2. Products
- 16.2.1.3. SWOT Analysis
- 16.2.1.4. Recent Developments
- 16.2.1.5. Financials (Based on Availability)
- 16.2.2 MOOG Inc
- 16.2.2.1. Overview
- 16.2.2.2. Products
- 16.2.2.3. SWOT Analysis
- 16.2.2.4. Recent Developments
- 16.2.2.5. Financials (Based on Availability)
- 16.2.3 Wärtsilä Corporation
- 16.2.3.1. Overview
- 16.2.3.2. Products
- 16.2.3.3. SWOT Analysis
- 16.2.3.4. Recent Developments
- 16.2.3.5. Financials (Based on Availability)
- 16.2.4 Bosch Rexroth AG (Robert Bosch GmbH
- 16.2.4.1. Overview
- 16.2.4.2. Products
- 16.2.4.3. SWOT Analysis
- 16.2.4.4. Recent Developments
- 16.2.4.5. Financials (Based on Availability)
- 16.2.5 Flowserve Corporation
- 16.2.5.1. Overview
- 16.2.5.2. Products
- 16.2.5.3. SWOT Analysis
- 16.2.5.4. Recent Developments
- 16.2.5.5. Financials (Based on Availability)
- 16.2.6 Rotork PLC
- 16.2.6.1. Overview
- 16.2.6.2. Products
- 16.2.6.3. SWOT Analysis
- 16.2.6.4. Recent Developments
- 16.2.6.5. Financials (Based on Availability)
- 16.2.7 Diakont
- 16.2.7.1. Overview
- 16.2.7.2. Products
- 16.2.7.3. SWOT Analysis
- 16.2.7.4. Recent Developments
- 16.2.7.5. Financials (Based on Availability)
- 16.2.8 Emerson Electric Co
- 16.2.8.1. Overview
- 16.2.8.2. Products
- 16.2.8.3. SWOT Analysis
- 16.2.8.4. Recent Developments
- 16.2.8.5. Financials (Based on Availability)
- 16.2.9 Curtiss-Wright Corporation
- 16.2.9.1. Overview
- 16.2.9.2. Products
- 16.2.9.3. SWOT Analysis
- 16.2.9.4. Recent Developments
- 16.2.9.5. Financials (Based on Availability)
- 16.2.10 Schlumberger Limited
- 16.2.10.1. Overview
- 16.2.10.2. Products
- 16.2.10.3. SWOT Analysis
- 16.2.10.4. Recent Developments
- 16.2.10.5. Financials (Based on Availability)
- 16.2.11 IMI PLC
- 16.2.11.1. Overview
- 16.2.11.2. Products
- 16.2.11.3. SWOT Analysis
- 16.2.11.4. Recent Developments
- 16.2.11.5. Financials (Based on Availability)
- 16.2.12 AUMA Riester GmbH & Co KG
- 16.2.12.1. Overview
- 16.2.12.2. Products
- 16.2.12.3. SWOT Analysis
- 16.2.12.4. Recent Developments
- 16.2.12.5. Financials (Based on Availability)
- 16.2.1 Honeywell International Inc
List of Figures
- Figure 1: Global Naval Actuators And Valves Market Revenue Breakdown (Million, %) by Region 2024 & 2032
- Figure 2: North America Naval Actuators And Valves Market Revenue (Million), by Country 2024 & 2032
- Figure 3: North America Naval Actuators And Valves Market Revenue Share (%), by Country 2024 & 2032
- Figure 4: Europe Naval Actuators And Valves Market Revenue (Million), by Country 2024 & 2032
- Figure 5: Europe Naval Actuators And Valves Market Revenue Share (%), by Country 2024 & 2032
- Figure 6: Asia Pacific Naval Actuators And Valves Market Revenue (Million), by Country 2024 & 2032
- Figure 7: Asia Pacific Naval Actuators And Valves Market Revenue Share (%), by Country 2024 & 2032
- Figure 8: Latin America Naval Actuators And Valves Market Revenue (Million), by Country 2024 & 2032
- Figure 9: Latin America Naval Actuators And Valves Market Revenue Share (%), by Country 2024 & 2032
- Figure 10: Middle East and Africa Naval Actuators And Valves Market Revenue (Million), by Country 2024 & 2032
- Figure 11: Middle East and Africa Naval Actuators And Valves Market Revenue Share (%), by Country 2024 & 2032
- Figure 12: North America Naval Actuators And Valves Market Revenue (Million), by Production Analysis 2024 & 2032
- Figure 13: North America Naval Actuators And Valves Market Revenue Share (%), by Production Analysis 2024 & 2032
- Figure 14: North America Naval Actuators And Valves Market Revenue (Million), by Consumption Analysis 2024 & 2032
- Figure 15: North America Naval Actuators And Valves Market Revenue Share (%), by Consumption Analysis 2024 & 2032
- Figure 16: North America Naval Actuators And Valves Market Revenue (Million), by Import Market Analysis (Value & Volume) 2024 & 2032
- Figure 17: North America Naval Actuators And Valves Market Revenue Share (%), by Import Market Analysis (Value & Volume) 2024 & 2032
- Figure 18: North America Naval Actuators And Valves Market Revenue (Million), by Export Market Analysis (Value & Volume) 2024 & 2032
- Figure 19: North America Naval Actuators And Valves Market Revenue Share (%), by Export Market Analysis (Value & Volume) 2024 & 2032
- Figure 20: North America Naval Actuators And Valves Market Revenue (Million), by Price Trend Analysis 2024 & 2032
- Figure 21: North America Naval Actuators And Valves Market Revenue Share (%), by Price Trend Analysis 2024 & 2032
- Figure 22: North America Naval Actuators And Valves Market Revenue (Million), by Country 2024 & 2032
- Figure 23: North America Naval Actuators And Valves Market Revenue Share (%), by Country 2024 & 2032
- Figure 24: South America Naval Actuators And Valves Market Revenue (Million), by Production Analysis 2024 & 2032
- Figure 25: South America Naval Actuators And Valves Market Revenue Share (%), by Production Analysis 2024 & 2032
- Figure 26: South America Naval Actuators And Valves Market Revenue (Million), by Consumption Analysis 2024 & 2032
- Figure 27: South America Naval Actuators And Valves Market Revenue Share (%), by Consumption Analysis 2024 & 2032
- Figure 28: South America Naval Actuators And Valves Market Revenue (Million), by Import Market Analysis (Value & Volume) 2024 & 2032
- Figure 29: South America Naval Actuators And Valves Market Revenue Share (%), by Import Market Analysis (Value & Volume) 2024 & 2032
- Figure 30: South America Naval Actuators And Valves Market Revenue (Million), by Export Market Analysis (Value & Volume) 2024 & 2032
- Figure 31: South America Naval Actuators And Valves Market Revenue Share (%), by Export Market Analysis (Value & Volume) 2024 & 2032
- Figure 32: South America Naval Actuators And Valves Market Revenue (Million), by Price Trend Analysis 2024 & 2032
- Figure 33: South America Naval Actuators And Valves Market Revenue Share (%), by Price Trend Analysis 2024 & 2032
- Figure 34: South America Naval Actuators And Valves Market Revenue (Million), by Country 2024 & 2032
- Figure 35: South America Naval Actuators And Valves Market Revenue Share (%), by Country 2024 & 2032
- Figure 36: Europe Naval Actuators And Valves Market Revenue (Million), by Production Analysis 2024 & 2032
- Figure 37: Europe Naval Actuators And Valves Market Revenue Share (%), by Production Analysis 2024 & 2032
- Figure 38: Europe Naval Actuators And Valves Market Revenue (Million), by Consumption Analysis 2024 & 2032
- Figure 39: Europe Naval Actuators And Valves Market Revenue Share (%), by Consumption Analysis 2024 & 2032
- Figure 40: Europe Naval Actuators And Valves Market Revenue (Million), by Import Market Analysis (Value & Volume) 2024 & 2032
- Figure 41: Europe Naval Actuators And Valves Market Revenue Share (%), by Import Market Analysis (Value & Volume) 2024 & 2032
- Figure 42: Europe Naval Actuators And Valves Market Revenue (Million), by Export Market Analysis (Value & Volume) 2024 & 2032
- Figure 43: Europe Naval Actuators And Valves Market Revenue Share (%), by Export Market Analysis (Value & Volume) 2024 & 2032
- Figure 44: Europe Naval Actuators And Valves Market Revenue (Million), by Price Trend Analysis 2024 & 2032
- Figure 45: Europe Naval Actuators And Valves Market Revenue Share (%), by Price Trend Analysis 2024 & 2032
- Figure 46: Europe Naval Actuators And Valves Market Revenue (Million), by Country 2024 & 2032
- Figure 47: Europe Naval Actuators And Valves Market Revenue Share (%), by Country 2024 & 2032
- Figure 48: Middle East & Africa Naval Actuators And Valves Market Revenue (Million), by Production Analysis 2024 & 2032
- Figure 49: Middle East & Africa Naval Actuators And Valves Market Revenue Share (%), by Production Analysis 2024 & 2032
- Figure 50: Middle East & Africa Naval Actuators And Valves Market Revenue (Million), by Consumption Analysis 2024 & 2032
- Figure 51: Middle East & Africa Naval Actuators And Valves Market Revenue Share (%), by Consumption Analysis 2024 & 2032
- Figure 52: Middle East & Africa Naval Actuators And Valves Market Revenue (Million), by Import Market Analysis (Value & Volume) 2024 & 2032
- Figure 53: Middle East & Africa Naval Actuators And Valves Market Revenue Share (%), by Import Market Analysis (Value & Volume) 2024 & 2032
- Figure 54: Middle East & Africa Naval Actuators And Valves Market Revenue (Million), by Export Market Analysis (Value & Volume) 2024 & 2032
- Figure 55: Middle East & Africa Naval Actuators And Valves Market Revenue Share (%), by Export Market Analysis (Value & Volume) 2024 & 2032
- Figure 56: Middle East & Africa Naval Actuators And Valves Market Revenue (Million), by Price Trend Analysis 2024 & 2032
- Figure 57: Middle East & Africa Naval Actuators And Valves Market Revenue Share (%), by Price Trend Analysis 2024 & 2032
- Figure 58: Middle East & Africa Naval Actuators And Valves Market Revenue (Million), by Country 2024 & 2032
- Figure 59: Middle East & Africa Naval Actuators And Valves Market Revenue Share (%), by Country 2024 & 2032
- Figure 60: Asia Pacific Naval Actuators And Valves Market Revenue (Million), by Production Analysis 2024 & 2032
- Figure 61: Asia Pacific Naval Actuators And Valves Market Revenue Share (%), by Production Analysis 2024 & 2032
- Figure 62: Asia Pacific Naval Actuators And Valves Market Revenue (Million), by Consumption Analysis 2024 & 2032
- Figure 63: Asia Pacific Naval Actuators And Valves Market Revenue Share (%), by Consumption Analysis 2024 & 2032
- Figure 64: Asia Pacific Naval Actuators And Valves Market Revenue (Million), by Import Market Analysis (Value & Volume) 2024 & 2032
- Figure 65: Asia Pacific Naval Actuators And Valves Market Revenue Share (%), by Import Market Analysis (Value & Volume) 2024 & 2032
- Figure 66: Asia Pacific Naval Actuators And Valves Market Revenue (Million), by Export Market Analysis (Value & Volume) 2024 & 2032
- Figure 67: Asia Pacific Naval Actuators And Valves Market Revenue Share (%), by Export Market Analysis (Value & Volume) 2024 & 2032
- Figure 68: Asia Pacific Naval Actuators And Valves Market Revenue (Million), by Price Trend Analysis 2024 & 2032
- Figure 69: Asia Pacific Naval Actuators And Valves Market Revenue Share (%), by Price Trend Analysis 2024 & 2032
- Figure 70: Asia Pacific Naval Actuators And Valves Market Revenue (Million), by Country 2024 & 2032
- Figure 71: Asia Pacific Naval Actuators And Valves Market Revenue Share (%), by Country 2024 & 2032
List of Tables
- Table 1: Global Naval Actuators And Valves Market Revenue Million Forecast, by Region 2019 & 2032
- Table 2: Global Naval Actuators And Valves Market Revenue Million Forecast, by Production Analysis 2019 & 2032
- Table 3: Global Naval Actuators And Valves Market Revenue Million Forecast, by Consumption Analysis 2019 & 2032
- Table 4: Global Naval Actuators And Valves Market Revenue Million Forecast, by Import Market Analysis (Value & Volume) 2019 & 2032
- Table 5: Global Naval Actuators And Valves Market Revenue Million Forecast, by Export Market Analysis (Value & Volume) 2019 & 2032
- Table 6: Global Naval Actuators And Valves Market Revenue Million Forecast, by Price Trend Analysis 2019 & 2032
- Table 7: Global Naval Actuators And Valves Market Revenue Million Forecast, by Region 2019 & 2032
- Table 8: Global Naval Actuators And Valves Market Revenue Million Forecast, by Country 2019 & 2032
- Table 9: United States Naval Actuators And Valves Market Revenue (Million) Forecast, by Application 2019 & 2032
- Table 10: Canada Naval Actuators And Valves Market Revenue (Million) Forecast, by Application 2019 & 2032
- Table 11: Global Naval Actuators And Valves Market Revenue Million Forecast, by Country 2019 & 2032
- Table 12: Germany Naval Actuators And Valves Market Revenue (Million) Forecast, by Application 2019 & 2032
- Table 13: United Kingdom Naval Actuators And Valves Market Revenue (Million) Forecast, by Application 2019 & 2032
- Table 14: France Naval Actuators And Valves Market Revenue (Million) Forecast, by Application 2019 & 2032
- Table 15: Russia Naval Actuators And Valves Market Revenue (Million) Forecast, by Application 2019 & 2032
- Table 16: Rest of Europe Naval Actuators And Valves Market Revenue (Million) Forecast, by Application 2019 & 2032
- Table 17: Global Naval Actuators And Valves Market Revenue Million Forecast, by Country 2019 & 2032
- Table 18: India Naval Actuators And Valves Market Revenue (Million) Forecast, by Application 2019 & 2032
- Table 19: China Naval Actuators And Valves Market Revenue (Million) Forecast, by Application 2019 & 2032
- Table 20: Japan Naval Actuators And Valves Market Revenue (Million) Forecast, by Application 2019 & 2032
- Table 21: South Korea Naval Actuators And Valves Market Revenue (Million) Forecast, by Application 2019 & 2032
- Table 22: Rest of Asia Pacific Naval Actuators And Valves Market Revenue (Million) Forecast, by Application 2019 & 2032
- Table 23: Global Naval Actuators And Valves Market Revenue Million Forecast, by Country 2019 & 2032
- Table 24: Mexico Naval Actuators And Valves Market Revenue (Million) Forecast, by Application 2019 & 2032
- Table 25: Brazil Naval Actuators And Valves Market Revenue (Million) Forecast, by Application 2019 & 2032
- Table 26: Rest of Latin America Naval Actuators And Valves Market Revenue (Million) Forecast, by Application 2019 & 2032
- Table 27: Global Naval Actuators And Valves Market Revenue Million Forecast, by Country 2019 & 2032
- Table 28: United Arab Emirates Naval Actuators And Valves Market Revenue (Million) Forecast, by Application 2019 & 2032
- Table 29: Saudi Arabia Naval Actuators And Valves Market Revenue (Million) Forecast, by Application 2019 & 2032
- Table 30: Egypt Naval Actuators And Valves Market Revenue (Million) Forecast, by Application 2019 & 2032
- Table 31: Israel Naval Actuators And Valves Market Revenue (Million) Forecast, by Application 2019 & 2032
- Table 32: Rest of Middle East and Africa Naval Actuators And Valves Market Revenue (Million) Forecast, by Application 2019 & 2032
- Table 33: Global Naval Actuators And Valves Market Revenue Million Forecast, by Production Analysis 2019 & 2032
- Table 34: Global Naval Actuators And Valves Market Revenue Million Forecast, by Consumption Analysis 2019 & 2032
- Table 35: Global Naval Actuators And Valves Market Revenue Million Forecast, by Import Market Analysis (Value & Volume) 2019 & 2032
- Table 36: Global Naval Actuators And Valves Market Revenue Million Forecast, by Export Market Analysis (Value & Volume) 2019 & 2032
- Table 37: Global Naval Actuators And Valves Market Revenue Million Forecast, by Price Trend Analysis 2019 & 2032
- Table 38: Global Naval Actuators And Valves Market Revenue Million Forecast, by Country 2019 & 2032
- Table 39: United States Naval Actuators And Valves Market Revenue (Million) Forecast, by Application 2019 & 2032
- Table 40: Canada Naval Actuators And Valves Market Revenue (Million) Forecast, by Application 2019 & 2032
- Table 41: Mexico Naval Actuators And Valves Market Revenue (Million) Forecast, by Application 2019 & 2032
- Table 42: Global Naval Actuators And Valves Market Revenue Million Forecast, by Production Analysis 2019 & 2032
- Table 43: Global Naval Actuators And Valves Market Revenue Million Forecast, by Consumption Analysis 2019 & 2032
- Table 44: Global Naval Actuators And Valves Market Revenue Million Forecast, by Import Market Analysis (Value & Volume) 2019 & 2032
- Table 45: Global Naval Actuators And Valves Market Revenue Million Forecast, by Export Market Analysis (Value & Volume) 2019 & 2032
- Table 46: Global Naval Actuators And Valves Market Revenue Million Forecast, by Price Trend Analysis 2019 & 2032
- Table 47: Global Naval Actuators And Valves Market Revenue Million Forecast, by Country 2019 & 2032
- Table 48: Brazil Naval Actuators And Valves Market Revenue (Million) Forecast, by Application 2019 & 2032
- Table 49: Argentina Naval Actuators And Valves Market Revenue (Million) Forecast, by Application 2019 & 2032
- Table 50: Rest of South America Naval Actuators And Valves Market Revenue (Million) Forecast, by Application 2019 & 2032
- Table 51: Global Naval Actuators And Valves Market Revenue Million Forecast, by Production Analysis 2019 & 2032
- Table 52: Global Naval Actuators And Valves Market Revenue Million Forecast, by Consumption Analysis 2019 & 2032
- Table 53: Global Naval Actuators And Valves Market Revenue Million Forecast, by Import Market Analysis (Value & Volume) 2019 & 2032
- Table 54: Global Naval Actuators And Valves Market Revenue Million Forecast, by Export Market Analysis (Value & Volume) 2019 & 2032
- Table 55: Global Naval Actuators And Valves Market Revenue Million Forecast, by Price Trend Analysis 2019 & 2032
- Table 56: Global Naval Actuators And Valves Market Revenue Million Forecast, by Country 2019 & 2032
- Table 57: United Kingdom Naval Actuators And Valves Market Revenue (Million) Forecast, by Application 2019 & 2032
- Table 58: Germany Naval Actuators And Valves Market Revenue (Million) Forecast, by Application 2019 & 2032
- Table 59: France Naval Actuators And Valves Market Revenue (Million) Forecast, by Application 2019 & 2032
- Table 60: Italy Naval Actuators And Valves Market Revenue (Million) Forecast, by Application 2019 & 2032
- Table 61: Spain Naval Actuators And Valves Market Revenue (Million) Forecast, by Application 2019 & 2032
- Table 62: Russia Naval Actuators And Valves Market Revenue (Million) Forecast, by Application 2019 & 2032
- Table 63: Benelux Naval Actuators And Valves Market Revenue (Million) Forecast, by Application 2019 & 2032
- Table 64: Nordics Naval Actuators And Valves Market Revenue (Million) Forecast, by Application 2019 & 2032
- Table 65: Rest of Europe Naval Actuators And Valves Market Revenue (Million) Forecast, by Application 2019 & 2032
- Table 66: Global Naval Actuators And Valves Market Revenue Million Forecast, by Production Analysis 2019 & 2032
- Table 67: Global Naval Actuators And Valves Market Revenue Million Forecast, by Consumption Analysis 2019 & 2032
- Table 68: Global Naval Actuators And Valves Market Revenue Million Forecast, by Import Market Analysis (Value & Volume) 2019 & 2032
- Table 69: Global Naval Actuators And Valves Market Revenue Million Forecast, by Export Market Analysis (Value & Volume) 2019 & 2032
- Table 70: Global Naval Actuators And Valves Market Revenue Million Forecast, by Price Trend Analysis 2019 & 2032
- Table 71: Global Naval Actuators And Valves Market Revenue Million Forecast, by Country 2019 & 2032
- Table 72: Turkey Naval Actuators And Valves Market Revenue (Million) Forecast, by Application 2019 & 2032
- Table 73: Israel Naval Actuators And Valves Market Revenue (Million) Forecast, by Application 2019 & 2032
- Table 74: GCC Naval Actuators And Valves Market Revenue (Million) Forecast, by Application 2019 & 2032
- Table 75: North Africa Naval Actuators And Valves Market Revenue (Million) Forecast, by Application 2019 & 2032
- Table 76: South Africa Naval Actuators And Valves Market Revenue (Million) Forecast, by Application 2019 & 2032
- Table 77: Rest of Middle East & Africa Naval Actuators And Valves Market Revenue (Million) Forecast, by Application 2019 & 2032
- Table 78: Global Naval Actuators And Valves Market Revenue Million Forecast, by Production Analysis 2019 & 2032
- Table 79: Global Naval Actuators And Valves Market Revenue Million Forecast, by Consumption Analysis 2019 & 2032
- Table 80: Global Naval Actuators And Valves Market Revenue Million Forecast, by Import Market Analysis (Value & Volume) 2019 & 2032
- Table 81: Global Naval Actuators And Valves Market Revenue Million Forecast, by Export Market Analysis (Value & Volume) 2019 & 2032
- Table 82: Global Naval Actuators And Valves Market Revenue Million Forecast, by Price Trend Analysis 2019 & 2032
- Table 83: Global Naval Actuators And Valves Market Revenue Million Forecast, by Country 2019 & 2032
- Table 84: China Naval Actuators And Valves Market Revenue (Million) Forecast, by Application 2019 & 2032
- Table 85: India Naval Actuators And Valves Market Revenue (Million) Forecast, by Application 2019 & 2032
- Table 86: Japan Naval Actuators And Valves Market Revenue (Million) Forecast, by Application 2019 & 2032
- Table 87: South Korea Naval Actuators And Valves Market Revenue (Million) Forecast, by Application 2019 & 2032
- Table 88: ASEAN Naval Actuators And Valves Market Revenue (Million) Forecast, by Application 2019 & 2032
- Table 89: Oceania Naval Actuators And Valves Market Revenue (Million) Forecast, by Application 2019 & 2032
- Table 90: Rest of Asia Pacific Naval Actuators And Valves Market Revenue (Million) Forecast, by Application 2019 & 2032
Frequently Asked Questions
1. What is the projected Compound Annual Growth Rate (CAGR) of the Naval Actuators And Valves Market?
The projected CAGR is approximately 4.64%.
2. Which companies are prominent players in the Naval Actuators And Valves Market?
Key companies in the market include Honeywell International Inc, MOOG Inc, Wärtsilä Corporation, Bosch Rexroth AG (Robert Bosch GmbH, Flowserve Corporation, Rotork PLC, Diakont, Emerson Electric Co, Curtiss-Wright Corporation, Schlumberger Limited, IMI PLC, AUMA Riester GmbH & Co KG.
3. What are the main segments of the Naval Actuators And Valves Market?
The market segments include Production Analysis, Consumption Analysis, Import Market Analysis (Value & Volume), Export Market Analysis (Value & Volume), Price Trend Analysis.
4. Can you provide details about the market size?
The market size is estimated to be USD 3.34 Million as of 2022.
5. What are some drivers contributing to market growth?
Increase in Internet of Things (IoT) and Autonomous Systems; Rise in Demand for Military and Defense Satellite Communication Solutions.
6. What are the notable trends driving market growth?
Defense Segment is Expected to Dominate the Market.
7. Are there any restraints impacting market growth?
Cybersecurity Threats to Satellite Communication; Interference in Transmission of Data.
8. Can you provide examples of recent developments in the market?
N/A
9. What pricing options are available for accessing the report?
Pricing options include single-user, multi-user, and enterprise licenses priced at USD 4750, USD 5250, and USD 8750 respectively.
10. Is the market size provided in terms of value or volume?
The market size is provided in terms of value, measured in Million.
11. Are there any specific market keywords associated with the report?
Yes, the market keyword associated with the report is "Naval Actuators And Valves Market," which aids in identifying and referencing the specific market segment covered.
12. How do I determine which pricing option suits my needs best?
The pricing options vary based on user requirements and access needs. Individual users may opt for single-user licenses, while businesses requiring broader access may choose multi-user or enterprise licenses for cost-effective access to the report.
13. Are there any additional resources or data provided in the Naval Actuators And Valves Market report?
While the report offers comprehensive insights, it's advisable to review the specific contents or supplementary materials provided to ascertain if additional resources or data are available.
14. How can I stay updated on further developments or reports in the Naval Actuators And Valves Market?
To stay informed about further developments, trends, and reports in the Naval Actuators And Valves Market, consider subscribing to industry newsletters, following relevant companies and organizations, or regularly checking reputable industry news sources and publications.
Methodology
Step 1 - Identification of Relevant Samples Size from Population Database


Step 2 - Approaches for Defining Global Market Size (Value, Volume* & Price*)

Note*: In applicable scenarios
Step 3 - Data Sources
Primary Research
- Web Analytics
- Survey Reports
- Research Institute
- Latest Research Reports
- Opinion Leaders
Secondary Research
- Annual Reports
- White Paper
- Latest Press Release
- Industry Association
- Paid Database
- Investor Presentations

Step 4 - Data Triangulation
Involves using different sources of information in order to increase the validity of a study
These sources are likely to be stakeholders in a program - participants, other researchers, program staff, other community members, and so on.
Then we put all data in single framework & apply various statistical tools to find out the dynamic on the market.
During the analysis stage, feedback from the stakeholder groups would be compared to determine areas of agreement as well as areas of divergence
