

Key Insights
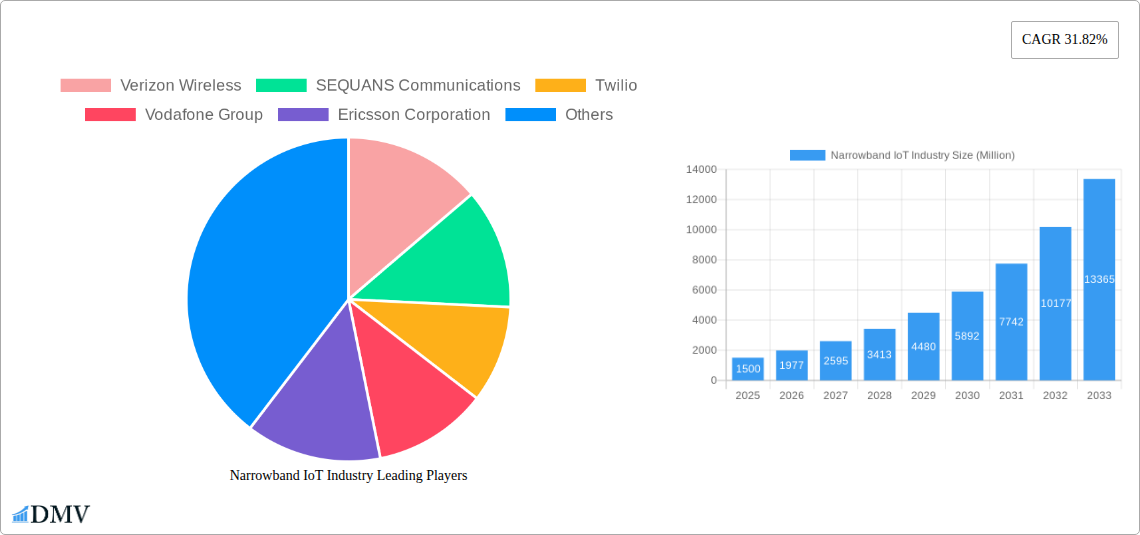
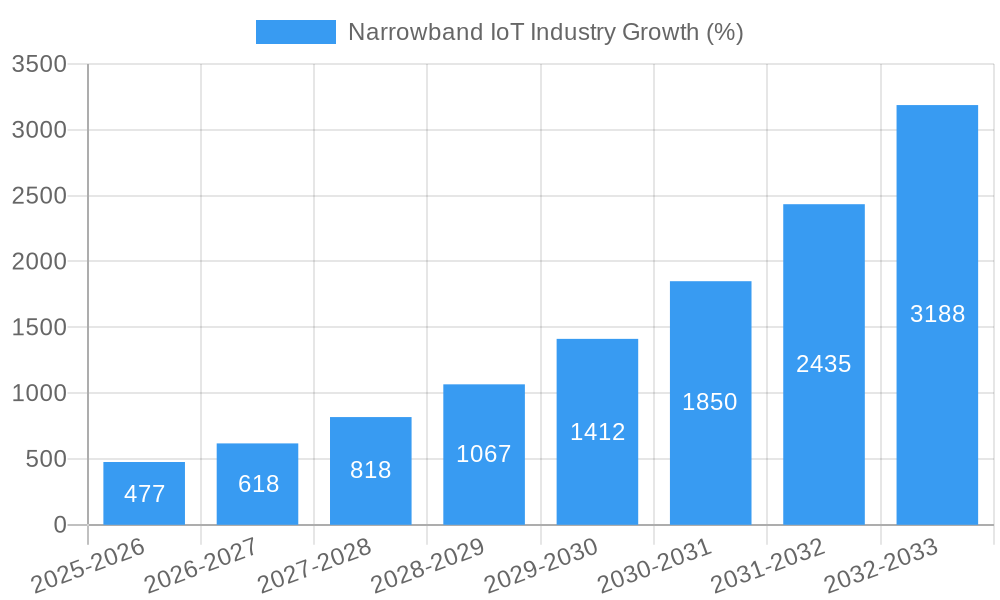
The Narrowband IoT (NB-IoT) market is experiencing robust growth, projected to reach a substantial size with a Compound Annual Growth Rate (CAGR) of 31.82% from 2025 to 2033. This expansion is driven by several key factors. The increasing adoption of smart city initiatives, coupled with the demand for efficient and cost-effective connectivity solutions in sectors like transportation and logistics, energy, retail, and agriculture, fuels market growth. The inherent strengths of NB-IoT, such as its low power consumption, wide area coverage, and ability to penetrate challenging environments, make it ideal for a diverse range of applications, including smart meters, wearables, and asset tracking. Furthermore, continuous advancements in technology and a growing ecosystem of supporting vendors are contributing to this expansive market trajectory. The deployment models, ranging from standalone to in-band and guard-band solutions, cater to various network infrastructure needs, fostering wider adoption.
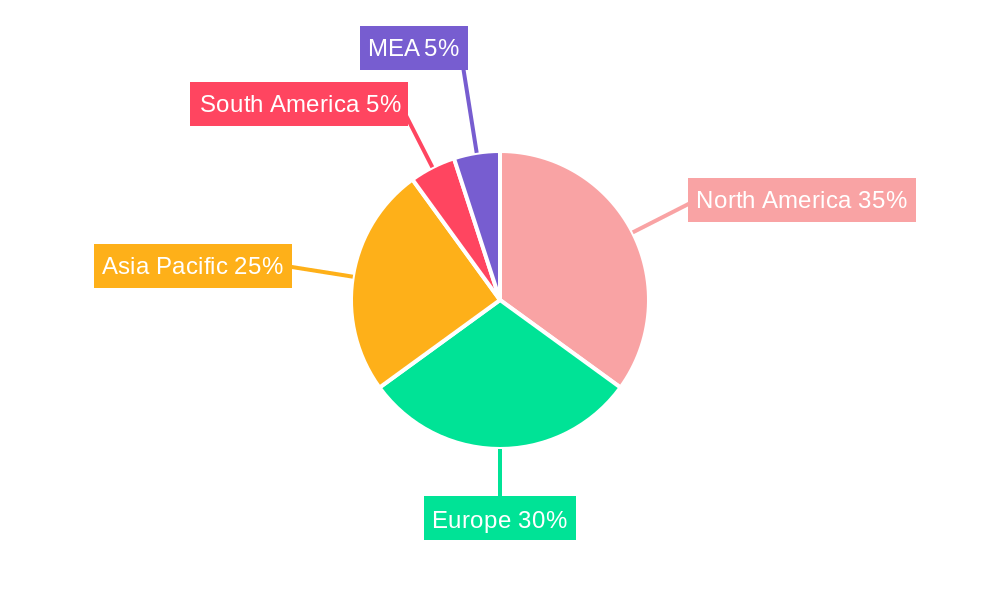
Despite the positive outlook, certain restraints influence market growth. High initial investment costs associated with infrastructure development and potential interoperability challenges between different NB-IoT networks remain hurdles. Nevertheless, ongoing technological improvements, declining device costs, and increasing government support for smart infrastructure projects are expected to mitigate these limitations. The market segmentation shows significant growth potential across components (network and modules), deployment models, and device types. The geographic distribution reveals strong growth in North America, Europe, and Asia-Pacific, driven by strong technological advancements and early adoption in key sectors. Leading players like Verizon Wireless, Qualcomm Technologies, Huawei, and Nokia are actively shaping the market landscape through their technological innovations and strategic partnerships, further solidifying the future of NB-IoT.
Narrowband IoT Industry Market Report: 2019-2033
This comprehensive report provides an in-depth analysis of the Narrowband IoT (NB-IoT) industry, offering invaluable insights for stakeholders seeking to navigate this rapidly evolving landscape. Covering the period from 2019 to 2033, with a focus on 2025, this report meticulously examines market composition, technological advancements, key players, and future growth trajectories. The market is projected to reach xx Million by 2033, representing significant growth opportunities.
Narrowband IoT Industry Market Composition & Trends
This section delves into the competitive dynamics of the NB-IoT market, analyzing market concentration, innovation drivers, regulatory frameworks, substitute technologies, and key end-user segments. We examine M&A activity, including deal values, to understand market consolidation trends.
- Market Concentration: The NB-IoT market exhibits a moderately concentrated structure, with key players like Verizon Wireless, SEQUANS Communications, Twilio, Vodafone Group, Ericsson Corporation, Qualcomm Technologies, Huawei Technologies Co Ltd, Nokia Corporation, AT&T Inc, Intel Corporation, and Deutsche Telekom holding significant market share. The exact distribution remains dynamic and subject to ongoing M&A activity. The combined market share of the top 5 players is estimated at xx%.
- Innovation Catalysts: The development of low-power wide-area networks (LPWAN) and advancements in chip technology are driving innovation.
- Regulatory Landscape: Government regulations concerning IoT security and data privacy are shaping industry practices.
- Substitute Products: Competing technologies, such as LoRaWAN, are impacting market share.
- End-User Profiles: Key end-user segments include Smart Cities, Transportation & Logistics, Energy & Utilities, Retail, and Agriculture.
- M&A Activities: Over the historical period (2019-2024), M&A deal values totaled approximately xx Million, reflecting strategic consolidation within the industry.
Narrowband IoT Industry Evolution
This section analyzes the historical and projected growth of the NB-IoT market, exploring technological advancements and shifts in consumer demand that have propelled market evolution. We project a Compound Annual Growth Rate (CAGR) of xx% from 2025 to 2033, driven by increased adoption across various sectors. The market size in 2025 is estimated to be xx Million and is anticipated to reach xx Million by 2033. This growth is fueled by several factors, including falling component costs, expanding network coverage, and the rising demand for connected devices in diverse sectors such as smart metering, asset tracking, and environmental monitoring. Technological advancements, such as the integration of NB-IoT with other technologies like satellite connectivity, further boost market expansion. The shift toward cloud-based solutions and improved data analytics capabilities also contribute to the market's evolution and wider acceptance. The increasing demand for remote monitoring and management solutions across various industries drives the need for robust and reliable connectivity solutions, which is further propelled by supportive government initiatives and regulatory frameworks promoting IoT adoption.
Leading Regions, Countries, or Segments in Narrowband IoT Industry
This section identifies the dominant regions, countries, and segments within the NB-IoT market.
Dominant Region: Asia-Pacific is projected to hold the largest market share, driven by significant investments in infrastructure and a high demand for connected devices across various sectors.
Key Drivers:
- High Investment in Infrastructure: Significant government and private investment in building NB-IoT networks.
- Strong Adoption Rates: Rapid adoption of NB-IoT technology across various industries.
- Supportive Regulatory Environment: Favorable regulatory frameworks promoting IoT adoption.
Component Segment: The Module segment is expected to dominate due to its ease of integration and cost-effectiveness.
Deployment Segment: Standalone deployment currently holds the largest share due to its scalability and flexibility.
Device Type Segment: Smart Meters and Trackers are the leading segments driven by the substantial growth in smart cities and logistics management.
Application Segment: Smart Cities currently accounts for the largest market share due to the numerous applications for NB-IoT in urban environments. Further detailed analysis within each segment reveals the specific drivers of their dominance, including market dynamics, technological advancements, and regulatory considerations.
Narrowband IoT Industry Product Innovations
Recent innovations include the development of more energy-efficient modules, improved integration capabilities with existing systems, and advancements in security protocols. These innovations enhance the performance, reliability, and security of NB-IoT networks, driving further adoption across various applications. The emergence of satellite NB-IoT connectivity expands the reach and application possibilities, particularly in remote areas. This represents a significant advancement, opening new markets and strengthening the technology's unique selling proposition.
Propelling Factors for Narrowband IoT Industry Growth
The NB-IoT industry’s growth is fueled by several key factors: the decreasing cost of NB-IoT modules, increasing demand for low-power wide-area network (LPWAN) solutions, growing investments in infrastructure development by telecommunications companies, and supportive government policies aimed at encouraging IoT adoption. The rising need for smart city solutions and the increasing adoption of NB-IoT in various sectors like agriculture, transportation, and healthcare significantly contribute to the industry’s expansion.
Obstacles in the Narrowband IoT Industry Market
Challenges include interoperability issues between different NB-IoT networks, security concerns related to data privacy, and the potential for supply chain disruptions impacting component availability. The competitive landscape, with numerous players vying for market share, also presents an ongoing challenge. These factors could potentially hinder market growth if not addressed effectively. These are estimated to have a xx% impact on market growth over the next few years.
Future Opportunities in Narrowband IoT Industry
Future opportunities lie in the expansion of NB-IoT networks into underserved regions, the integration of NB-IoT with other technologies like artificial intelligence (AI) and machine learning (ML) for enhanced data analytics, and the exploration of new applications in areas such as precision agriculture and industrial automation. The potential for NB-IoT in supporting the growth of the Internet of Things (IoT) in various sectors remains largely untapped.
Major Players in the Narrowband IoT Industry Ecosystem
- Verizon Wireless
- SEQUANS Communications
- Twilio
- Vodafone Group
- Ericsson Corporation
- Qualcomm Technologies
- Huawei Technologies Co Ltd
- Nokia Corporation
- SEQUANS Communications
- AT&T Inc
- Intel Corporation
- Deutsche Telekom
Key Developments in Narrowband IoT Industry Industry
- March 2023: Monogoto and Skylo Technologies announce a roaming agreement enabling economical NB-IoT satellite connectivity for asset monitoring. SODAQ unveils a new asset-tracking trial kit leveraging this partnership.
- January 2023: Airgain, Inc. partners with Deutsche Telekom IoT to connect asset tracking devices with Europe's leading IoT network, offering extended battery life (up to 14 years) and support for LTE-M and NB-IoT.
Strategic Narrowband IoT Industry Market Forecast
The NB-IoT market is poised for sustained growth, driven by ongoing technological advancements, expanding network coverage, and the increasing demand for connected devices across various sectors. The development of new applications and the integration with other technologies will unlock significant opportunities, further accelerating market expansion and creating new revenue streams for industry players. The projected growth rate, coupled with the emergence of new applications and the integration of NB-IoT with other technologies, makes this a particularly attractive market for investors and businesses alike.
Narrowband IoT Industry Segmentation
-
1. Component
- 1.1. Network
- 1.2. Module
-
2. Deployment
- 2.1. Standalone
- 2.2. In-band
- 2.3. Guard-band
-
3. Device Type
- 3.1. Wearables
- 3.2. Tracker
- 3.3. Smart Meter
- 3.4. Smart Lighting
- 3.5. Alarm & Detector
- 3.6. Others
-
4. Application
- 4.1. Smart Cities
- 4.2. Transportation & Logistics
- 4.3. Energy & Utilities
- 4.4. Retail
- 4.5. Agriculture
- 4.6. Others
Narrowband IoT Industry Segmentation By Geography
-
1. North America
- 1.1. United States
- 1.2. Canada
-
2. Europe
- 2.1. Germany
- 2.2. United Kingdom
- 2.3. France
-
3. Asia
- 3.1. India
- 3.2. China
- 3.3. Japan
- 4. Australia and New Zealand
-
5. Latin America
- 5.1. Brazil
- 5.2. Argentina
-
6. Middle East and Africa
- 6.1. United Arab Emirates
- 6.2. Saudi Arabia
Narrowband IoT Industry REPORT HIGHLIGHTS
| Aspects | Details |
|---|---|
| Study Period | 2019-2033 |
| Base Year | 2024 |
| Estimated Year | 2025 |
| Forecast Period | 2025-2033 |
| Historical Period | 2019-2024 |
| Growth Rate | CAGR of 31.82% from 2019-2033 |
| Segmentation |
|
Table of Contents
- 1. Introduction
- 1.1. Research Scope
- 1.2. Market Segmentation
- 1.3. Research Methodology
- 1.4. Definitions and Assumptions
- 2. Executive Summary
- 2.1. Introduction
- 3. Market Dynamics
- 3.1. Introduction
- 3.2. Market Drivers
- 3.2.1. Increasing Need of Cloud Storage; Increasing Cyberattacks Among Enterprises
- 3.3. Market Restrains
- 3.3.1. Increasing Network Complexity
- 3.4. Market Trends
- 3.4.1. Smart Cities is Expected to Drive the Market
- 4. Market Factor Analysis
- 4.1. Porters Five Forces
- 4.2. Supply/Value Chain
- 4.3. PESTEL analysis
- 4.4. Market Entropy
- 4.5. Patent/Trademark Analysis
- 5. Global Narrowband IoT Industry Analysis, Insights and Forecast, 2019-2031
- 5.1. Market Analysis, Insights and Forecast - by Component
- 5.1.1. Network
- 5.1.2. Module
- 5.2. Market Analysis, Insights and Forecast - by Deployment
- 5.2.1. Standalone
- 5.2.2. In-band
- 5.2.3. Guard-band
- 5.3. Market Analysis, Insights and Forecast - by Device Type
- 5.3.1. Wearables
- 5.3.2. Tracker
- 5.3.3. Smart Meter
- 5.3.4. Smart Lighting
- 5.3.5. Alarm & Detector
- 5.3.6. Others
- 5.4. Market Analysis, Insights and Forecast - by Application
- 5.4.1. Smart Cities
- 5.4.2. Transportation & Logistics
- 5.4.3. Energy & Utilities
- 5.4.4. Retail
- 5.4.5. Agriculture
- 5.4.6. Others
- 5.5. Market Analysis, Insights and Forecast - by Region
- 5.5.1. North America
- 5.5.2. Europe
- 5.5.3. Asia
- 5.5.4. Australia and New Zealand
- 5.5.5. Latin America
- 5.5.6. Middle East and Africa
- 5.1. Market Analysis, Insights and Forecast - by Component
- 6. North America Narrowband IoT Industry Analysis, Insights and Forecast, 2019-2031
- 6.1. Market Analysis, Insights and Forecast - by Component
- 6.1.1. Network
- 6.1.2. Module
- 6.2. Market Analysis, Insights and Forecast - by Deployment
- 6.2.1. Standalone
- 6.2.2. In-band
- 6.2.3. Guard-band
- 6.3. Market Analysis, Insights and Forecast - by Device Type
- 6.3.1. Wearables
- 6.3.2. Tracker
- 6.3.3. Smart Meter
- 6.3.4. Smart Lighting
- 6.3.5. Alarm & Detector
- 6.3.6. Others
- 6.4. Market Analysis, Insights and Forecast - by Application
- 6.4.1. Smart Cities
- 6.4.2. Transportation & Logistics
- 6.4.3. Energy & Utilities
- 6.4.4. Retail
- 6.4.5. Agriculture
- 6.4.6. Others
- 6.1. Market Analysis, Insights and Forecast - by Component
- 7. Europe Narrowband IoT Industry Analysis, Insights and Forecast, 2019-2031
- 7.1. Market Analysis, Insights and Forecast - by Component
- 7.1.1. Network
- 7.1.2. Module
- 7.2. Market Analysis, Insights and Forecast - by Deployment
- 7.2.1. Standalone
- 7.2.2. In-band
- 7.2.3. Guard-band
- 7.3. Market Analysis, Insights and Forecast - by Device Type
- 7.3.1. Wearables
- 7.3.2. Tracker
- 7.3.3. Smart Meter
- 7.3.4. Smart Lighting
- 7.3.5. Alarm & Detector
- 7.3.6. Others
- 7.4. Market Analysis, Insights and Forecast - by Application
- 7.4.1. Smart Cities
- 7.4.2. Transportation & Logistics
- 7.4.3. Energy & Utilities
- 7.4.4. Retail
- 7.4.5. Agriculture
- 7.4.6. Others
- 7.1. Market Analysis, Insights and Forecast - by Component
- 8. Asia Narrowband IoT Industry Analysis, Insights and Forecast, 2019-2031
- 8.1. Market Analysis, Insights and Forecast - by Component
- 8.1.1. Network
- 8.1.2. Module
- 8.2. Market Analysis, Insights and Forecast - by Deployment
- 8.2.1. Standalone
- 8.2.2. In-band
- 8.2.3. Guard-band
- 8.3. Market Analysis, Insights and Forecast - by Device Type
- 8.3.1. Wearables
- 8.3.2. Tracker
- 8.3.3. Smart Meter
- 8.3.4. Smart Lighting
- 8.3.5. Alarm & Detector
- 8.3.6. Others
- 8.4. Market Analysis, Insights and Forecast - by Application
- 8.4.1. Smart Cities
- 8.4.2. Transportation & Logistics
- 8.4.3. Energy & Utilities
- 8.4.4. Retail
- 8.4.5. Agriculture
- 8.4.6. Others
- 8.1. Market Analysis, Insights and Forecast - by Component
- 9. Australia and New Zealand Narrowband IoT Industry Analysis, Insights and Forecast, 2019-2031
- 9.1. Market Analysis, Insights and Forecast - by Component
- 9.1.1. Network
- 9.1.2. Module
- 9.2. Market Analysis, Insights and Forecast - by Deployment
- 9.2.1. Standalone
- 9.2.2. In-band
- 9.2.3. Guard-band
- 9.3. Market Analysis, Insights and Forecast - by Device Type
- 9.3.1. Wearables
- 9.3.2. Tracker
- 9.3.3. Smart Meter
- 9.3.4. Smart Lighting
- 9.3.5. Alarm & Detector
- 9.3.6. Others
- 9.4. Market Analysis, Insights and Forecast - by Application
- 9.4.1. Smart Cities
- 9.4.2. Transportation & Logistics
- 9.4.3. Energy & Utilities
- 9.4.4. Retail
- 9.4.5. Agriculture
- 9.4.6. Others
- 9.1. Market Analysis, Insights and Forecast - by Component
- 10. Latin America Narrowband IoT Industry Analysis, Insights and Forecast, 2019-2031
- 10.1. Market Analysis, Insights and Forecast - by Component
- 10.1.1. Network
- 10.1.2. Module
- 10.2. Market Analysis, Insights and Forecast - by Deployment
- 10.2.1. Standalone
- 10.2.2. In-band
- 10.2.3. Guard-band
- 10.3. Market Analysis, Insights and Forecast - by Device Type
- 10.3.1. Wearables
- 10.3.2. Tracker
- 10.3.3. Smart Meter
- 10.3.4. Smart Lighting
- 10.3.5. Alarm & Detector
- 10.3.6. Others
- 10.4. Market Analysis, Insights and Forecast - by Application
- 10.4.1. Smart Cities
- 10.4.2. Transportation & Logistics
- 10.4.3. Energy & Utilities
- 10.4.4. Retail
- 10.4.5. Agriculture
- 10.4.6. Others
- 10.1. Market Analysis, Insights and Forecast - by Component
- 11. Middle East and Africa Narrowband IoT Industry Analysis, Insights and Forecast, 2019-2031
- 11.1. Market Analysis, Insights and Forecast - by Component
- 11.1.1. Network
- 11.1.2. Module
- 11.2. Market Analysis, Insights and Forecast - by Deployment
- 11.2.1. Standalone
- 11.2.2. In-band
- 11.2.3. Guard-band
- 11.3. Market Analysis, Insights and Forecast - by Device Type
- 11.3.1. Wearables
- 11.3.2. Tracker
- 11.3.3. Smart Meter
- 11.3.4. Smart Lighting
- 11.3.5. Alarm & Detector
- 11.3.6. Others
- 11.4. Market Analysis, Insights and Forecast - by Application
- 11.4.1. Smart Cities
- 11.4.2. Transportation & Logistics
- 11.4.3. Energy & Utilities
- 11.4.4. Retail
- 11.4.5. Agriculture
- 11.4.6. Others
- 11.1. Market Analysis, Insights and Forecast - by Component
- 12. North America Narrowband IoT Industry Analysis, Insights and Forecast, 2019-2031
- 12.1. Market Analysis, Insights and Forecast - By Country/Sub-region
- 12.1.1 United States
- 12.1.2 Canada
- 12.1.3 Mexico
- 13. Europe Narrowband IoT Industry Analysis, Insights and Forecast, 2019-2031
- 13.1. Market Analysis, Insights and Forecast - By Country/Sub-region
- 13.1.1 Germany
- 13.1.2 United Kingdom
- 13.1.3 France
- 13.1.4 Spain
- 13.1.5 Italy
- 13.1.6 Spain
- 13.1.7 Belgium
- 13.1.8 Netherland
- 13.1.9 Nordics
- 13.1.10 Rest of Europe
- 14. Asia Pacific Narrowband IoT Industry Analysis, Insights and Forecast, 2019-2031
- 14.1. Market Analysis, Insights and Forecast - By Country/Sub-region
- 14.1.1 China
- 14.1.2 Japan
- 14.1.3 India
- 14.1.4 South Korea
- 14.1.5 Southeast Asia
- 14.1.6 Australia
- 14.1.7 Indonesia
- 14.1.8 Phillipes
- 14.1.9 Singapore
- 14.1.10 Thailandc
- 14.1.11 Rest of Asia Pacific
- 15. South America Narrowband IoT Industry Analysis, Insights and Forecast, 2019-2031
- 15.1. Market Analysis, Insights and Forecast - By Country/Sub-region
- 15.1.1 Brazil
- 15.1.2 Argentina
- 15.1.3 Peru
- 15.1.4 Chile
- 15.1.5 Colombia
- 15.1.6 Ecuador
- 15.1.7 Venezuela
- 15.1.8 Rest of South America
- 16. North America Narrowband IoT Industry Analysis, Insights and Forecast, 2019-2031
- 16.1. Market Analysis, Insights and Forecast - By Country/Sub-region
- 16.1.1 United States
- 16.1.2 Canada
- 16.1.3 Mexico
- 17. MEA Narrowband IoT Industry Analysis, Insights and Forecast, 2019-2031
- 17.1. Market Analysis, Insights and Forecast - By Country/Sub-region
- 17.1.1 United Arab Emirates
- 17.1.2 Saudi Arabia
- 17.1.3 South Africa
- 17.1.4 Rest of Middle East and Africa
- 18. Competitive Analysis
- 18.1. Global Market Share Analysis 2024
- 18.2. Company Profiles
- 18.2.1 Verizon Wireless
- 18.2.1.1. Overview
- 18.2.1.2. Products
- 18.2.1.3. SWOT Analysis
- 18.2.1.4. Recent Developments
- 18.2.1.5. Financials (Based on Availability)
- 18.2.2 SEQUANS Communications
- 18.2.2.1. Overview
- 18.2.2.2. Products
- 18.2.2.3. SWOT Analysis
- 18.2.2.4. Recent Developments
- 18.2.2.5. Financials (Based on Availability)
- 18.2.3 Twilio
- 18.2.3.1. Overview
- 18.2.3.2. Products
- 18.2.3.3. SWOT Analysis
- 18.2.3.4. Recent Developments
- 18.2.3.5. Financials (Based on Availability)
- 18.2.4 Vodafone Group
- 18.2.4.1. Overview
- 18.2.4.2. Products
- 18.2.4.3. SWOT Analysis
- 18.2.4.4. Recent Developments
- 18.2.4.5. Financials (Based on Availability)
- 18.2.5 Ericsson Corporation
- 18.2.5.1. Overview
- 18.2.5.2. Products
- 18.2.5.3. SWOT Analysis
- 18.2.5.4. Recent Developments
- 18.2.5.5. Financials (Based on Availability)
- 18.2.6 Qualcomm Technologies
- 18.2.6.1. Overview
- 18.2.6.2. Products
- 18.2.6.3. SWOT Analysis
- 18.2.6.4. Recent Developments
- 18.2.6.5. Financials (Based on Availability)
- 18.2.7 Huawei Technologies Co Ltd
- 18.2.7.1. Overview
- 18.2.7.2. Products
- 18.2.7.3. SWOT Analysis
- 18.2.7.4. Recent Developments
- 18.2.7.5. Financials (Based on Availability)
- 18.2.8 Nokia Corporation
- 18.2.8.1. Overview
- 18.2.8.2. Products
- 18.2.8.3. SWOT Analysis
- 18.2.8.4. Recent Developments
- 18.2.8.5. Financials (Based on Availability)
- 18.2.9 SEQUANS Communications*List Not Exhaustive
- 18.2.9.1. Overview
- 18.2.9.2. Products
- 18.2.9.3. SWOT Analysis
- 18.2.9.4. Recent Developments
- 18.2.9.5. Financials (Based on Availability)
- 18.2.10 AT&T Inc
- 18.2.10.1. Overview
- 18.2.10.2. Products
- 18.2.10.3. SWOT Analysis
- 18.2.10.4. Recent Developments
- 18.2.10.5. Financials (Based on Availability)
- 18.2.11 Intel Corporation
- 18.2.11.1. Overview
- 18.2.11.2. Products
- 18.2.11.3. SWOT Analysis
- 18.2.11.4. Recent Developments
- 18.2.11.5. Financials (Based on Availability)
- 18.2.12 Deutsche Telekom
- 18.2.12.1. Overview
- 18.2.12.2. Products
- 18.2.12.3. SWOT Analysis
- 18.2.12.4. Recent Developments
- 18.2.12.5. Financials (Based on Availability)
- 18.2.1 Verizon Wireless
List of Figures
- Figure 1: Global Narrowband IoT Industry Revenue Breakdown (Million, %) by Region 2024 & 2032
- Figure 2: North America Narrowband IoT Industry Revenue (Million), by Country 2024 & 2032
- Figure 3: North America Narrowband IoT Industry Revenue Share (%), by Country 2024 & 2032
- Figure 4: Europe Narrowband IoT Industry Revenue (Million), by Country 2024 & 2032
- Figure 5: Europe Narrowband IoT Industry Revenue Share (%), by Country 2024 & 2032
- Figure 6: Asia Pacific Narrowband IoT Industry Revenue (Million), by Country 2024 & 2032
- Figure 7: Asia Pacific Narrowband IoT Industry Revenue Share (%), by Country 2024 & 2032
- Figure 8: South America Narrowband IoT Industry Revenue (Million), by Country 2024 & 2032
- Figure 9: South America Narrowband IoT Industry Revenue Share (%), by Country 2024 & 2032
- Figure 10: North America Narrowband IoT Industry Revenue (Million), by Country 2024 & 2032
- Figure 11: North America Narrowband IoT Industry Revenue Share (%), by Country 2024 & 2032
- Figure 12: MEA Narrowband IoT Industry Revenue (Million), by Country 2024 & 2032
- Figure 13: MEA Narrowband IoT Industry Revenue Share (%), by Country 2024 & 2032
- Figure 14: North America Narrowband IoT Industry Revenue (Million), by Component 2024 & 2032
- Figure 15: North America Narrowband IoT Industry Revenue Share (%), by Component 2024 & 2032
- Figure 16: North America Narrowband IoT Industry Revenue (Million), by Deployment 2024 & 2032
- Figure 17: North America Narrowband IoT Industry Revenue Share (%), by Deployment 2024 & 2032
- Figure 18: North America Narrowband IoT Industry Revenue (Million), by Device Type 2024 & 2032
- Figure 19: North America Narrowband IoT Industry Revenue Share (%), by Device Type 2024 & 2032
- Figure 20: North America Narrowband IoT Industry Revenue (Million), by Application 2024 & 2032
- Figure 21: North America Narrowband IoT Industry Revenue Share (%), by Application 2024 & 2032
- Figure 22: North America Narrowband IoT Industry Revenue (Million), by Country 2024 & 2032
- Figure 23: North America Narrowband IoT Industry Revenue Share (%), by Country 2024 & 2032
- Figure 24: Europe Narrowband IoT Industry Revenue (Million), by Component 2024 & 2032
- Figure 25: Europe Narrowband IoT Industry Revenue Share (%), by Component 2024 & 2032
- Figure 26: Europe Narrowband IoT Industry Revenue (Million), by Deployment 2024 & 2032
- Figure 27: Europe Narrowband IoT Industry Revenue Share (%), by Deployment 2024 & 2032
- Figure 28: Europe Narrowband IoT Industry Revenue (Million), by Device Type 2024 & 2032
- Figure 29: Europe Narrowband IoT Industry Revenue Share (%), by Device Type 2024 & 2032
- Figure 30: Europe Narrowband IoT Industry Revenue (Million), by Application 2024 & 2032
- Figure 31: Europe Narrowband IoT Industry Revenue Share (%), by Application 2024 & 2032
- Figure 32: Europe Narrowband IoT Industry Revenue (Million), by Country 2024 & 2032
- Figure 33: Europe Narrowband IoT Industry Revenue Share (%), by Country 2024 & 2032
- Figure 34: Asia Narrowband IoT Industry Revenue (Million), by Component 2024 & 2032
- Figure 35: Asia Narrowband IoT Industry Revenue Share (%), by Component 2024 & 2032
- Figure 36: Asia Narrowband IoT Industry Revenue (Million), by Deployment 2024 & 2032
- Figure 37: Asia Narrowband IoT Industry Revenue Share (%), by Deployment 2024 & 2032
- Figure 38: Asia Narrowband IoT Industry Revenue (Million), by Device Type 2024 & 2032
- Figure 39: Asia Narrowband IoT Industry Revenue Share (%), by Device Type 2024 & 2032
- Figure 40: Asia Narrowband IoT Industry Revenue (Million), by Application 2024 & 2032
- Figure 41: Asia Narrowband IoT Industry Revenue Share (%), by Application 2024 & 2032
- Figure 42: Asia Narrowband IoT Industry Revenue (Million), by Country 2024 & 2032
- Figure 43: Asia Narrowband IoT Industry Revenue Share (%), by Country 2024 & 2032
- Figure 44: Australia and New Zealand Narrowband IoT Industry Revenue (Million), by Component 2024 & 2032
- Figure 45: Australia and New Zealand Narrowband IoT Industry Revenue Share (%), by Component 2024 & 2032
- Figure 46: Australia and New Zealand Narrowband IoT Industry Revenue (Million), by Deployment 2024 & 2032
- Figure 47: Australia and New Zealand Narrowband IoT Industry Revenue Share (%), by Deployment 2024 & 2032
- Figure 48: Australia and New Zealand Narrowband IoT Industry Revenue (Million), by Device Type 2024 & 2032
- Figure 49: Australia and New Zealand Narrowband IoT Industry Revenue Share (%), by Device Type 2024 & 2032
- Figure 50: Australia and New Zealand Narrowband IoT Industry Revenue (Million), by Application 2024 & 2032
- Figure 51: Australia and New Zealand Narrowband IoT Industry Revenue Share (%), by Application 2024 & 2032
- Figure 52: Australia and New Zealand Narrowband IoT Industry Revenue (Million), by Country 2024 & 2032
- Figure 53: Australia and New Zealand Narrowband IoT Industry Revenue Share (%), by Country 2024 & 2032
- Figure 54: Latin America Narrowband IoT Industry Revenue (Million), by Component 2024 & 2032
- Figure 55: Latin America Narrowband IoT Industry Revenue Share (%), by Component 2024 & 2032
- Figure 56: Latin America Narrowband IoT Industry Revenue (Million), by Deployment 2024 & 2032
- Figure 57: Latin America Narrowband IoT Industry Revenue Share (%), by Deployment 2024 & 2032
- Figure 58: Latin America Narrowband IoT Industry Revenue (Million), by Device Type 2024 & 2032
- Figure 59: Latin America Narrowband IoT Industry Revenue Share (%), by Device Type 2024 & 2032
- Figure 60: Latin America Narrowband IoT Industry Revenue (Million), by Application 2024 & 2032
- Figure 61: Latin America Narrowband IoT Industry Revenue Share (%), by Application 2024 & 2032
- Figure 62: Latin America Narrowband IoT Industry Revenue (Million), by Country 2024 & 2032
- Figure 63: Latin America Narrowband IoT Industry Revenue Share (%), by Country 2024 & 2032
- Figure 64: Middle East and Africa Narrowband IoT Industry Revenue (Million), by Component 2024 & 2032
- Figure 65: Middle East and Africa Narrowband IoT Industry Revenue Share (%), by Component 2024 & 2032
- Figure 66: Middle East and Africa Narrowband IoT Industry Revenue (Million), by Deployment 2024 & 2032
- Figure 67: Middle East and Africa Narrowband IoT Industry Revenue Share (%), by Deployment 2024 & 2032
- Figure 68: Middle East and Africa Narrowband IoT Industry Revenue (Million), by Device Type 2024 & 2032
- Figure 69: Middle East and Africa Narrowband IoT Industry Revenue Share (%), by Device Type 2024 & 2032
- Figure 70: Middle East and Africa Narrowband IoT Industry Revenue (Million), by Application 2024 & 2032
- Figure 71: Middle East and Africa Narrowband IoT Industry Revenue Share (%), by Application 2024 & 2032
- Figure 72: Middle East and Africa Narrowband IoT Industry Revenue (Million), by Country 2024 & 2032
- Figure 73: Middle East and Africa Narrowband IoT Industry Revenue Share (%), by Country 2024 & 2032
List of Tables
- Table 1: Global Narrowband IoT Industry Revenue Million Forecast, by Region 2019 & 2032
- Table 2: Global Narrowband IoT Industry Revenue Million Forecast, by Component 2019 & 2032
- Table 3: Global Narrowband IoT Industry Revenue Million Forecast, by Deployment 2019 & 2032
- Table 4: Global Narrowband IoT Industry Revenue Million Forecast, by Device Type 2019 & 2032
- Table 5: Global Narrowband IoT Industry Revenue Million Forecast, by Application 2019 & 2032
- Table 6: Global Narrowband IoT Industry Revenue Million Forecast, by Region 2019 & 2032
- Table 7: Global Narrowband IoT Industry Revenue Million Forecast, by Country 2019 & 2032
- Table 8: United States Narrowband IoT Industry Revenue (Million) Forecast, by Application 2019 & 2032
- Table 9: Canada Narrowband IoT Industry Revenue (Million) Forecast, by Application 2019 & 2032
- Table 10: Mexico Narrowband IoT Industry Revenue (Million) Forecast, by Application 2019 & 2032
- Table 11: Global Narrowband IoT Industry Revenue Million Forecast, by Country 2019 & 2032
- Table 12: Germany Narrowband IoT Industry Revenue (Million) Forecast, by Application 2019 & 2032
- Table 13: United Kingdom Narrowband IoT Industry Revenue (Million) Forecast, by Application 2019 & 2032
- Table 14: France Narrowband IoT Industry Revenue (Million) Forecast, by Application 2019 & 2032
- Table 15: Spain Narrowband IoT Industry Revenue (Million) Forecast, by Application 2019 & 2032
- Table 16: Italy Narrowband IoT Industry Revenue (Million) Forecast, by Application 2019 & 2032
- Table 17: Spain Narrowband IoT Industry Revenue (Million) Forecast, by Application 2019 & 2032
- Table 18: Belgium Narrowband IoT Industry Revenue (Million) Forecast, by Application 2019 & 2032
- Table 19: Netherland Narrowband IoT Industry Revenue (Million) Forecast, by Application 2019 & 2032
- Table 20: Nordics Narrowband IoT Industry Revenue (Million) Forecast, by Application 2019 & 2032
- Table 21: Rest of Europe Narrowband IoT Industry Revenue (Million) Forecast, by Application 2019 & 2032
- Table 22: Global Narrowband IoT Industry Revenue Million Forecast, by Country 2019 & 2032
- Table 23: China Narrowband IoT Industry Revenue (Million) Forecast, by Application 2019 & 2032
- Table 24: Japan Narrowband IoT Industry Revenue (Million) Forecast, by Application 2019 & 2032
- Table 25: India Narrowband IoT Industry Revenue (Million) Forecast, by Application 2019 & 2032
- Table 26: South Korea Narrowband IoT Industry Revenue (Million) Forecast, by Application 2019 & 2032
- Table 27: Southeast Asia Narrowband IoT Industry Revenue (Million) Forecast, by Application 2019 & 2032
- Table 28: Australia Narrowband IoT Industry Revenue (Million) Forecast, by Application 2019 & 2032
- Table 29: Indonesia Narrowband IoT Industry Revenue (Million) Forecast, by Application 2019 & 2032
- Table 30: Phillipes Narrowband IoT Industry Revenue (Million) Forecast, by Application 2019 & 2032
- Table 31: Singapore Narrowband IoT Industry Revenue (Million) Forecast, by Application 2019 & 2032
- Table 32: Thailandc Narrowband IoT Industry Revenue (Million) Forecast, by Application 2019 & 2032
- Table 33: Rest of Asia Pacific Narrowband IoT Industry Revenue (Million) Forecast, by Application 2019 & 2032
- Table 34: Global Narrowband IoT Industry Revenue Million Forecast, by Country 2019 & 2032
- Table 35: Brazil Narrowband IoT Industry Revenue (Million) Forecast, by Application 2019 & 2032
- Table 36: Argentina Narrowband IoT Industry Revenue (Million) Forecast, by Application 2019 & 2032
- Table 37: Peru Narrowband IoT Industry Revenue (Million) Forecast, by Application 2019 & 2032
- Table 38: Chile Narrowband IoT Industry Revenue (Million) Forecast, by Application 2019 & 2032
- Table 39: Colombia Narrowband IoT Industry Revenue (Million) Forecast, by Application 2019 & 2032
- Table 40: Ecuador Narrowband IoT Industry Revenue (Million) Forecast, by Application 2019 & 2032
- Table 41: Venezuela Narrowband IoT Industry Revenue (Million) Forecast, by Application 2019 & 2032
- Table 42: Rest of South America Narrowband IoT Industry Revenue (Million) Forecast, by Application 2019 & 2032
- Table 43: Global Narrowband IoT Industry Revenue Million Forecast, by Country 2019 & 2032
- Table 44: United States Narrowband IoT Industry Revenue (Million) Forecast, by Application 2019 & 2032
- Table 45: Canada Narrowband IoT Industry Revenue (Million) Forecast, by Application 2019 & 2032
- Table 46: Mexico Narrowband IoT Industry Revenue (Million) Forecast, by Application 2019 & 2032
- Table 47: Global Narrowband IoT Industry Revenue Million Forecast, by Country 2019 & 2032
- Table 48: United Arab Emirates Narrowband IoT Industry Revenue (Million) Forecast, by Application 2019 & 2032
- Table 49: Saudi Arabia Narrowband IoT Industry Revenue (Million) Forecast, by Application 2019 & 2032
- Table 50: South Africa Narrowband IoT Industry Revenue (Million) Forecast, by Application 2019 & 2032
- Table 51: Rest of Middle East and Africa Narrowband IoT Industry Revenue (Million) Forecast, by Application 2019 & 2032
- Table 52: Global Narrowband IoT Industry Revenue Million Forecast, by Component 2019 & 2032
- Table 53: Global Narrowband IoT Industry Revenue Million Forecast, by Deployment 2019 & 2032
- Table 54: Global Narrowband IoT Industry Revenue Million Forecast, by Device Type 2019 & 2032
- Table 55: Global Narrowband IoT Industry Revenue Million Forecast, by Application 2019 & 2032
- Table 56: Global Narrowband IoT Industry Revenue Million Forecast, by Country 2019 & 2032
- Table 57: United States Narrowband IoT Industry Revenue (Million) Forecast, by Application 2019 & 2032
- Table 58: Canada Narrowband IoT Industry Revenue (Million) Forecast, by Application 2019 & 2032
- Table 59: Global Narrowband IoT Industry Revenue Million Forecast, by Component 2019 & 2032
- Table 60: Global Narrowband IoT Industry Revenue Million Forecast, by Deployment 2019 & 2032
- Table 61: Global Narrowband IoT Industry Revenue Million Forecast, by Device Type 2019 & 2032
- Table 62: Global Narrowband IoT Industry Revenue Million Forecast, by Application 2019 & 2032
- Table 63: Global Narrowband IoT Industry Revenue Million Forecast, by Country 2019 & 2032
- Table 64: Germany Narrowband IoT Industry Revenue (Million) Forecast, by Application 2019 & 2032
- Table 65: United Kingdom Narrowband IoT Industry Revenue (Million) Forecast, by Application 2019 & 2032
- Table 66: France Narrowband IoT Industry Revenue (Million) Forecast, by Application 2019 & 2032
- Table 67: Global Narrowband IoT Industry Revenue Million Forecast, by Component 2019 & 2032
- Table 68: Global Narrowband IoT Industry Revenue Million Forecast, by Deployment 2019 & 2032
- Table 69: Global Narrowband IoT Industry Revenue Million Forecast, by Device Type 2019 & 2032
- Table 70: Global Narrowband IoT Industry Revenue Million Forecast, by Application 2019 & 2032
- Table 71: Global Narrowband IoT Industry Revenue Million Forecast, by Country 2019 & 2032
- Table 72: India Narrowband IoT Industry Revenue (Million) Forecast, by Application 2019 & 2032
- Table 73: China Narrowband IoT Industry Revenue (Million) Forecast, by Application 2019 & 2032
- Table 74: Japan Narrowband IoT Industry Revenue (Million) Forecast, by Application 2019 & 2032
- Table 75: Global Narrowband IoT Industry Revenue Million Forecast, by Component 2019 & 2032
- Table 76: Global Narrowband IoT Industry Revenue Million Forecast, by Deployment 2019 & 2032
- Table 77: Global Narrowband IoT Industry Revenue Million Forecast, by Device Type 2019 & 2032
- Table 78: Global Narrowband IoT Industry Revenue Million Forecast, by Application 2019 & 2032
- Table 79: Global Narrowband IoT Industry Revenue Million Forecast, by Country 2019 & 2032
- Table 80: Global Narrowband IoT Industry Revenue Million Forecast, by Component 2019 & 2032
- Table 81: Global Narrowband IoT Industry Revenue Million Forecast, by Deployment 2019 & 2032
- Table 82: Global Narrowband IoT Industry Revenue Million Forecast, by Device Type 2019 & 2032
- Table 83: Global Narrowband IoT Industry Revenue Million Forecast, by Application 2019 & 2032
- Table 84: Global Narrowband IoT Industry Revenue Million Forecast, by Country 2019 & 2032
- Table 85: Brazil Narrowband IoT Industry Revenue (Million) Forecast, by Application 2019 & 2032
- Table 86: Argentina Narrowband IoT Industry Revenue (Million) Forecast, by Application 2019 & 2032
- Table 87: Global Narrowband IoT Industry Revenue Million Forecast, by Component 2019 & 2032
- Table 88: Global Narrowband IoT Industry Revenue Million Forecast, by Deployment 2019 & 2032
- Table 89: Global Narrowband IoT Industry Revenue Million Forecast, by Device Type 2019 & 2032
- Table 90: Global Narrowband IoT Industry Revenue Million Forecast, by Application 2019 & 2032
- Table 91: Global Narrowband IoT Industry Revenue Million Forecast, by Country 2019 & 2032
- Table 92: United Arab Emirates Narrowband IoT Industry Revenue (Million) Forecast, by Application 2019 & 2032
- Table 93: Saudi Arabia Narrowband IoT Industry Revenue (Million) Forecast, by Application 2019 & 2032
Frequently Asked Questions
1. What is the projected Compound Annual Growth Rate (CAGR) of the Narrowband IoT Industry?
The projected CAGR is approximately 31.82%.
2. Which companies are prominent players in the Narrowband IoT Industry?
Key companies in the market include Verizon Wireless, SEQUANS Communications, Twilio, Vodafone Group, Ericsson Corporation, Qualcomm Technologies, Huawei Technologies Co Ltd, Nokia Corporation, SEQUANS Communications*List Not Exhaustive, AT&T Inc, Intel Corporation, Deutsche Telekom.
3. What are the main segments of the Narrowband IoT Industry?
The market segments include Component, Deployment, Device Type, Application.
4. Can you provide details about the market size?
The market size is estimated to be USD XX Million as of 2022.
5. What are some drivers contributing to market growth?
Increasing Need of Cloud Storage; Increasing Cyberattacks Among Enterprises.
6. What are the notable trends driving market growth?
Smart Cities is Expected to Drive the Market.
7. Are there any restraints impacting market growth?
Increasing Network Complexity.
8. Can you provide examples of recent developments in the market?
March 2023 - Monogoto, a cloud-based cellular network provider, has announced a new roaming agreement with Skylo Technologies, a Non-Terrestrial Network (NTN) service operator. This new partnership lowers developers' barrier to adding satellite connectivity to existing public and/or private networks on Monogoto Cloud, giving the world's most economical and accessible solution for NB-IoT Satellite connectivity for asset monitoring solutions. Also, SODAQ, a low-power tracking and sensing system developer, will unveil a new asset-tracking trial kit using Monogoto connection and network.
9. What pricing options are available for accessing the report?
Pricing options include single-user, multi-user, and enterprise licenses priced at USD 4750, USD 5250, and USD 8750 respectively.
10. Is the market size provided in terms of value or volume?
The market size is provided in terms of value, measured in Million.
11. Are there any specific market keywords associated with the report?
Yes, the market keyword associated with the report is "Narrowband IoT Industry," which aids in identifying and referencing the specific market segment covered.
12. How do I determine which pricing option suits my needs best?
The pricing options vary based on user requirements and access needs. Individual users may opt for single-user licenses, while businesses requiring broader access may choose multi-user or enterprise licenses for cost-effective access to the report.
13. Are there any additional resources or data provided in the Narrowband IoT Industry report?
While the report offers comprehensive insights, it's advisable to review the specific contents or supplementary materials provided to ascertain if additional resources or data are available.
14. How can I stay updated on further developments or reports in the Narrowband IoT Industry?
To stay informed about further developments, trends, and reports in the Narrowband IoT Industry, consider subscribing to industry newsletters, following relevant companies and organizations, or regularly checking reputable industry news sources and publications.
Methodology
Step 1 - Identification of Relevant Samples Size from Population Database


Step 2 - Approaches for Defining Global Market Size (Value, Volume* & Price*)

Note*: In applicable scenarios
Step 3 - Data Sources
Primary Research
- Web Analytics
- Survey Reports
- Research Institute
- Latest Research Reports
- Opinion Leaders
Secondary Research
- Annual Reports
- White Paper
- Latest Press Release
- Industry Association
- Paid Database
- Investor Presentations

Step 4 - Data Triangulation
Involves using different sources of information in order to increase the validity of a study
These sources are likely to be stakeholders in a program - participants, other researchers, program staff, other community members, and so on.
Then we put all data in single framework & apply various statistical tools to find out the dynamic on the market.
During the analysis stage, feedback from the stakeholder groups would be compared to determine areas of agreement as well as areas of divergence
