

Key Insights
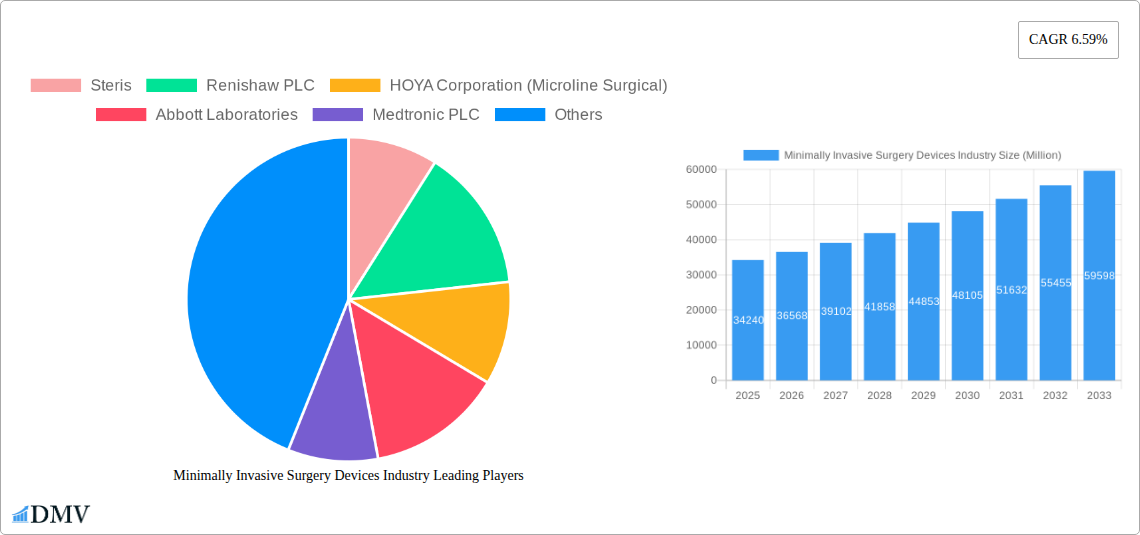
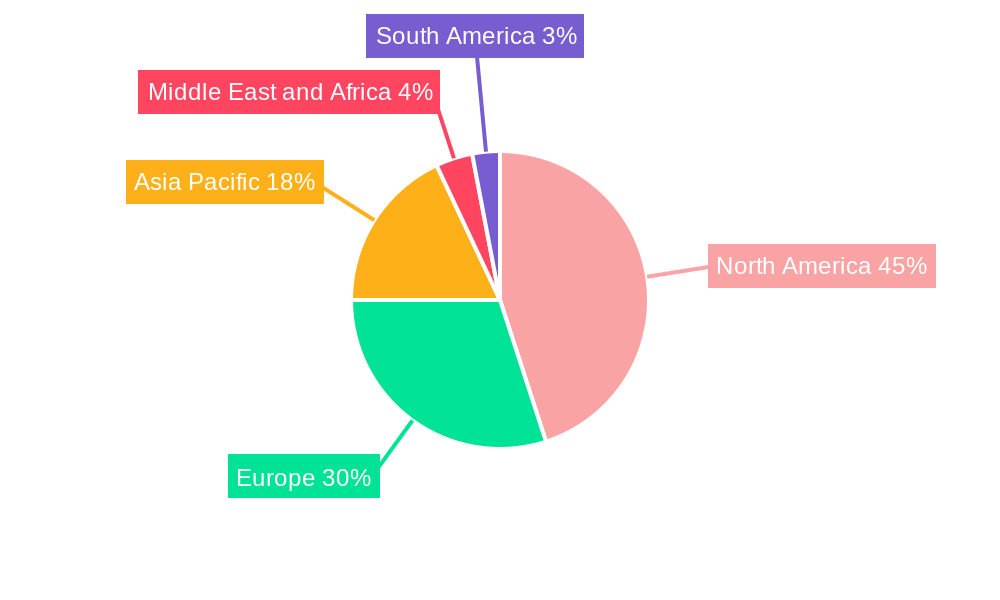
The Minimally Invasive Surgery (MIS) devices market, valued at $34.24 billion in 2025, is projected to experience robust growth, driven by a compound annual growth rate (CAGR) of 6.59% from 2025 to 2033. This expansion is fueled by several key factors. Firstly, the increasing prevalence of chronic diseases like cardiovascular conditions and cancer, necessitating more frequent surgical interventions, significantly boosts demand. Secondly, the inherent advantages of MIS procedures—reduced invasiveness, faster recovery times, and shorter hospital stays—are driving patient and physician preference. Technological advancements, such as the development of sophisticated robotic-assisted surgical systems, advanced imaging technologies, and improved minimally invasive instruments, further enhance the efficacy and precision of these procedures, contributing to market growth. The market is segmented by product type (handheld instruments, guiding devices, guidewires, electrosurgical devices, endoscopic devices, laparoscopic devices, monitoring and visualization devices, ablation devices, laser-based devices, robotic-assisted surgical systems, and other MIS devices) and application (aesthetic, cardiovascular, gastrointestinal, gynecological, orthopedic, urological, and other applications). North America currently holds a significant market share, driven by advanced healthcare infrastructure and high adoption rates. However, the Asia-Pacific region is poised for significant growth due to rising disposable incomes, expanding healthcare infrastructure, and increasing awareness of MIS benefits. Competition within the market is intense, with major players such as Medtronic, Johnson & Johnson, Boston Scientific, and Intuitive Surgical constantly innovating and expanding their product portfolios to maintain market leadership.
The continued growth of the MIS devices market is anticipated to be influenced by several factors. Government initiatives promoting minimally invasive procedures and reimbursement policies favorable to these techniques will further accelerate market expansion. However, challenges remain, including the relatively high initial investment costs associated with advanced robotic systems and the need for skilled surgical professionals trained in MIS techniques. Furthermore, potential risks and complications associated with MIS procedures, although generally lower than open surgeries, represent a restraint. Nevertheless, the overall market outlook remains positive, driven by technological advancements, increasing demand for less-invasive surgical solutions, and a growing elderly population with higher rates of chronic diseases. The development of innovative devices and techniques that address unmet clinical needs will continue to be a crucial driver of future growth within this dynamic market segment.
Minimally Invasive Surgery Devices Industry Market Report: 2019-2033
This comprehensive report provides a detailed analysis of the Minimally Invasive Surgery (MIS) Devices market, offering invaluable insights for stakeholders across the industry value chain. The study period covers 2019-2033, with 2025 as the base and estimated year. This report projects a market valued at xx Million by 2033, driven by technological advancements and increasing adoption rates.
Minimally Invasive Surgery Devices Industry Market Composition & Trends
This section delves into the competitive landscape, analyzing market concentration, innovation drivers, and regulatory influences shaping the MIS devices market. The report evaluates the market share distribution among key players such as Steris, Renishaw PLC, HOYA Corporation (Microline Surgical), Abbott Laboratories, Medtronic PLC, Boston Scientific, CONMED Corporation, Koninklijke Philips NV, Intuitive Surgical Inc, Johnson & Johnson Inc, Stryker Corporation, Olympus Corporation, and Zimmer Biomet Holdings Inc. (list not exhaustive). The analysis also incorporates mergers and acquisitions (M&A) activities, examining deal values and their impact on market dynamics. For example, Boston Scientific's USD 230 Million acquisition of M.I.Tech in June 2022 significantly strengthened its position in the endoscopic and urologic stent market.
- Market Concentration: The market exhibits a [Describe concentration level - e.g., moderately concentrated] structure with [Number] major players holding approximately [Percentage]% of the market share.
- Innovation Catalysts: Continuous advancements in robotics, imaging technologies, and materials science are driving innovation and expanding the applications of MIS devices.
- Regulatory Landscape: Stringent regulatory approvals and safety standards influence product development and market access strategies.
- Substitute Products: The emergence of alternative minimally invasive techniques and technologies presents competitive pressures.
- End-User Profiles: Hospitals, ambulatory surgical centers, and clinics constitute the primary end-users of MIS devices.
- M&A Activities: Strategic acquisitions and partnerships are reshaping the competitive landscape and driving market consolidation.
Minimally Invasive Surgery Devices Industry Industry Evolution
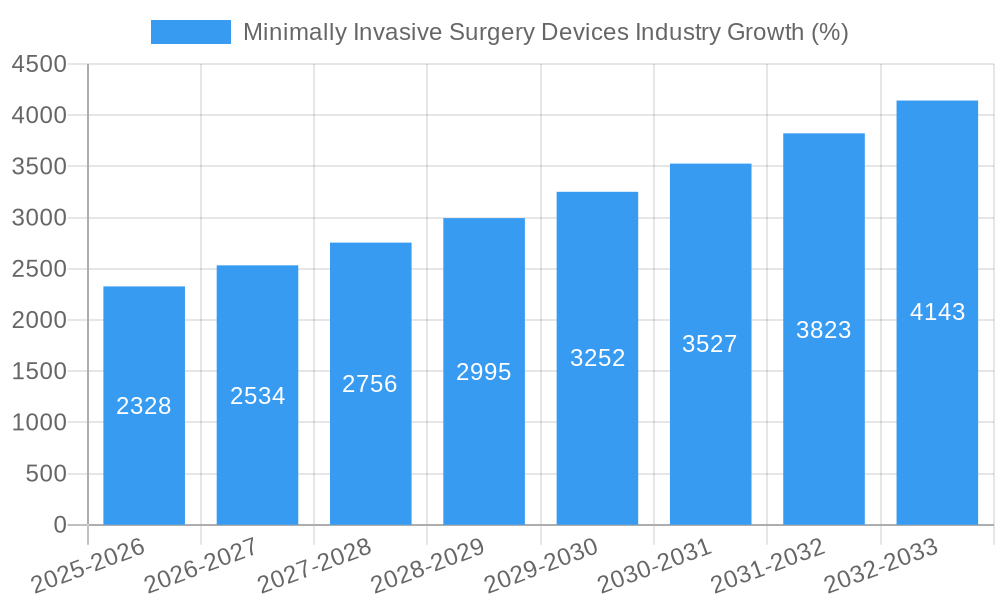
This section provides a comprehensive analysis of the MIS devices market's evolution from 2019 to 2033. The report examines market growth trajectories, technological advancements, and shifting consumer demands, providing specific data points such as growth rates and adoption metrics. The analysis highlights the increasing preference for minimally invasive procedures due to their benefits over traditional open surgeries, including reduced recovery time and improved patient outcomes. Technological advancements, including the development of advanced imaging systems, robotic-assisted surgical systems, and minimally invasive surgical instruments, have significantly contributed to the market's growth. The predicted Compound Annual Growth Rate (CAGR) for the forecast period (2025-2033) is estimated at xx%. The adoption of MIS devices has been steadily increasing across various applications, particularly in cardiovascular, orthopedic, and urological surgeries. The report projects continued growth driven by aging populations and rising prevalence of chronic diseases requiring MIS procedures.
Leading Regions, Countries, or Segments in Minimally Invasive Surgery Devices Industry
This section identifies the dominant regions, countries, and segments within the MIS devices market. The analysis considers both product categories (Handheld Instruments, Guiding Devices, Guidewires, Electrosurgical Devices, Endoscopic Devices, Laparoscopic Devices, Monitoring and Visualization Devices, Ablation Devices, Laser-based Devices, Robotic-assisted Surgical Systems, Other MIS Devices) and applications (Aesthetic, Cardiovascular, Gastrointestinal, Gynecological, Orthopedic, Urological, Other Applications).
Key Drivers:
- Increased Healthcare Spending: Growing investment in healthcare infrastructure and technological advancements fuels market expansion in developed regions.
- Favorable Regulatory Policies: Supportive regulatory frameworks and streamlined approval processes promote market growth.
- Technological Advancements: Continuous innovations in robotic surgery and imaging systems expand the potential applications of MIS devices.
Dominant Regions/Segments: The North American market is currently the largest, driven by high healthcare expenditure and technological advancements. However, rapidly developing economies in Asia-Pacific are expected to witness substantial growth in the coming years. The fastest-growing segment is likely to be [predict the segment - e.g., robotic-assisted surgical systems], due to its increased precision and minimally invasive nature.
Minimally Invasive Surgery Devices Industry Product Innovations
Recent innovations in MIS devices include enhanced visualization systems offering improved image quality and 3D capabilities, and the development of smaller, more precise instruments resulting in less trauma to patients. Robotic-assisted surgical systems are becoming increasingly sophisticated, incorporating advanced features like haptic feedback and improved dexterity. These innovations contribute to improved surgical outcomes, shorter recovery times, and reduced complications, driving adoption across diverse surgical specializations. Unique selling propositions for many devices include enhanced precision, reduced invasiveness, and improved patient comfort.
Propelling Factors for Minimally Invasive Surgery Devices Industry Growth
Several factors are driving the growth of the MIS devices market. Technological advancements, such as improved imaging techniques and robotic surgery, are enhancing precision and minimizing invasiveness. Increasing healthcare spending, particularly in emerging economies, is providing financial impetus for greater adoption of MIS devices. Furthermore, favorable regulatory policies are encouraging innovation and market access. For example, streamlined approval processes for innovative devices accelerate their entry into the market.
Obstacles in the Minimally Invasive Surgery Devices Industry Market
The MIS devices market faces challenges such as stringent regulatory requirements, which can delay product launches and increase development costs. Supply chain disruptions, particularly those involving specialized components, can impact production and market availability. Furthermore, intense competition among established players and emerging companies creates pricing pressures and necessitates continuous innovation to maintain a competitive edge. These factors, if not addressed effectively, could collectively curtail market growth by an estimated xx%.
Future Opportunities in Minimally Invasive Surgery Devices Industry
Emerging opportunities lie in the development of personalized MIS devices, tailored to individual patient needs and anatomical variations. The integration of artificial intelligence (AI) and machine learning (ML) promises to enhance surgical precision, reduce complications, and improve overall patient outcomes. Furthermore, expanding into new markets, particularly in developing countries with growing healthcare infrastructure, presents significant growth potential.
Major Players in the Minimally Invasive Surgery Devices Industry Ecosystem
- Steris
- Renishaw PLC
- HOYA Corporation (Microline Surgical)
- Abbott Laboratories
- Medtronic PLC
- Boston Scientific
- CONMED Corporation
- Koninklijke Philips NV
- Intuitive Surgical Inc
- Johnson & Johnson Inc
- Stryker Corporation
- Olympus Corporation
- Zimmer Biomet Holdings Inc
Key Developments in Minimally Invasive Surgery Devices Industry Industry
- January 2023: PENTAX Medical received CE marks for its INSPIRA video processor and i20c video endoscope series, setting new standards in endoscopic imaging.
- June 2022: Boston Scientific acquired a majority stake in M.I.Tech for USD 230 Million, expanding its presence in the endoscopic and urologic stent market.
Strategic Minimally Invasive Surgery Devices Industry Market Forecast
The MIS devices market is poised for continued growth, fueled by technological innovation, expanding applications, and increasing healthcare investment globally. Future opportunities include the development of more sophisticated robotic systems, advanced imaging technologies, and minimally invasive surgical instruments. The market is expected to witness a sustained CAGR of xx% during the forecast period (2025-2033), driven by these factors and the growing preference for minimally invasive surgical procedures.
Minimally Invasive Surgery Devices Industry Segmentation
-
1. Product
- 1.1. Handheld Instruments
-
1.2. Guiding Devices
- 1.2.1. Guiding Catheters
- 1.2.2. Guidewires
- 1.3. Electrosurgical Devices
- 1.4. Endoscopic Devices
- 1.5. Laproscopic Devices
- 1.6. Monitoring and Visualization Devices
- 1.7. Ablation Devices
- 1.8. Laser-based Devices
- 1.9. Robotic-assisted Surgical Systems
- 1.10. Other MIS Devices
-
2. Application
- 2.1. Aesthetic
- 2.2. Cardiovascular
- 2.3. Gastrointestinal
- 2.4. Gynecological
- 2.5. Orthopedic
- 2.6. Urological
- 2.7. Other Applications
Minimally Invasive Surgery Devices Industry Segmentation By Geography
-
1. North America
- 1.1. United States
- 1.2. Canada
- 1.3. Mexico
-
2. Europe
- 2.1. Germany
- 2.2. United Kingdom
- 2.3. France
- 2.4. Italy
- 2.5. Spain
- 2.6. Rest of Europe
-
3. Asia Pacific
- 3.1. China
- 3.2. Japan
- 3.3. India
- 3.4. Australia
- 3.5. South Korea
- 3.6. Rest of Asia Pacific
-
4. Middle East and Africa
- 4.1. GCC
- 4.2. South Africa
- 4.3. Rest of Middle East and Africa
-
5. South America
- 5.1. Brazil
- 5.2. Argentina
- 5.3. Rest of South America
Minimally Invasive Surgery Devices Industry REPORT HIGHLIGHTS
| Aspects | Details |
|---|---|
| Study Period | 2019-2033 |
| Base Year | 2024 |
| Estimated Year | 2025 |
| Forecast Period | 2025-2033 |
| Historical Period | 2019-2024 |
| Growth Rate | CAGR of 6.59% from 2019-2033 |
| Segmentation |
|
Table of Contents
- 1. Introduction
- 1.1. Research Scope
- 1.2. Market Segmentation
- 1.3. Research Methodology
- 1.4. Definitions and Assumptions
- 2. Executive Summary
- 2.1. Introduction
- 3. Market Dynamics
- 3.1. Introduction
- 3.2. Market Drivers
- 3.2.1. Higher Acceptance Rate of Minimally Invasive Surgeries Over Traditional Surgeries; Increasing Prevalence of Lifestyle-related and Chronic Disorders; Growing Technological Advancements
- 3.3. Market Restrains
- 3.3.1. Shortage of Experienced Professionals; Uncertain Regulatory Framework
- 3.4. Market Trends
- 3.4.1. Endoscopic Devices is Expected to be the Fastest-growing Segment During the Forecast Period
- 4. Market Factor Analysis
- 4.1. Porters Five Forces
- 4.2. Supply/Value Chain
- 4.3. PESTEL analysis
- 4.4. Market Entropy
- 4.5. Patent/Trademark Analysis
- 5. Global Minimally Invasive Surgery Devices Industry Analysis, Insights and Forecast, 2019-2031
- 5.1. Market Analysis, Insights and Forecast - by Product
- 5.1.1. Handheld Instruments
- 5.1.2. Guiding Devices
- 5.1.2.1. Guiding Catheters
- 5.1.2.2. Guidewires
- 5.1.3. Electrosurgical Devices
- 5.1.4. Endoscopic Devices
- 5.1.5. Laproscopic Devices
- 5.1.6. Monitoring and Visualization Devices
- 5.1.7. Ablation Devices
- 5.1.8. Laser-based Devices
- 5.1.9. Robotic-assisted Surgical Systems
- 5.1.10. Other MIS Devices
- 5.2. Market Analysis, Insights and Forecast - by Application
- 5.2.1. Aesthetic
- 5.2.2. Cardiovascular
- 5.2.3. Gastrointestinal
- 5.2.4. Gynecological
- 5.2.5. Orthopedic
- 5.2.6. Urological
- 5.2.7. Other Applications
- 5.3. Market Analysis, Insights and Forecast - by Region
- 5.3.1. North America
- 5.3.2. Europe
- 5.3.3. Asia Pacific
- 5.3.4. Middle East and Africa
- 5.3.5. South America
- 5.1. Market Analysis, Insights and Forecast - by Product
- 6. North America Minimally Invasive Surgery Devices Industry Analysis, Insights and Forecast, 2019-2031
- 6.1. Market Analysis, Insights and Forecast - by Product
- 6.1.1. Handheld Instruments
- 6.1.2. Guiding Devices
- 6.1.2.1. Guiding Catheters
- 6.1.2.2. Guidewires
- 6.1.3. Electrosurgical Devices
- 6.1.4. Endoscopic Devices
- 6.1.5. Laproscopic Devices
- 6.1.6. Monitoring and Visualization Devices
- 6.1.7. Ablation Devices
- 6.1.8. Laser-based Devices
- 6.1.9. Robotic-assisted Surgical Systems
- 6.1.10. Other MIS Devices
- 6.2. Market Analysis, Insights and Forecast - by Application
- 6.2.1. Aesthetic
- 6.2.2. Cardiovascular
- 6.2.3. Gastrointestinal
- 6.2.4. Gynecological
- 6.2.5. Orthopedic
- 6.2.6. Urological
- 6.2.7. Other Applications
- 6.1. Market Analysis, Insights and Forecast - by Product
- 7. Europe Minimally Invasive Surgery Devices Industry Analysis, Insights and Forecast, 2019-2031
- 7.1. Market Analysis, Insights and Forecast - by Product
- 7.1.1. Handheld Instruments
- 7.1.2. Guiding Devices
- 7.1.2.1. Guiding Catheters
- 7.1.2.2. Guidewires
- 7.1.3. Electrosurgical Devices
- 7.1.4. Endoscopic Devices
- 7.1.5. Laproscopic Devices
- 7.1.6. Monitoring and Visualization Devices
- 7.1.7. Ablation Devices
- 7.1.8. Laser-based Devices
- 7.1.9. Robotic-assisted Surgical Systems
- 7.1.10. Other MIS Devices
- 7.2. Market Analysis, Insights and Forecast - by Application
- 7.2.1. Aesthetic
- 7.2.2. Cardiovascular
- 7.2.3. Gastrointestinal
- 7.2.4. Gynecological
- 7.2.5. Orthopedic
- 7.2.6. Urological
- 7.2.7. Other Applications
- 7.1. Market Analysis, Insights and Forecast - by Product
- 8. Asia Pacific Minimally Invasive Surgery Devices Industry Analysis, Insights and Forecast, 2019-2031
- 8.1. Market Analysis, Insights and Forecast - by Product
- 8.1.1. Handheld Instruments
- 8.1.2. Guiding Devices
- 8.1.2.1. Guiding Catheters
- 8.1.2.2. Guidewires
- 8.1.3. Electrosurgical Devices
- 8.1.4. Endoscopic Devices
- 8.1.5. Laproscopic Devices
- 8.1.6. Monitoring and Visualization Devices
- 8.1.7. Ablation Devices
- 8.1.8. Laser-based Devices
- 8.1.9. Robotic-assisted Surgical Systems
- 8.1.10. Other MIS Devices
- 8.2. Market Analysis, Insights and Forecast - by Application
- 8.2.1. Aesthetic
- 8.2.2. Cardiovascular
- 8.2.3. Gastrointestinal
- 8.2.4. Gynecological
- 8.2.5. Orthopedic
- 8.2.6. Urological
- 8.2.7. Other Applications
- 8.1. Market Analysis, Insights and Forecast - by Product
- 9. Middle East and Africa Minimally Invasive Surgery Devices Industry Analysis, Insights and Forecast, 2019-2031
- 9.1. Market Analysis, Insights and Forecast - by Product
- 9.1.1. Handheld Instruments
- 9.1.2. Guiding Devices
- 9.1.2.1. Guiding Catheters
- 9.1.2.2. Guidewires
- 9.1.3. Electrosurgical Devices
- 9.1.4. Endoscopic Devices
- 9.1.5. Laproscopic Devices
- 9.1.6. Monitoring and Visualization Devices
- 9.1.7. Ablation Devices
- 9.1.8. Laser-based Devices
- 9.1.9. Robotic-assisted Surgical Systems
- 9.1.10. Other MIS Devices
- 9.2. Market Analysis, Insights and Forecast - by Application
- 9.2.1. Aesthetic
- 9.2.2. Cardiovascular
- 9.2.3. Gastrointestinal
- 9.2.4. Gynecological
- 9.2.5. Orthopedic
- 9.2.6. Urological
- 9.2.7. Other Applications
- 9.1. Market Analysis, Insights and Forecast - by Product
- 10. South America Minimally Invasive Surgery Devices Industry Analysis, Insights and Forecast, 2019-2031
- 10.1. Market Analysis, Insights and Forecast - by Product
- 10.1.1. Handheld Instruments
- 10.1.2. Guiding Devices
- 10.1.2.1. Guiding Catheters
- 10.1.2.2. Guidewires
- 10.1.3. Electrosurgical Devices
- 10.1.4. Endoscopic Devices
- 10.1.5. Laproscopic Devices
- 10.1.6. Monitoring and Visualization Devices
- 10.1.7. Ablation Devices
- 10.1.8. Laser-based Devices
- 10.1.9. Robotic-assisted Surgical Systems
- 10.1.10. Other MIS Devices
- 10.2. Market Analysis, Insights and Forecast - by Application
- 10.2.1. Aesthetic
- 10.2.2. Cardiovascular
- 10.2.3. Gastrointestinal
- 10.2.4. Gynecological
- 10.2.5. Orthopedic
- 10.2.6. Urological
- 10.2.7. Other Applications
- 10.1. Market Analysis, Insights and Forecast - by Product
- 11. North America Minimally Invasive Surgery Devices Industry Analysis, Insights and Forecast, 2019-2031
- 11.1. Market Analysis, Insights and Forecast - By Country/Sub-region
- 11.1.1 United States
- 11.1.2 Canada
- 11.1.3 Mexico
- 12. Europe Minimally Invasive Surgery Devices Industry Analysis, Insights and Forecast, 2019-2031
- 12.1. Market Analysis, Insights and Forecast - By Country/Sub-region
- 12.1.1 Germany
- 12.1.2 United Kingdom
- 12.1.3 France
- 12.1.4 Italy
- 12.1.5 Spain
- 12.1.6 Rest of Europe
- 13. Asia Pacific Minimally Invasive Surgery Devices Industry Analysis, Insights and Forecast, 2019-2031
- 13.1. Market Analysis, Insights and Forecast - By Country/Sub-region
- 13.1.1 China
- 13.1.2 Japan
- 13.1.3 India
- 13.1.4 Australia
- 13.1.5 South Korea
- 13.1.6 Rest of Asia Pacific
- 14. Middle East and Africa Minimally Invasive Surgery Devices Industry Analysis, Insights and Forecast, 2019-2031
- 14.1. Market Analysis, Insights and Forecast - By Country/Sub-region
- 14.1.1 GCC
- 14.1.2 South Africa
- 14.1.3 Rest of Middle East and Africa
- 15. South America Minimally Invasive Surgery Devices Industry Analysis, Insights and Forecast, 2019-2031
- 15.1. Market Analysis, Insights and Forecast - By Country/Sub-region
- 15.1.1 Brazil
- 15.1.2 Argentina
- 15.1.3 Rest of South America
- 16. Competitive Analysis
- 16.1. Global Market Share Analysis 2024
- 16.2. Company Profiles
- 16.2.1 Steris
- 16.2.1.1. Overview
- 16.2.1.2. Products
- 16.2.1.3. SWOT Analysis
- 16.2.1.4. Recent Developments
- 16.2.1.5. Financials (Based on Availability)
- 16.2.2 Renishaw PLC
- 16.2.2.1. Overview
- 16.2.2.2. Products
- 16.2.2.3. SWOT Analysis
- 16.2.2.4. Recent Developments
- 16.2.2.5. Financials (Based on Availability)
- 16.2.3 HOYA Corporation (Microline Surgical)
- 16.2.3.1. Overview
- 16.2.3.2. Products
- 16.2.3.3. SWOT Analysis
- 16.2.3.4. Recent Developments
- 16.2.3.5. Financials (Based on Availability)
- 16.2.4 Abbott Laboratories
- 16.2.4.1. Overview
- 16.2.4.2. Products
- 16.2.4.3. SWOT Analysis
- 16.2.4.4. Recent Developments
- 16.2.4.5. Financials (Based on Availability)
- 16.2.5 Medtronic PLC
- 16.2.5.1. Overview
- 16.2.5.2. Products
- 16.2.5.3. SWOT Analysis
- 16.2.5.4. Recent Developments
- 16.2.5.5. Financials (Based on Availability)
- 16.2.6 Boston Scientific
- 16.2.6.1. Overview
- 16.2.6.2. Products
- 16.2.6.3. SWOT Analysis
- 16.2.6.4. Recent Developments
- 16.2.6.5. Financials (Based on Availability)
- 16.2.7 CONMED Corporation*List Not Exhaustive
- 16.2.7.1. Overview
- 16.2.7.2. Products
- 16.2.7.3. SWOT Analysis
- 16.2.7.4. Recent Developments
- 16.2.7.5. Financials (Based on Availability)
- 16.2.8 Koninklijke Philips NV
- 16.2.8.1. Overview
- 16.2.8.2. Products
- 16.2.8.3. SWOT Analysis
- 16.2.8.4. Recent Developments
- 16.2.8.5. Financials (Based on Availability)
- 16.2.9 Intuitive Surgical Inc
- 16.2.9.1. Overview
- 16.2.9.2. Products
- 16.2.9.3. SWOT Analysis
- 16.2.9.4. Recent Developments
- 16.2.9.5. Financials (Based on Availability)
- 16.2.10 Johnson & Johnson Inc
- 16.2.10.1. Overview
- 16.2.10.2. Products
- 16.2.10.3. SWOT Analysis
- 16.2.10.4. Recent Developments
- 16.2.10.5. Financials (Based on Availability)
- 16.2.11 Stryker Corporation
- 16.2.11.1. Overview
- 16.2.11.2. Products
- 16.2.11.3. SWOT Analysis
- 16.2.11.4. Recent Developments
- 16.2.11.5. Financials (Based on Availability)
- 16.2.12 Olympus Corporation
- 16.2.12.1. Overview
- 16.2.12.2. Products
- 16.2.12.3. SWOT Analysis
- 16.2.12.4. Recent Developments
- 16.2.12.5. Financials (Based on Availability)
- 16.2.13 Zimmer Biomet Holdings Inc
- 16.2.13.1. Overview
- 16.2.13.2. Products
- 16.2.13.3. SWOT Analysis
- 16.2.13.4. Recent Developments
- 16.2.13.5. Financials (Based on Availability)
- 16.2.1 Steris
List of Figures
- Figure 1: Global Minimally Invasive Surgery Devices Industry Revenue Breakdown (Million, %) by Region 2024 & 2032
- Figure 2: North America Minimally Invasive Surgery Devices Industry Revenue (Million), by Country 2024 & 2032
- Figure 3: North America Minimally Invasive Surgery Devices Industry Revenue Share (%), by Country 2024 & 2032
- Figure 4: Europe Minimally Invasive Surgery Devices Industry Revenue (Million), by Country 2024 & 2032
- Figure 5: Europe Minimally Invasive Surgery Devices Industry Revenue Share (%), by Country 2024 & 2032
- Figure 6: Asia Pacific Minimally Invasive Surgery Devices Industry Revenue (Million), by Country 2024 & 2032
- Figure 7: Asia Pacific Minimally Invasive Surgery Devices Industry Revenue Share (%), by Country 2024 & 2032
- Figure 8: Middle East and Africa Minimally Invasive Surgery Devices Industry Revenue (Million), by Country 2024 & 2032
- Figure 9: Middle East and Africa Minimally Invasive Surgery Devices Industry Revenue Share (%), by Country 2024 & 2032
- Figure 10: South America Minimally Invasive Surgery Devices Industry Revenue (Million), by Country 2024 & 2032
- Figure 11: South America Minimally Invasive Surgery Devices Industry Revenue Share (%), by Country 2024 & 2032
- Figure 12: North America Minimally Invasive Surgery Devices Industry Revenue (Million), by Product 2024 & 2032
- Figure 13: North America Minimally Invasive Surgery Devices Industry Revenue Share (%), by Product 2024 & 2032
- Figure 14: North America Minimally Invasive Surgery Devices Industry Revenue (Million), by Application 2024 & 2032
- Figure 15: North America Minimally Invasive Surgery Devices Industry Revenue Share (%), by Application 2024 & 2032
- Figure 16: North America Minimally Invasive Surgery Devices Industry Revenue (Million), by Country 2024 & 2032
- Figure 17: North America Minimally Invasive Surgery Devices Industry Revenue Share (%), by Country 2024 & 2032
- Figure 18: Europe Minimally Invasive Surgery Devices Industry Revenue (Million), by Product 2024 & 2032
- Figure 19: Europe Minimally Invasive Surgery Devices Industry Revenue Share (%), by Product 2024 & 2032
- Figure 20: Europe Minimally Invasive Surgery Devices Industry Revenue (Million), by Application 2024 & 2032
- Figure 21: Europe Minimally Invasive Surgery Devices Industry Revenue Share (%), by Application 2024 & 2032
- Figure 22: Europe Minimally Invasive Surgery Devices Industry Revenue (Million), by Country 2024 & 2032
- Figure 23: Europe Minimally Invasive Surgery Devices Industry Revenue Share (%), by Country 2024 & 2032
- Figure 24: Asia Pacific Minimally Invasive Surgery Devices Industry Revenue (Million), by Product 2024 & 2032
- Figure 25: Asia Pacific Minimally Invasive Surgery Devices Industry Revenue Share (%), by Product 2024 & 2032
- Figure 26: Asia Pacific Minimally Invasive Surgery Devices Industry Revenue (Million), by Application 2024 & 2032
- Figure 27: Asia Pacific Minimally Invasive Surgery Devices Industry Revenue Share (%), by Application 2024 & 2032
- Figure 28: Asia Pacific Minimally Invasive Surgery Devices Industry Revenue (Million), by Country 2024 & 2032
- Figure 29: Asia Pacific Minimally Invasive Surgery Devices Industry Revenue Share (%), by Country 2024 & 2032
- Figure 30: Middle East and Africa Minimally Invasive Surgery Devices Industry Revenue (Million), by Product 2024 & 2032
- Figure 31: Middle East and Africa Minimally Invasive Surgery Devices Industry Revenue Share (%), by Product 2024 & 2032
- Figure 32: Middle East and Africa Minimally Invasive Surgery Devices Industry Revenue (Million), by Application 2024 & 2032
- Figure 33: Middle East and Africa Minimally Invasive Surgery Devices Industry Revenue Share (%), by Application 2024 & 2032
- Figure 34: Middle East and Africa Minimally Invasive Surgery Devices Industry Revenue (Million), by Country 2024 & 2032
- Figure 35: Middle East and Africa Minimally Invasive Surgery Devices Industry Revenue Share (%), by Country 2024 & 2032
- Figure 36: South America Minimally Invasive Surgery Devices Industry Revenue (Million), by Product 2024 & 2032
- Figure 37: South America Minimally Invasive Surgery Devices Industry Revenue Share (%), by Product 2024 & 2032
- Figure 38: South America Minimally Invasive Surgery Devices Industry Revenue (Million), by Application 2024 & 2032
- Figure 39: South America Minimally Invasive Surgery Devices Industry Revenue Share (%), by Application 2024 & 2032
- Figure 40: South America Minimally Invasive Surgery Devices Industry Revenue (Million), by Country 2024 & 2032
- Figure 41: South America Minimally Invasive Surgery Devices Industry Revenue Share (%), by Country 2024 & 2032
List of Tables
- Table 1: Global Minimally Invasive Surgery Devices Industry Revenue Million Forecast, by Region 2019 & 2032
- Table 2: Global Minimally Invasive Surgery Devices Industry Revenue Million Forecast, by Product 2019 & 2032
- Table 3: Global Minimally Invasive Surgery Devices Industry Revenue Million Forecast, by Application 2019 & 2032
- Table 4: Global Minimally Invasive Surgery Devices Industry Revenue Million Forecast, by Region 2019 & 2032
- Table 5: Global Minimally Invasive Surgery Devices Industry Revenue Million Forecast, by Country 2019 & 2032
- Table 6: United States Minimally Invasive Surgery Devices Industry Revenue (Million) Forecast, by Application 2019 & 2032
- Table 7: Canada Minimally Invasive Surgery Devices Industry Revenue (Million) Forecast, by Application 2019 & 2032
- Table 8: Mexico Minimally Invasive Surgery Devices Industry Revenue (Million) Forecast, by Application 2019 & 2032
- Table 9: Global Minimally Invasive Surgery Devices Industry Revenue Million Forecast, by Country 2019 & 2032
- Table 10: Germany Minimally Invasive Surgery Devices Industry Revenue (Million) Forecast, by Application 2019 & 2032
- Table 11: United Kingdom Minimally Invasive Surgery Devices Industry Revenue (Million) Forecast, by Application 2019 & 2032
- Table 12: France Minimally Invasive Surgery Devices Industry Revenue (Million) Forecast, by Application 2019 & 2032
- Table 13: Italy Minimally Invasive Surgery Devices Industry Revenue (Million) Forecast, by Application 2019 & 2032
- Table 14: Spain Minimally Invasive Surgery Devices Industry Revenue (Million) Forecast, by Application 2019 & 2032
- Table 15: Rest of Europe Minimally Invasive Surgery Devices Industry Revenue (Million) Forecast, by Application 2019 & 2032
- Table 16: Global Minimally Invasive Surgery Devices Industry Revenue Million Forecast, by Country 2019 & 2032
- Table 17: China Minimally Invasive Surgery Devices Industry Revenue (Million) Forecast, by Application 2019 & 2032
- Table 18: Japan Minimally Invasive Surgery Devices Industry Revenue (Million) Forecast, by Application 2019 & 2032
- Table 19: India Minimally Invasive Surgery Devices Industry Revenue (Million) Forecast, by Application 2019 & 2032
- Table 20: Australia Minimally Invasive Surgery Devices Industry Revenue (Million) Forecast, by Application 2019 & 2032
- Table 21: South Korea Minimally Invasive Surgery Devices Industry Revenue (Million) Forecast, by Application 2019 & 2032
- Table 22: Rest of Asia Pacific Minimally Invasive Surgery Devices Industry Revenue (Million) Forecast, by Application 2019 & 2032
- Table 23: Global Minimally Invasive Surgery Devices Industry Revenue Million Forecast, by Country 2019 & 2032
- Table 24: GCC Minimally Invasive Surgery Devices Industry Revenue (Million) Forecast, by Application 2019 & 2032
- Table 25: South Africa Minimally Invasive Surgery Devices Industry Revenue (Million) Forecast, by Application 2019 & 2032
- Table 26: Rest of Middle East and Africa Minimally Invasive Surgery Devices Industry Revenue (Million) Forecast, by Application 2019 & 2032
- Table 27: Global Minimally Invasive Surgery Devices Industry Revenue Million Forecast, by Country 2019 & 2032
- Table 28: Brazil Minimally Invasive Surgery Devices Industry Revenue (Million) Forecast, by Application 2019 & 2032
- Table 29: Argentina Minimally Invasive Surgery Devices Industry Revenue (Million) Forecast, by Application 2019 & 2032
- Table 30: Rest of South America Minimally Invasive Surgery Devices Industry Revenue (Million) Forecast, by Application 2019 & 2032
- Table 31: Global Minimally Invasive Surgery Devices Industry Revenue Million Forecast, by Product 2019 & 2032
- Table 32: Global Minimally Invasive Surgery Devices Industry Revenue Million Forecast, by Application 2019 & 2032
- Table 33: Global Minimally Invasive Surgery Devices Industry Revenue Million Forecast, by Country 2019 & 2032
- Table 34: United States Minimally Invasive Surgery Devices Industry Revenue (Million) Forecast, by Application 2019 & 2032
- Table 35: Canada Minimally Invasive Surgery Devices Industry Revenue (Million) Forecast, by Application 2019 & 2032
- Table 36: Mexico Minimally Invasive Surgery Devices Industry Revenue (Million) Forecast, by Application 2019 & 2032
- Table 37: Global Minimally Invasive Surgery Devices Industry Revenue Million Forecast, by Product 2019 & 2032
- Table 38: Global Minimally Invasive Surgery Devices Industry Revenue Million Forecast, by Application 2019 & 2032
- Table 39: Global Minimally Invasive Surgery Devices Industry Revenue Million Forecast, by Country 2019 & 2032
- Table 40: Germany Minimally Invasive Surgery Devices Industry Revenue (Million) Forecast, by Application 2019 & 2032
- Table 41: United Kingdom Minimally Invasive Surgery Devices Industry Revenue (Million) Forecast, by Application 2019 & 2032
- Table 42: France Minimally Invasive Surgery Devices Industry Revenue (Million) Forecast, by Application 2019 & 2032
- Table 43: Italy Minimally Invasive Surgery Devices Industry Revenue (Million) Forecast, by Application 2019 & 2032
- Table 44: Spain Minimally Invasive Surgery Devices Industry Revenue (Million) Forecast, by Application 2019 & 2032
- Table 45: Rest of Europe Minimally Invasive Surgery Devices Industry Revenue (Million) Forecast, by Application 2019 & 2032
- Table 46: Global Minimally Invasive Surgery Devices Industry Revenue Million Forecast, by Product 2019 & 2032
- Table 47: Global Minimally Invasive Surgery Devices Industry Revenue Million Forecast, by Application 2019 & 2032
- Table 48: Global Minimally Invasive Surgery Devices Industry Revenue Million Forecast, by Country 2019 & 2032
- Table 49: China Minimally Invasive Surgery Devices Industry Revenue (Million) Forecast, by Application 2019 & 2032
- Table 50: Japan Minimally Invasive Surgery Devices Industry Revenue (Million) Forecast, by Application 2019 & 2032
- Table 51: India Minimally Invasive Surgery Devices Industry Revenue (Million) Forecast, by Application 2019 & 2032
- Table 52: Australia Minimally Invasive Surgery Devices Industry Revenue (Million) Forecast, by Application 2019 & 2032
- Table 53: South Korea Minimally Invasive Surgery Devices Industry Revenue (Million) Forecast, by Application 2019 & 2032
- Table 54: Rest of Asia Pacific Minimally Invasive Surgery Devices Industry Revenue (Million) Forecast, by Application 2019 & 2032
- Table 55: Global Minimally Invasive Surgery Devices Industry Revenue Million Forecast, by Product 2019 & 2032
- Table 56: Global Minimally Invasive Surgery Devices Industry Revenue Million Forecast, by Application 2019 & 2032
- Table 57: Global Minimally Invasive Surgery Devices Industry Revenue Million Forecast, by Country 2019 & 2032
- Table 58: GCC Minimally Invasive Surgery Devices Industry Revenue (Million) Forecast, by Application 2019 & 2032
- Table 59: South Africa Minimally Invasive Surgery Devices Industry Revenue (Million) Forecast, by Application 2019 & 2032
- Table 60: Rest of Middle East and Africa Minimally Invasive Surgery Devices Industry Revenue (Million) Forecast, by Application 2019 & 2032
- Table 61: Global Minimally Invasive Surgery Devices Industry Revenue Million Forecast, by Product 2019 & 2032
- Table 62: Global Minimally Invasive Surgery Devices Industry Revenue Million Forecast, by Application 2019 & 2032
- Table 63: Global Minimally Invasive Surgery Devices Industry Revenue Million Forecast, by Country 2019 & 2032
- Table 64: Brazil Minimally Invasive Surgery Devices Industry Revenue (Million) Forecast, by Application 2019 & 2032
- Table 65: Argentina Minimally Invasive Surgery Devices Industry Revenue (Million) Forecast, by Application 2019 & 2032
- Table 66: Rest of South America Minimally Invasive Surgery Devices Industry Revenue (Million) Forecast, by Application 2019 & 2032
Frequently Asked Questions
1. What is the projected Compound Annual Growth Rate (CAGR) of the Minimally Invasive Surgery Devices Industry?
The projected CAGR is approximately 6.59%.
2. Which companies are prominent players in the Minimally Invasive Surgery Devices Industry?
Key companies in the market include Steris, Renishaw PLC, HOYA Corporation (Microline Surgical), Abbott Laboratories, Medtronic PLC, Boston Scientific, CONMED Corporation*List Not Exhaustive, Koninklijke Philips NV, Intuitive Surgical Inc, Johnson & Johnson Inc, Stryker Corporation, Olympus Corporation, Zimmer Biomet Holdings Inc.
3. What are the main segments of the Minimally Invasive Surgery Devices Industry?
The market segments include Product, Application.
4. Can you provide details about the market size?
The market size is estimated to be USD 34.24 Million as of 2022.
5. What are some drivers contributing to market growth?
Higher Acceptance Rate of Minimally Invasive Surgeries Over Traditional Surgeries; Increasing Prevalence of Lifestyle-related and Chronic Disorders; Growing Technological Advancements.
6. What are the notable trends driving market growth?
Endoscopic Devices is Expected to be the Fastest-growing Segment During the Forecast Period.
7. Are there any restraints impacting market growth?
Shortage of Experienced Professionals; Uncertain Regulatory Framework.
8. Can you provide examples of recent developments in the market?
In January 2023, PENTAX Medical obtained CE marks for its PENTAX Medical INSPIRA, the new premium video processor, and the i20c video endoscope series. The new video processor maintains compatibility with PENTAX Medical's recent endoscope models and sets new standards with the new i20c video endoscope generation.
9. What pricing options are available for accessing the report?
Pricing options include single-user, multi-user, and enterprise licenses priced at USD 4750, USD 5250, and USD 8750 respectively.
10. Is the market size provided in terms of value or volume?
The market size is provided in terms of value, measured in Million.
11. Are there any specific market keywords associated with the report?
Yes, the market keyword associated with the report is "Minimally Invasive Surgery Devices Industry," which aids in identifying and referencing the specific market segment covered.
12. How do I determine which pricing option suits my needs best?
The pricing options vary based on user requirements and access needs. Individual users may opt for single-user licenses, while businesses requiring broader access may choose multi-user or enterprise licenses for cost-effective access to the report.
13. Are there any additional resources or data provided in the Minimally Invasive Surgery Devices Industry report?
While the report offers comprehensive insights, it's advisable to review the specific contents or supplementary materials provided to ascertain if additional resources or data are available.
14. How can I stay updated on further developments or reports in the Minimally Invasive Surgery Devices Industry?
To stay informed about further developments, trends, and reports in the Minimally Invasive Surgery Devices Industry, consider subscribing to industry newsletters, following relevant companies and organizations, or regularly checking reputable industry news sources and publications.
Methodology
Step 1 - Identification of Relevant Samples Size from Population Database


Step 2 - Approaches for Defining Global Market Size (Value, Volume* & Price*)

Note*: In applicable scenarios
Step 3 - Data Sources
Primary Research
- Web Analytics
- Survey Reports
- Research Institute
- Latest Research Reports
- Opinion Leaders
Secondary Research
- Annual Reports
- White Paper
- Latest Press Release
- Industry Association
- Paid Database
- Investor Presentations

Step 4 - Data Triangulation
Involves using different sources of information in order to increase the validity of a study
These sources are likely to be stakeholders in a program - participants, other researchers, program staff, other community members, and so on.
Then we put all data in single framework & apply various statistical tools to find out the dynamic on the market.
During the analysis stage, feedback from the stakeholder groups would be compared to determine areas of agreement as well as areas of divergence
