

Key Insights
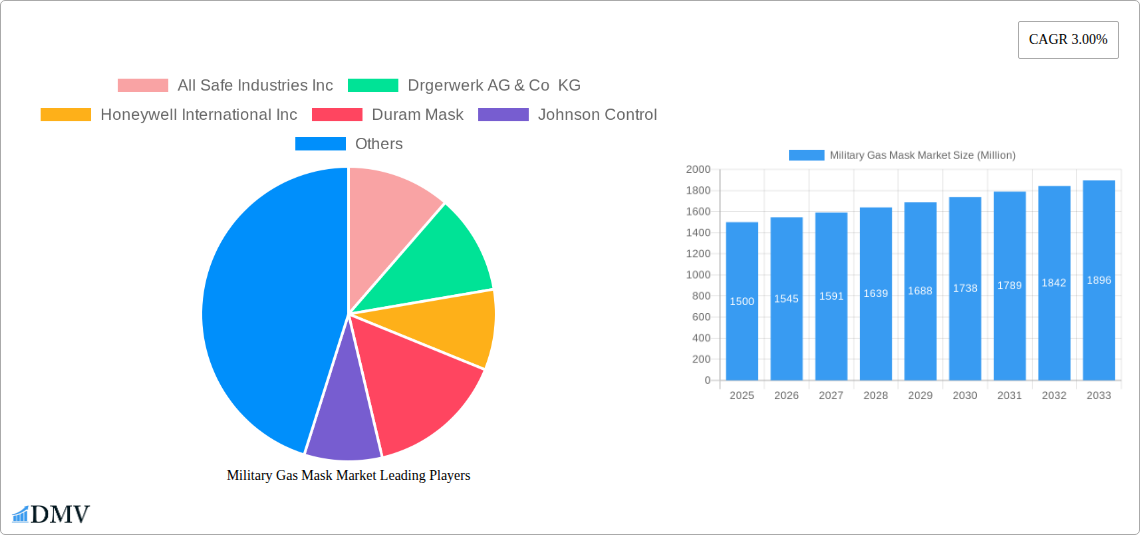
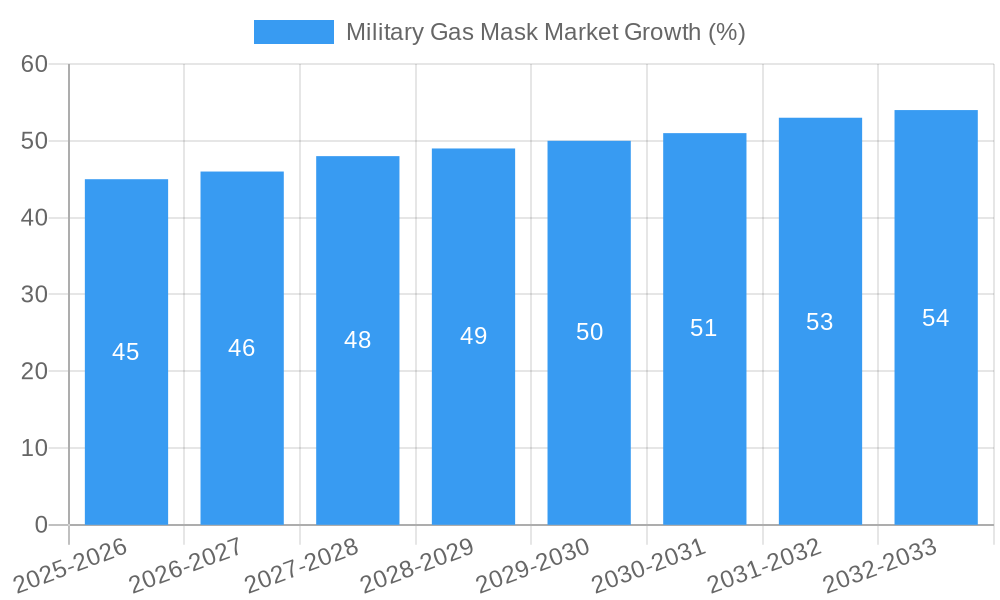
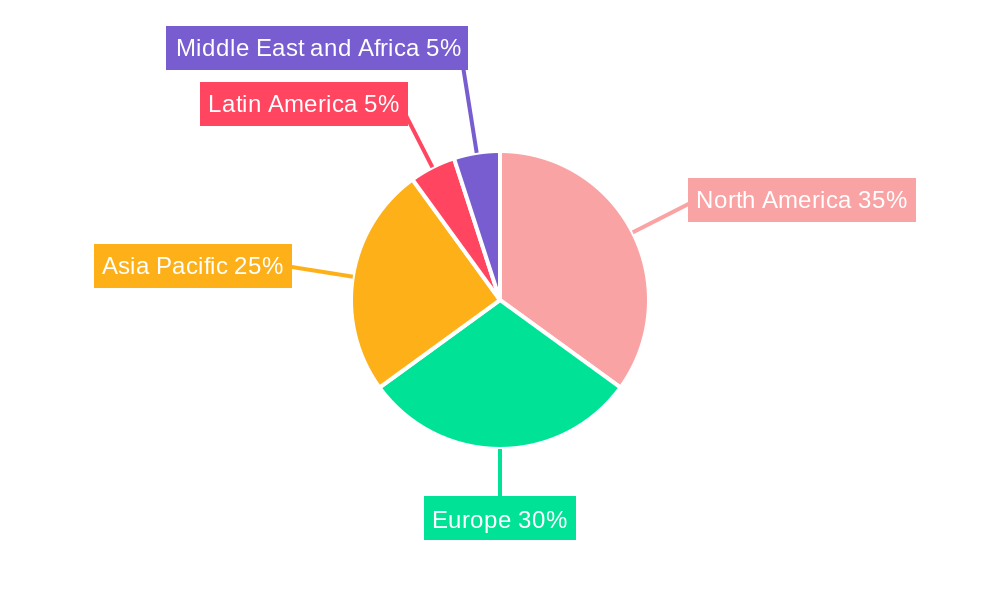
The global military gas mask market, valued at approximately $1.5 billion in 2025, is projected to experience steady growth, driven by a compound annual growth rate (CAGR) of 3.00% from 2025 to 2033. This expansion is fueled by several key factors. Firstly, escalating geopolitical tensions and the ongoing need for enhanced military preparedness across numerous nations are significantly increasing demand for advanced gas masks. Technological advancements in respirator design, incorporating improved filtration systems, enhanced comfort features, and integration with other protective gear, are driving market growth. The increasing prevalence of chemical and biological warfare threats, coupled with stricter regulations and safety standards imposed by governments worldwide, further bolster the adoption of sophisticated military gas masks. Furthermore, the market is segmented into various types, including full-face and half-face gas masks, and diverse product categories like non-powered and powered respirators, catering to specialized military needs. The end-user segment includes military personnel, first responders, and specialized units requiring enhanced protection against chemical, biological, radiological, and nuclear (CBRN) threats. North America and Europe are currently leading the market due to substantial military spending and advanced technological capabilities in these regions, though Asia-Pacific is expected to exhibit strong growth potential driven by increasing military modernization efforts.
The competitive landscape is characterized by a mix of established players like 3M, Honeywell International Inc., and MSA Safety Incorporated, alongside several specialized regional manufacturers. These companies are actively engaged in research and development, focusing on innovation to improve product performance, durability, and user comfort. Strategic partnerships, acquisitions, and expansion into emerging markets are key strategies adopted by market players to strengthen their position. The restraints on market growth primarily include the high cost associated with advanced gas masks, potential supply chain disruptions, and the cyclical nature of military spending. However, the long-term outlook for the military gas mask market remains positive, with continuous demand driven by global security concerns and technological advancements promising even more sophisticated protective equipment.
Military Gas Mask Market: A Comprehensive Report (2019-2033)
This insightful report provides a detailed analysis of the global Military Gas Mask Market, offering a comprehensive overview of market trends, leading players, and future growth prospects. The study covers the period from 2019 to 2033, with 2025 serving as the base and estimated year. The market is segmented by mask type (full-face and half-face gas masks), product type (non-powered and powered respirators), and end-user (military and first responders). The report projects a market valued at xx Million by 2033, showcasing significant growth potential.
Military Gas Mask Market Composition & Trends
This section dives deep into the competitive landscape of the Military Gas Mask Market, analyzing market concentration, innovation drivers, regulatory influences, and the impact of substitute products. We examine the evolving end-user profiles and the role of mergers and acquisitions (M&A) in shaping market dynamics. The report includes a detailed analysis of market share distribution among key players, revealing the dominance of established players like 3M and MSA Safety Incorporated. M&A activity, impacting market consolidation and innovation, is assessed, with projected deal values exceeding xx Million during the forecast period.
- Market Concentration: High, with a few major players holding significant market share.
- Innovation Catalysts: Advancements in filter technology, materials science, and ergonomic design.
- Regulatory Landscape: Stringent safety and performance standards influence market growth.
- Substitute Products: Limited, with specialized protective equipment offering niche competition.
- End-User Profiles: Shifting military modernization strategies and evolving first responder requirements drive market demand.
- M&A Activity: Consolidation efforts by major players to expand market reach and product portfolios.
Military Gas Mask Market Industry Evolution
This section traces the evolution of the Military Gas Mask Market, outlining growth trajectories, technological progress, and the shifting demands of end-users. We analyze historical data (2019-2024) and project future trends (2025-2033), providing specific data points on market growth rates and adoption metrics for various gas mask types and respirator technologies. The market experienced a Compound Annual Growth Rate (CAGR) of xx% during the historical period, driven by increased defense spending and heightened awareness of respiratory hazards. Technological advancements, particularly in filtration efficiency and comfort features, are projected to accelerate growth in the forecast period. The increasing adoption of powered respirators within military applications is another key element driving the market expansion. The market is also expected to witness significant growth driven by government initiatives to modernize military equipment and enhance preparedness for chemical, biological, radiological, and nuclear (CBRN) threats.
Leading Regions, Countries, or Segments in Military Gas Mask Market
This section identifies the leading regions, countries, and market segments within the Military Gas Mask Market. North America and Europe currently dominate, driven by robust defense budgets and stringent safety regulations. However, the Asia-Pacific region is poised for significant growth fueled by increasing defense spending and rising awareness of CBRN threats. The full-face gas mask segment holds the largest market share, reflecting the need for comprehensive respiratory protection in demanding military operations. Similarly, powered respirators are witnessing accelerated growth due to their enhanced performance and ease of use.
- Key Drivers (North America): High defense expenditure, stringent regulatory frameworks, established supply chains.
- Key Drivers (Europe): Strong defense capabilities, investment in advanced respiratory protection technologies.
- Key Drivers (Asia-Pacific): Increasing defense budgets, rising awareness of CBRN threats, modernization of military equipment.
- Full-Face Gas Mask Dominance: Superior protection and wider application in diverse military scenarios.
- Powered Respirator Growth: Enhanced performance and ease of use, particularly in high-intensity operations.
Military Gas Mask Market Product Innovations
Recent innovations have focused on enhancing filter efficiency, improving wearer comfort, and incorporating advanced technologies like integrated communication systems. Lightweight materials, improved sealing mechanisms, and advanced filter media are key aspects of these innovations. The integration of smart sensors to monitor environmental conditions and filter saturation is also gaining traction, ensuring improved safety and operational efficiency.
Propelling Factors for Military Gas Mask Market Growth
The Military Gas Mask Market is driven by several factors. Firstly, increased defense spending globally fuels demand for advanced respiratory protection equipment. Secondly, the growing threat of chemical, biological, radiological, and nuclear (CBRN) warfare necessitates robust protective measures. Thirdly, stricter safety regulations concerning respiratory protection in military operations propel market growth. Finally, technological advancements lead to improved product performance and functionalities, further stimulating market demand.
Obstacles in the Military Gas Mask Market
Challenges include supply chain disruptions, potentially impacting production and delivery timelines. Fluctuations in raw material prices can affect product costs and market profitability. The stringent regulatory compliance requirements add to the manufacturing and operational complexities for companies. Furthermore, intense competition among established players presents a considerable hurdle.
Future Opportunities in Military Gas Mask Market
Emerging opportunities lie in developing lightweight and comfortable masks incorporating advanced filtration technologies. The integration of smart sensors and communication systems offers significant potential for future growth. Expanding into new markets, particularly in developing nations, presents another avenue for market expansion. Finally, personalized protective equipment based on individual soldier profiles can create new market segments.
Major Players in the Military Gas Mask Market Ecosystem
- All Safe Industries Inc
- Drägerwerk AG & Co KGaA
- Honeywell International Inc
- Duram Mask
- Johnson Control
- MSA Safety Incorporated
- 3M
- Metadure Parts & Sales Inc
- Nexter Group
- Shalon Chemical Industries Ltd
- TSI Incorporate
- Avon Protection plc
Key Developments in Military Gas Mask Market Industry
- 2023-03: MSA Safety Incorporated launched a new line of advanced filtration masks for military applications.
- 2022-11: 3M acquired a smaller competitor, strengthening its market position.
- 2021-09: Drägerwerk AG & Co KGaA invested significantly in R&D for next-generation gas mask technologies.
Strategic Military Gas Mask Market Forecast
The Military Gas Mask Market is poised for continued growth, driven by technological innovations, rising defense budgets, and the persistent threat of CBRN warfare. Emerging markets and the demand for advanced features, like integrated communication and smart sensors, will further drive market expansion. The market is expected to see a robust CAGR of xx% during the forecast period (2025-2033), reaching a valuation of xx Million.
Military Gas Mask Market Segmentation
-
1. Mask Type
- 1.1. Full-face Gas Mask
- 1.2. Half-face Gas Mask
-
2. Product Type
- 2.1. Non-powered Respirators
- 2.2. Powered Respirators
-
3. End User
- 3.1. Military
- 3.2. First Responders
Military Gas Mask Market Segmentation By Geography
-
1. North America
- 1.1. United States
- 1.2. Canada
-
2. Europe
- 2.1. Germany
- 2.2. United Kingdom
- 2.3. France
- 2.4. Russia
- 2.5. Rest of Europe
-
3. Asia Pacific
- 3.1. China
- 3.2. Japan
- 3.3. India
- 3.4. Rest of Asia Pacific
-
4. Latin America
- 4.1. Brazil
- 4.2. Mexico
- 4.3. Rest of Latin America
-
5. Middle East and Africa
- 5.1. Saudi Arabia
- 5.2. United Arab Emirates
- 5.3. Kuwait
- 5.4. Rest of Middle East and Africa
Military Gas Mask Market REPORT HIGHLIGHTS
| Aspects | Details |
|---|---|
| Study Period | 2019-2033 |
| Base Year | 2024 |
| Estimated Year | 2025 |
| Forecast Period | 2025-2033 |
| Historical Period | 2019-2024 |
| Growth Rate | CAGR of 3.00% from 2019-2033 |
| Segmentation |
|
Table of Contents
- 1. Introduction
- 1.1. Research Scope
- 1.2. Market Segmentation
- 1.3. Research Methodology
- 1.4. Definitions and Assumptions
- 2. Executive Summary
- 2.1. Introduction
- 3. Market Dynamics
- 3.1. Introduction
- 3.2. Market Drivers
- 3.3. Market Restrains
- 3.4. Market Trends
- 3.4.1. The Full-Face Gas Mask Segment Is Expected To Witness A Significant Growth During The Forecast Period.
- 4. Market Factor Analysis
- 4.1. Porters Five Forces
- 4.2. Supply/Value Chain
- 4.3. PESTEL analysis
- 4.4. Market Entropy
- 4.5. Patent/Trademark Analysis
- 5. Global Military Gas Mask Market Analysis, Insights and Forecast, 2019-2031
- 5.1. Market Analysis, Insights and Forecast - by Mask Type
- 5.1.1. Full-face Gas Mask
- 5.1.2. Half-face Gas Mask
- 5.2. Market Analysis, Insights and Forecast - by Product Type
- 5.2.1. Non-powered Respirators
- 5.2.2. Powered Respirators
- 5.3. Market Analysis, Insights and Forecast - by End User
- 5.3.1. Military
- 5.3.2. First Responders
- 5.4. Market Analysis, Insights and Forecast - by Region
- 5.4.1. North America
- 5.4.2. Europe
- 5.4.3. Asia Pacific
- 5.4.4. Latin America
- 5.4.5. Middle East and Africa
- 5.1. Market Analysis, Insights and Forecast - by Mask Type
- 6. North America Military Gas Mask Market Analysis, Insights and Forecast, 2019-2031
- 6.1. Market Analysis, Insights and Forecast - by Mask Type
- 6.1.1. Full-face Gas Mask
- 6.1.2. Half-face Gas Mask
- 6.2. Market Analysis, Insights and Forecast - by Product Type
- 6.2.1. Non-powered Respirators
- 6.2.2. Powered Respirators
- 6.3. Market Analysis, Insights and Forecast - by End User
- 6.3.1. Military
- 6.3.2. First Responders
- 6.1. Market Analysis, Insights and Forecast - by Mask Type
- 7. Europe Military Gas Mask Market Analysis, Insights and Forecast, 2019-2031
- 7.1. Market Analysis, Insights and Forecast - by Mask Type
- 7.1.1. Full-face Gas Mask
- 7.1.2. Half-face Gas Mask
- 7.2. Market Analysis, Insights and Forecast - by Product Type
- 7.2.1. Non-powered Respirators
- 7.2.2. Powered Respirators
- 7.3. Market Analysis, Insights and Forecast - by End User
- 7.3.1. Military
- 7.3.2. First Responders
- 7.1. Market Analysis, Insights and Forecast - by Mask Type
- 8. Asia Pacific Military Gas Mask Market Analysis, Insights and Forecast, 2019-2031
- 8.1. Market Analysis, Insights and Forecast - by Mask Type
- 8.1.1. Full-face Gas Mask
- 8.1.2. Half-face Gas Mask
- 8.2. Market Analysis, Insights and Forecast - by Product Type
- 8.2.1. Non-powered Respirators
- 8.2.2. Powered Respirators
- 8.3. Market Analysis, Insights and Forecast - by End User
- 8.3.1. Military
- 8.3.2. First Responders
- 8.1. Market Analysis, Insights and Forecast - by Mask Type
- 9. Latin America Military Gas Mask Market Analysis, Insights and Forecast, 2019-2031
- 9.1. Market Analysis, Insights and Forecast - by Mask Type
- 9.1.1. Full-face Gas Mask
- 9.1.2. Half-face Gas Mask
- 9.2. Market Analysis, Insights and Forecast - by Product Type
- 9.2.1. Non-powered Respirators
- 9.2.2. Powered Respirators
- 9.3. Market Analysis, Insights and Forecast - by End User
- 9.3.1. Military
- 9.3.2. First Responders
- 9.1. Market Analysis, Insights and Forecast - by Mask Type
- 10. Middle East and Africa Military Gas Mask Market Analysis, Insights and Forecast, 2019-2031
- 10.1. Market Analysis, Insights and Forecast - by Mask Type
- 10.1.1. Full-face Gas Mask
- 10.1.2. Half-face Gas Mask
- 10.2. Market Analysis, Insights and Forecast - by Product Type
- 10.2.1. Non-powered Respirators
- 10.2.2. Powered Respirators
- 10.3. Market Analysis, Insights and Forecast - by End User
- 10.3.1. Military
- 10.3.2. First Responders
- 10.1. Market Analysis, Insights and Forecast - by Mask Type
- 11. North America Military Gas Mask Market Analysis, Insights and Forecast, 2019-2031
- 11.1. Market Analysis, Insights and Forecast - By Country/Sub-region
- 11.1.1 United States
- 11.1.2 Canada
- 12. Europe Military Gas Mask Market Analysis, Insights and Forecast, 2019-2031
- 12.1. Market Analysis, Insights and Forecast - By Country/Sub-region
- 12.1.1 Germany
- 12.1.2 United Kingdom
- 12.1.3 France
- 12.1.4 Russia
- 12.1.5 Rest of Europe
- 13. Asia Pacific Military Gas Mask Market Analysis, Insights and Forecast, 2019-2031
- 13.1. Market Analysis, Insights and Forecast - By Country/Sub-region
- 13.1.1 China
- 13.1.2 Japan
- 13.1.3 India
- 13.1.4 Rest of Asia Pacific
- 14. Latin America Military Gas Mask Market Analysis, Insights and Forecast, 2019-2031
- 14.1. Market Analysis, Insights and Forecast - By Country/Sub-region
- 14.1.1 Brazil
- 14.1.2 Mexico
- 14.1.3 Rest of Latin America
- 15. Middle East and Africa Military Gas Mask Market Analysis, Insights and Forecast, 2019-2031
- 15.1. Market Analysis, Insights and Forecast - By Country/Sub-region
- 15.1.1 Saudi Arabia
- 15.1.2 United Arab Emirates
- 15.1.3 Kuwait
- 15.1.4 Rest of Middle East and Africa
- 16. Competitive Analysis
- 16.1. Global Market Share Analysis 2024
- 16.2. Company Profiles
- 16.2.1 All Safe Industries Inc
- 16.2.1.1. Overview
- 16.2.1.2. Products
- 16.2.1.3. SWOT Analysis
- 16.2.1.4. Recent Developments
- 16.2.1.5. Financials (Based on Availability)
- 16.2.2 Drgerwerk AG & Co KG
- 16.2.2.1. Overview
- 16.2.2.2. Products
- 16.2.2.3. SWOT Analysis
- 16.2.2.4. Recent Developments
- 16.2.2.5. Financials (Based on Availability)
- 16.2.3 Honeywell International Inc
- 16.2.3.1. Overview
- 16.2.3.2. Products
- 16.2.3.3. SWOT Analysis
- 16.2.3.4. Recent Developments
- 16.2.3.5. Financials (Based on Availability)
- 16.2.4 Duram Mask
- 16.2.4.1. Overview
- 16.2.4.2. Products
- 16.2.4.3. SWOT Analysis
- 16.2.4.4. Recent Developments
- 16.2.4.5. Financials (Based on Availability)
- 16.2.5 Johnson Control
- 16.2.5.1. Overview
- 16.2.5.2. Products
- 16.2.5.3. SWOT Analysis
- 16.2.5.4. Recent Developments
- 16.2.5.5. Financials (Based on Availability)
- 16.2.6 MSA Safety Incorporated
- 16.2.6.1. Overview
- 16.2.6.2. Products
- 16.2.6.3. SWOT Analysis
- 16.2.6.4. Recent Developments
- 16.2.6.5. Financials (Based on Availability)
- 16.2.7 3M
- 16.2.7.1. Overview
- 16.2.7.2. Products
- 16.2.7.3. SWOT Analysis
- 16.2.7.4. Recent Developments
- 16.2.7.5. Financials (Based on Availability)
- 16.2.8 Metadure Parts & Sales Inc
- 16.2.8.1. Overview
- 16.2.8.2. Products
- 16.2.8.3. SWOT Analysis
- 16.2.8.4. Recent Developments
- 16.2.8.5. Financials (Based on Availability)
- 16.2.9 Nexter Group
- 16.2.9.1. Overview
- 16.2.9.2. Products
- 16.2.9.3. SWOT Analysis
- 16.2.9.4. Recent Developments
- 16.2.9.5. Financials (Based on Availability)
- 16.2.10 Shalon Chemical Industries Ltd
- 16.2.10.1. Overview
- 16.2.10.2. Products
- 16.2.10.3. SWOT Analysis
- 16.2.10.4. Recent Developments
- 16.2.10.5. Financials (Based on Availability)
- 16.2.11 TSI Incorporate
- 16.2.11.1. Overview
- 16.2.11.2. Products
- 16.2.11.3. SWOT Analysis
- 16.2.11.4. Recent Developments
- 16.2.11.5. Financials (Based on Availability)
- 16.2.12 Avon Protection plc
- 16.2.12.1. Overview
- 16.2.12.2. Products
- 16.2.12.3. SWOT Analysis
- 16.2.12.4. Recent Developments
- 16.2.12.5. Financials (Based on Availability)
- 16.2.1 All Safe Industries Inc
List of Figures
- Figure 1: Global Military Gas Mask Market Revenue Breakdown (Million, %) by Region 2024 & 2032
- Figure 2: North America Military Gas Mask Market Revenue (Million), by Country 2024 & 2032
- Figure 3: North America Military Gas Mask Market Revenue Share (%), by Country 2024 & 2032
- Figure 4: Europe Military Gas Mask Market Revenue (Million), by Country 2024 & 2032
- Figure 5: Europe Military Gas Mask Market Revenue Share (%), by Country 2024 & 2032
- Figure 6: Asia Pacific Military Gas Mask Market Revenue (Million), by Country 2024 & 2032
- Figure 7: Asia Pacific Military Gas Mask Market Revenue Share (%), by Country 2024 & 2032
- Figure 8: Latin America Military Gas Mask Market Revenue (Million), by Country 2024 & 2032
- Figure 9: Latin America Military Gas Mask Market Revenue Share (%), by Country 2024 & 2032
- Figure 10: Middle East and Africa Military Gas Mask Market Revenue (Million), by Country 2024 & 2032
- Figure 11: Middle East and Africa Military Gas Mask Market Revenue Share (%), by Country 2024 & 2032
- Figure 12: North America Military Gas Mask Market Revenue (Million), by Mask Type 2024 & 2032
- Figure 13: North America Military Gas Mask Market Revenue Share (%), by Mask Type 2024 & 2032
- Figure 14: North America Military Gas Mask Market Revenue (Million), by Product Type 2024 & 2032
- Figure 15: North America Military Gas Mask Market Revenue Share (%), by Product Type 2024 & 2032
- Figure 16: North America Military Gas Mask Market Revenue (Million), by End User 2024 & 2032
- Figure 17: North America Military Gas Mask Market Revenue Share (%), by End User 2024 & 2032
- Figure 18: North America Military Gas Mask Market Revenue (Million), by Country 2024 & 2032
- Figure 19: North America Military Gas Mask Market Revenue Share (%), by Country 2024 & 2032
- Figure 20: Europe Military Gas Mask Market Revenue (Million), by Mask Type 2024 & 2032
- Figure 21: Europe Military Gas Mask Market Revenue Share (%), by Mask Type 2024 & 2032
- Figure 22: Europe Military Gas Mask Market Revenue (Million), by Product Type 2024 & 2032
- Figure 23: Europe Military Gas Mask Market Revenue Share (%), by Product Type 2024 & 2032
- Figure 24: Europe Military Gas Mask Market Revenue (Million), by End User 2024 & 2032
- Figure 25: Europe Military Gas Mask Market Revenue Share (%), by End User 2024 & 2032
- Figure 26: Europe Military Gas Mask Market Revenue (Million), by Country 2024 & 2032
- Figure 27: Europe Military Gas Mask Market Revenue Share (%), by Country 2024 & 2032
- Figure 28: Asia Pacific Military Gas Mask Market Revenue (Million), by Mask Type 2024 & 2032
- Figure 29: Asia Pacific Military Gas Mask Market Revenue Share (%), by Mask Type 2024 & 2032
- Figure 30: Asia Pacific Military Gas Mask Market Revenue (Million), by Product Type 2024 & 2032
- Figure 31: Asia Pacific Military Gas Mask Market Revenue Share (%), by Product Type 2024 & 2032
- Figure 32: Asia Pacific Military Gas Mask Market Revenue (Million), by End User 2024 & 2032
- Figure 33: Asia Pacific Military Gas Mask Market Revenue Share (%), by End User 2024 & 2032
- Figure 34: Asia Pacific Military Gas Mask Market Revenue (Million), by Country 2024 & 2032
- Figure 35: Asia Pacific Military Gas Mask Market Revenue Share (%), by Country 2024 & 2032
- Figure 36: Latin America Military Gas Mask Market Revenue (Million), by Mask Type 2024 & 2032
- Figure 37: Latin America Military Gas Mask Market Revenue Share (%), by Mask Type 2024 & 2032
- Figure 38: Latin America Military Gas Mask Market Revenue (Million), by Product Type 2024 & 2032
- Figure 39: Latin America Military Gas Mask Market Revenue Share (%), by Product Type 2024 & 2032
- Figure 40: Latin America Military Gas Mask Market Revenue (Million), by End User 2024 & 2032
- Figure 41: Latin America Military Gas Mask Market Revenue Share (%), by End User 2024 & 2032
- Figure 42: Latin America Military Gas Mask Market Revenue (Million), by Country 2024 & 2032
- Figure 43: Latin America Military Gas Mask Market Revenue Share (%), by Country 2024 & 2032
- Figure 44: Middle East and Africa Military Gas Mask Market Revenue (Million), by Mask Type 2024 & 2032
- Figure 45: Middle East and Africa Military Gas Mask Market Revenue Share (%), by Mask Type 2024 & 2032
- Figure 46: Middle East and Africa Military Gas Mask Market Revenue (Million), by Product Type 2024 & 2032
- Figure 47: Middle East and Africa Military Gas Mask Market Revenue Share (%), by Product Type 2024 & 2032
- Figure 48: Middle East and Africa Military Gas Mask Market Revenue (Million), by End User 2024 & 2032
- Figure 49: Middle East and Africa Military Gas Mask Market Revenue Share (%), by End User 2024 & 2032
- Figure 50: Middle East and Africa Military Gas Mask Market Revenue (Million), by Country 2024 & 2032
- Figure 51: Middle East and Africa Military Gas Mask Market Revenue Share (%), by Country 2024 & 2032
List of Tables
- Table 1: Global Military Gas Mask Market Revenue Million Forecast, by Region 2019 & 2032
- Table 2: Global Military Gas Mask Market Revenue Million Forecast, by Mask Type 2019 & 2032
- Table 3: Global Military Gas Mask Market Revenue Million Forecast, by Product Type 2019 & 2032
- Table 4: Global Military Gas Mask Market Revenue Million Forecast, by End User 2019 & 2032
- Table 5: Global Military Gas Mask Market Revenue Million Forecast, by Region 2019 & 2032
- Table 6: Global Military Gas Mask Market Revenue Million Forecast, by Country 2019 & 2032
- Table 7: United States Military Gas Mask Market Revenue (Million) Forecast, by Application 2019 & 2032
- Table 8: Canada Military Gas Mask Market Revenue (Million) Forecast, by Application 2019 & 2032
- Table 9: Global Military Gas Mask Market Revenue Million Forecast, by Country 2019 & 2032
- Table 10: Germany Military Gas Mask Market Revenue (Million) Forecast, by Application 2019 & 2032
- Table 11: United Kingdom Military Gas Mask Market Revenue (Million) Forecast, by Application 2019 & 2032
- Table 12: France Military Gas Mask Market Revenue (Million) Forecast, by Application 2019 & 2032
- Table 13: Russia Military Gas Mask Market Revenue (Million) Forecast, by Application 2019 & 2032
- Table 14: Rest of Europe Military Gas Mask Market Revenue (Million) Forecast, by Application 2019 & 2032
- Table 15: Global Military Gas Mask Market Revenue Million Forecast, by Country 2019 & 2032
- Table 16: China Military Gas Mask Market Revenue (Million) Forecast, by Application 2019 & 2032
- Table 17: Japan Military Gas Mask Market Revenue (Million) Forecast, by Application 2019 & 2032
- Table 18: India Military Gas Mask Market Revenue (Million) Forecast, by Application 2019 & 2032
- Table 19: Rest of Asia Pacific Military Gas Mask Market Revenue (Million) Forecast, by Application 2019 & 2032
- Table 20: Global Military Gas Mask Market Revenue Million Forecast, by Country 2019 & 2032
- Table 21: Brazil Military Gas Mask Market Revenue (Million) Forecast, by Application 2019 & 2032
- Table 22: Mexico Military Gas Mask Market Revenue (Million) Forecast, by Application 2019 & 2032
- Table 23: Rest of Latin America Military Gas Mask Market Revenue (Million) Forecast, by Application 2019 & 2032
- Table 24: Global Military Gas Mask Market Revenue Million Forecast, by Country 2019 & 2032
- Table 25: Saudi Arabia Military Gas Mask Market Revenue (Million) Forecast, by Application 2019 & 2032
- Table 26: United Arab Emirates Military Gas Mask Market Revenue (Million) Forecast, by Application 2019 & 2032
- Table 27: Kuwait Military Gas Mask Market Revenue (Million) Forecast, by Application 2019 & 2032
- Table 28: Rest of Middle East and Africa Military Gas Mask Market Revenue (Million) Forecast, by Application 2019 & 2032
- Table 29: Global Military Gas Mask Market Revenue Million Forecast, by Mask Type 2019 & 2032
- Table 30: Global Military Gas Mask Market Revenue Million Forecast, by Product Type 2019 & 2032
- Table 31: Global Military Gas Mask Market Revenue Million Forecast, by End User 2019 & 2032
- Table 32: Global Military Gas Mask Market Revenue Million Forecast, by Country 2019 & 2032
- Table 33: United States Military Gas Mask Market Revenue (Million) Forecast, by Application 2019 & 2032
- Table 34: Canada Military Gas Mask Market Revenue (Million) Forecast, by Application 2019 & 2032
- Table 35: Global Military Gas Mask Market Revenue Million Forecast, by Mask Type 2019 & 2032
- Table 36: Global Military Gas Mask Market Revenue Million Forecast, by Product Type 2019 & 2032
- Table 37: Global Military Gas Mask Market Revenue Million Forecast, by End User 2019 & 2032
- Table 38: Global Military Gas Mask Market Revenue Million Forecast, by Country 2019 & 2032
- Table 39: Germany Military Gas Mask Market Revenue (Million) Forecast, by Application 2019 & 2032
- Table 40: United Kingdom Military Gas Mask Market Revenue (Million) Forecast, by Application 2019 & 2032
- Table 41: France Military Gas Mask Market Revenue (Million) Forecast, by Application 2019 & 2032
- Table 42: Russia Military Gas Mask Market Revenue (Million) Forecast, by Application 2019 & 2032
- Table 43: Rest of Europe Military Gas Mask Market Revenue (Million) Forecast, by Application 2019 & 2032
- Table 44: Global Military Gas Mask Market Revenue Million Forecast, by Mask Type 2019 & 2032
- Table 45: Global Military Gas Mask Market Revenue Million Forecast, by Product Type 2019 & 2032
- Table 46: Global Military Gas Mask Market Revenue Million Forecast, by End User 2019 & 2032
- Table 47: Global Military Gas Mask Market Revenue Million Forecast, by Country 2019 & 2032
- Table 48: China Military Gas Mask Market Revenue (Million) Forecast, by Application 2019 & 2032
- Table 49: Japan Military Gas Mask Market Revenue (Million) Forecast, by Application 2019 & 2032
- Table 50: India Military Gas Mask Market Revenue (Million) Forecast, by Application 2019 & 2032
- Table 51: Rest of Asia Pacific Military Gas Mask Market Revenue (Million) Forecast, by Application 2019 & 2032
- Table 52: Global Military Gas Mask Market Revenue Million Forecast, by Mask Type 2019 & 2032
- Table 53: Global Military Gas Mask Market Revenue Million Forecast, by Product Type 2019 & 2032
- Table 54: Global Military Gas Mask Market Revenue Million Forecast, by End User 2019 & 2032
- Table 55: Global Military Gas Mask Market Revenue Million Forecast, by Country 2019 & 2032
- Table 56: Brazil Military Gas Mask Market Revenue (Million) Forecast, by Application 2019 & 2032
- Table 57: Mexico Military Gas Mask Market Revenue (Million) Forecast, by Application 2019 & 2032
- Table 58: Rest of Latin America Military Gas Mask Market Revenue (Million) Forecast, by Application 2019 & 2032
- Table 59: Global Military Gas Mask Market Revenue Million Forecast, by Mask Type 2019 & 2032
- Table 60: Global Military Gas Mask Market Revenue Million Forecast, by Product Type 2019 & 2032
- Table 61: Global Military Gas Mask Market Revenue Million Forecast, by End User 2019 & 2032
- Table 62: Global Military Gas Mask Market Revenue Million Forecast, by Country 2019 & 2032
- Table 63: Saudi Arabia Military Gas Mask Market Revenue (Million) Forecast, by Application 2019 & 2032
- Table 64: United Arab Emirates Military Gas Mask Market Revenue (Million) Forecast, by Application 2019 & 2032
- Table 65: Kuwait Military Gas Mask Market Revenue (Million) Forecast, by Application 2019 & 2032
- Table 66: Rest of Middle East and Africa Military Gas Mask Market Revenue (Million) Forecast, by Application 2019 & 2032
Frequently Asked Questions
1. What is the projected Compound Annual Growth Rate (CAGR) of the Military Gas Mask Market?
The projected CAGR is approximately 3.00%.
2. Which companies are prominent players in the Military Gas Mask Market?
Key companies in the market include All Safe Industries Inc, Drgerwerk AG & Co KG, Honeywell International Inc, Duram Mask, Johnson Control, MSA Safety Incorporated, 3M, Metadure Parts & Sales Inc, Nexter Group, Shalon Chemical Industries Ltd, TSI Incorporate, Avon Protection plc.
3. What are the main segments of the Military Gas Mask Market?
The market segments include Mask Type, Product Type, End User.
4. Can you provide details about the market size?
The market size is estimated to be USD XX Million as of 2022.
5. What are some drivers contributing to market growth?
N/A
6. What are the notable trends driving market growth?
The Full-Face Gas Mask Segment Is Expected To Witness A Significant Growth During The Forecast Period..
7. Are there any restraints impacting market growth?
N/A
8. Can you provide examples of recent developments in the market?
N/A
9. What pricing options are available for accessing the report?
Pricing options include single-user, multi-user, and enterprise licenses priced at USD 4750, USD 5250, and USD 8750 respectively.
10. Is the market size provided in terms of value or volume?
The market size is provided in terms of value, measured in Million.
11. Are there any specific market keywords associated with the report?
Yes, the market keyword associated with the report is "Military Gas Mask Market," which aids in identifying and referencing the specific market segment covered.
12. How do I determine which pricing option suits my needs best?
The pricing options vary based on user requirements and access needs. Individual users may opt for single-user licenses, while businesses requiring broader access may choose multi-user or enterprise licenses for cost-effective access to the report.
13. Are there any additional resources or data provided in the Military Gas Mask Market report?
While the report offers comprehensive insights, it's advisable to review the specific contents or supplementary materials provided to ascertain if additional resources or data are available.
14. How can I stay updated on further developments or reports in the Military Gas Mask Market?
To stay informed about further developments, trends, and reports in the Military Gas Mask Market, consider subscribing to industry newsletters, following relevant companies and organizations, or regularly checking reputable industry news sources and publications.
Methodology
Step 1 - Identification of Relevant Samples Size from Population Database


Step 2 - Approaches for Defining Global Market Size (Value, Volume* & Price*)

Note*: In applicable scenarios
Step 3 - Data Sources
Primary Research
- Web Analytics
- Survey Reports
- Research Institute
- Latest Research Reports
- Opinion Leaders
Secondary Research
- Annual Reports
- White Paper
- Latest Press Release
- Industry Association
- Paid Database
- Investor Presentations

Step 4 - Data Triangulation
Involves using different sources of information in order to increase the validity of a study
These sources are likely to be stakeholders in a program - participants, other researchers, program staff, other community members, and so on.
Then we put all data in single framework & apply various statistical tools to find out the dynamic on the market.
During the analysis stage, feedback from the stakeholder groups would be compared to determine areas of agreement as well as areas of divergence
