

Key Insights
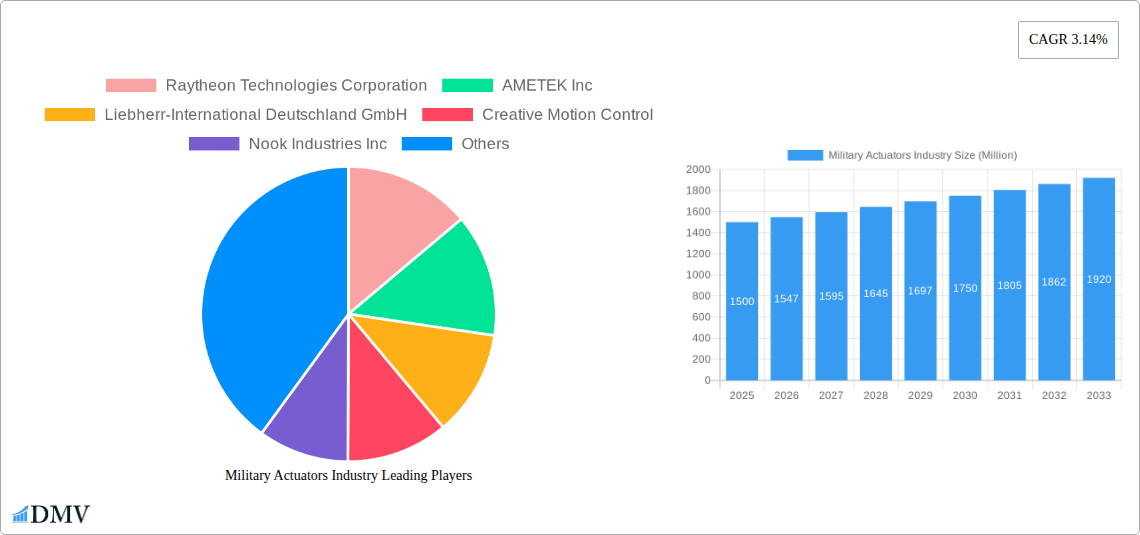
The global military actuators market, valued at approximately $1.5 billion in 2025, is projected to experience steady growth, driven by increasing defense budgets worldwide and the ongoing modernization of military platforms. A Compound Annual Growth Rate (CAGR) of 3.14% from 2025 to 2033 indicates a continuous, albeit moderate, expansion. Key drivers include the rising demand for advanced weapon systems incorporating sophisticated control mechanisms, the integration of unmanned aerial vehicles (UAVs) and autonomous systems, and the need for enhanced precision and maneuverability in military applications. Technological advancements in electric and hydraulic actuators, offering improved efficiency, reliability, and payload capacity, are further fueling market growth. However, factors such as the high cost of advanced actuators and the stringent regulatory environment surrounding military technology could act as restraints, potentially moderating the overall market expansion. The market is segmented by actuator type (linear, rotary), system (mechanical, hydraulic, electrical, pneumatic), and application (land, air, sea). The air segment is expected to dominate due to the increasing adoption of advanced flight control systems in military aircraft. Major players such as Raytheon Technologies, AMETEK, and Moog are leveraging their technological expertise and established supply chains to capture significant market share, while smaller, specialized companies focus on niche applications and innovative actuator designs.
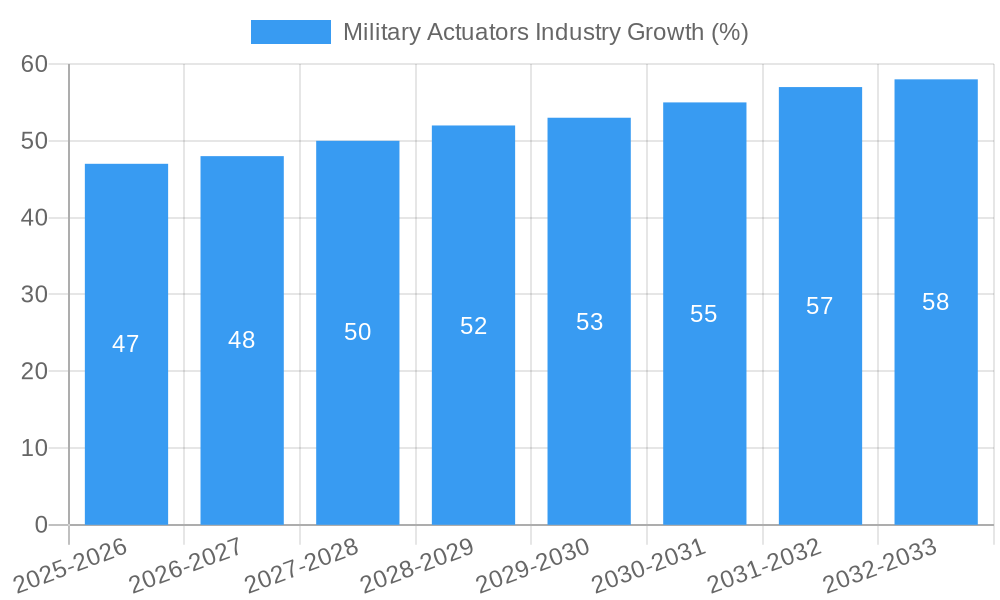
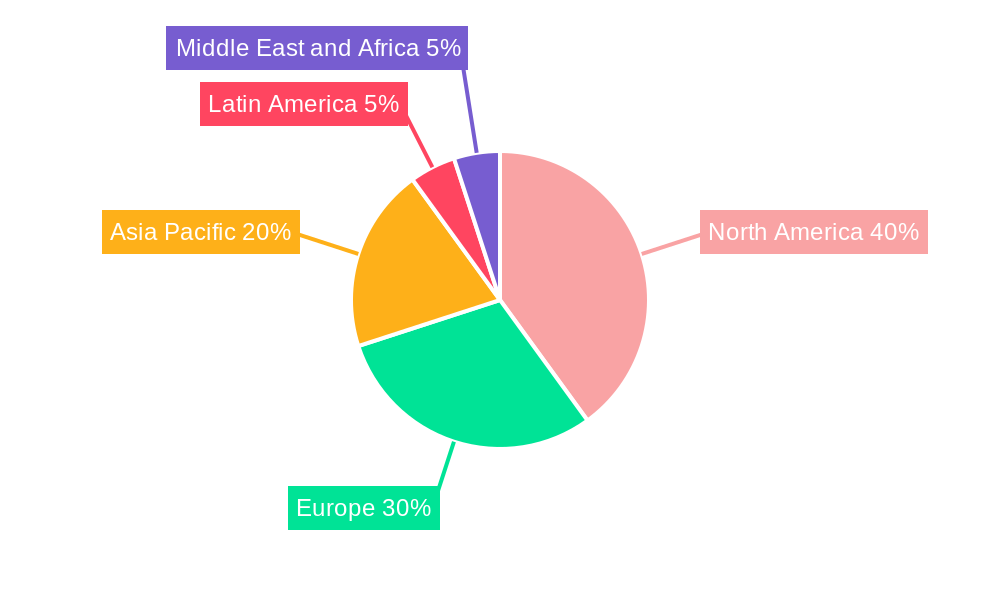
The North American region is anticipated to hold a significant market share, driven by substantial defense spending and a strong presence of key actuator manufacturers. Europe and Asia-Pacific are also expected to witness considerable growth, fueled by rising geopolitical tensions and modernization efforts within their respective military forces. The competitive landscape is characterized by a mix of established industry giants and emerging players, fostering innovation and driving down costs. The forecast period (2025-2033) suggests a gradual increase in market size, influenced by continuous technological advancements, defense modernization programs, and strategic investments by key players in research and development. The long-term outlook for the military actuators market remains positive, driven by persistent demand for sophisticated and reliable actuation systems across various military platforms.
Military Actuators Industry: A Comprehensive Market Report (2019-2033)
This insightful report provides a detailed analysis of the Military Actuators industry, encompassing market size, growth trajectories, key players, and future opportunities. The study period covers 2019-2033, with 2025 as the base and estimated year. The report offers a comprehensive overview for stakeholders seeking to understand and capitalize on this dynamic market, valued at xx Million in 2025 and projected to reach xx Million by 2033.
Military Actuators Industry Market Composition & Trends
This section delves into the competitive landscape of the military actuators market, examining market concentration, innovation drivers, regulatory influences, substitute products, end-user profiles, and merger & acquisition (M&A) activities. The market is characterized by a moderately concentrated landscape, with several major players holding significant market share. The top five companies account for approximately xx% of the global market in 2025.
- Market Share Distribution (2025): Raytheon Technologies Corporation (xx%), AMETEK Inc. (xx%), Moog Inc. (xx%), Parker Hannifin Corporation (xx%), Others (xx%).
- Innovation Catalysts: Advancements in materials science, miniaturization technologies, and increased demand for improved precision and reliability are driving innovation.
- Regulatory Landscape: Stringent safety and performance standards, coupled with evolving defense procurement regulations, significantly impact market dynamics. Compliance costs and lengthy certification processes can pose challenges for smaller players.
- Substitute Products: While direct substitutes are limited, alternative technologies such as advanced control systems and robotics could potentially impact market growth.
- End-User Profiles: The primary end-users are defense contractors, government agencies, and military branches worldwide. Specific needs vary significantly across land, air, and sea applications.
- M&A Activity: The past five years have witnessed xx M&A deals valued at approximately xx Million, primarily driven by efforts to expand product portfolios and geographic reach. These deals highlight the consolidation trend within the industry.
Military Actuators Industry Industry Evolution
The military actuators industry has witnessed substantial growth over the historical period (2019-2024), primarily driven by increased defense spending, modernization of military platforms, and technological advancements. The market experienced a Compound Annual Growth Rate (CAGR) of xx% between 2019 and 2024. Technological advancements, such as the integration of smart actuators and improved control systems, have significantly enhanced the capabilities and performance of military actuators. This trend is expected to continue, with a projected CAGR of xx% from 2025 to 2033. The increasing demand for unmanned aerial vehicles (UAVs), unmanned underwater vehicles (UUVs), and other autonomous systems is fueling growth in specific actuator types, particularly electric and electro-hydraulic systems. The shift towards more sophisticated military platforms also drives demand for higher-precision actuators with enhanced control capabilities. The growing focus on reducing weight and size while maintaining performance is a key factor pushing innovation in materials and designs.
Leading Regions, Countries, or Segments in Military Actuators Industry
The North American region currently holds the largest market share in the military actuators industry, followed by Europe and Asia-Pacific. This dominance is driven by several factors:
- North America:
- High defense spending and technological advancements.
- Strong presence of major actuator manufacturers.
- Robust research and development activities in military technology.
- Europe:
- Significant defense budgets across several European nations.
- Focus on advanced actuator technologies for land, air, and naval applications.
- Asia-Pacific:
- Rising defense budgets in several countries.
- Increasing demand for modern military equipment.
Within the segments, the linear actuator type holds the largest share, followed by rotary actuators. In terms of systems, hydraulic systems dominate, driven by their high power-to-weight ratio and robustness, though electrical systems are experiencing rapid growth due to improved efficiency and control precision. The Air segment dominates applications, reflecting the prevalence of actuators in aircraft and missile systems.
Military Actuators Industry Product Innovations
Recent innovations have focused on enhancing actuator performance, reliability, and efficiency. Miniaturization of actuators, enabling their integration into smaller platforms, is a key development. Smart actuators, incorporating embedded sensors and advanced control algorithms, are improving precision and reducing maintenance needs. The incorporation of advanced materials, such as lightweight composites, is further improving performance. The focus is shifting towards increased energy efficiency and reduced lifecycle costs.
Propelling Factors for Military Actuators Industry Growth
Several factors are driving growth in the military actuators industry. Increased defense spending globally is a primary driver. Technological advancements, particularly the miniaturization of actuators and integration of smart technology, are boosting demand. The growing demand for sophisticated military platforms and autonomous systems is driving the adoption of higher-performance actuators. Government initiatives supporting defense modernization further fuel market growth.
Obstacles in the Military Actuators Industry Market
The industry faces challenges including stringent regulatory requirements and lengthy certification processes that increase development costs. Supply chain disruptions, particularly concerning specialized materials, can lead to production delays and impact market stability. Intense competition among established players limits profit margins.
Future Opportunities in Military Actuators Industry
Future opportunities lie in the development of lighter, more efficient, and more intelligent actuators. The growing demand for autonomous systems presents a substantial growth opportunity. Expanding into new markets, particularly in developing economies with increasing defense budgets, offers further potential. The integration of advanced materials and improved manufacturing processes can enhance efficiency and reduce costs.
Major Players in the Military Actuators Industry Ecosystem
- Raytheon Technologies Corporation
- AMETEK Inc
- Liebherr-International Deutschland GmbH
- Creative Motion Control
- Nook Industries Inc
- Woodward Inc
- Moog Inc
- Beaver Aerospace & Defense Inc
- Kyntronics
- Curtiss-Wright Corporation
- Triumph Group
- Parker Hannifin Corporation
- AUMA Riester GmbH & Co KG
- Cobham Limited
Key Developments in Military Actuators Industry Industry
- June 2021: Kyntronics joined the Rockwell Automation Technology Partner program, integrating its SMART Electro-Hydraulic Actuators.
- May 2021: Marotta Controls received full component-level qualification for its custom fin Control Actuation System (CAS) for Lockheed Martin, moving into high-volume production.
Strategic Military Actuators Industry Market Forecast
The military actuators market is poised for sustained growth, driven by ongoing technological advancements, increasing defense budgets, and the demand for enhanced military capabilities. The focus on miniaturization, improved precision, and energy efficiency will shape future product development. The market is expected to witness strong growth in the forecast period (2025-2033), exceeding xx Million by 2033.
Military Actuators Industry Segmentation
- 1. Production Analysis
- 2. Consumption Analysis
- 3. Import Market Analysis (Value & Volume)
- 4. Export Market Analysis (Value & Volume)
- 5. Price Trend Analysis
Military Actuators Industry Segmentation By Geography
-
1. North America
- 1.1. United States
- 1.2. Canada
- 1.3. Mexico
-
2. South America
- 2.1. Brazil
- 2.2. Argentina
- 2.3. Rest of South America
-
3. Europe
- 3.1. United Kingdom
- 3.2. Germany
- 3.3. France
- 3.4. Italy
- 3.5. Spain
- 3.6. Russia
- 3.7. Benelux
- 3.8. Nordics
- 3.9. Rest of Europe
-
4. Middle East & Africa
- 4.1. Turkey
- 4.2. Israel
- 4.3. GCC
- 4.4. North Africa
- 4.5. South Africa
- 4.6. Rest of Middle East & Africa
-
5. Asia Pacific
- 5.1. China
- 5.2. India
- 5.3. Japan
- 5.4. South Korea
- 5.5. ASEAN
- 5.6. Oceania
- 5.7. Rest of Asia Pacific
Military Actuators Industry REPORT HIGHLIGHTS
| Aspects | Details |
|---|---|
| Study Period | 2019-2033 |
| Base Year | 2024 |
| Estimated Year | 2025 |
| Forecast Period | 2025-2033 |
| Historical Period | 2019-2024 |
| Growth Rate | CAGR of 3.14% from 2019-2033 |
| Segmentation |
|
Table of Contents
- 1. Introduction
- 1.1. Research Scope
- 1.2. Market Segmentation
- 1.3. Research Methodology
- 1.4. Definitions and Assumptions
- 2. Executive Summary
- 2.1. Introduction
- 3. Market Dynamics
- 3.1. Introduction
- 3.2. Market Drivers
- 3.2.1. ; Increasing Number Of Air Passengers; Use Of Portable Electronic Devices
- 3.3. Market Restrains
- 3.3.1. ; High Cost Of Connectivity Equipments
- 3.4. Market Trends
- 3.4.1. The Land Segment is Anticipated to Witness Highest Growth During the Forecast Period
- 4. Market Factor Analysis
- 4.1. Porters Five Forces
- 4.2. Supply/Value Chain
- 4.3. PESTEL analysis
- 4.4. Market Entropy
- 4.5. Patent/Trademark Analysis
- 5. Global Military Actuators Industry Analysis, Insights and Forecast, 2019-2031
- 5.1. Market Analysis, Insights and Forecast - by Production Analysis
- 5.2. Market Analysis, Insights and Forecast - by Consumption Analysis
- 5.3. Market Analysis, Insights and Forecast - by Import Market Analysis (Value & Volume)
- 5.4. Market Analysis, Insights and Forecast - by Export Market Analysis (Value & Volume)
- 5.5. Market Analysis, Insights and Forecast - by Price Trend Analysis
- 5.6. Market Analysis, Insights and Forecast - by Region
- 5.6.1. North America
- 5.6.2. South America
- 5.6.3. Europe
- 5.6.4. Middle East & Africa
- 5.6.5. Asia Pacific
- 5.1. Market Analysis, Insights and Forecast - by Production Analysis
- 6. North America Military Actuators Industry Analysis, Insights and Forecast, 2019-2031
- 6.1. Market Analysis, Insights and Forecast - by Production Analysis
- 6.2. Market Analysis, Insights and Forecast - by Consumption Analysis
- 6.3. Market Analysis, Insights and Forecast - by Import Market Analysis (Value & Volume)
- 6.4. Market Analysis, Insights and Forecast - by Export Market Analysis (Value & Volume)
- 6.5. Market Analysis, Insights and Forecast - by Price Trend Analysis
- 6.1. Market Analysis, Insights and Forecast - by Production Analysis
- 7. South America Military Actuators Industry Analysis, Insights and Forecast, 2019-2031
- 7.1. Market Analysis, Insights and Forecast - by Production Analysis
- 7.2. Market Analysis, Insights and Forecast - by Consumption Analysis
- 7.3. Market Analysis, Insights and Forecast - by Import Market Analysis (Value & Volume)
- 7.4. Market Analysis, Insights and Forecast - by Export Market Analysis (Value & Volume)
- 7.5. Market Analysis, Insights and Forecast - by Price Trend Analysis
- 7.1. Market Analysis, Insights and Forecast - by Production Analysis
- 8. Europe Military Actuators Industry Analysis, Insights and Forecast, 2019-2031
- 8.1. Market Analysis, Insights and Forecast - by Production Analysis
- 8.2. Market Analysis, Insights and Forecast - by Consumption Analysis
- 8.3. Market Analysis, Insights and Forecast - by Import Market Analysis (Value & Volume)
- 8.4. Market Analysis, Insights and Forecast - by Export Market Analysis (Value & Volume)
- 8.5. Market Analysis, Insights and Forecast - by Price Trend Analysis
- 8.1. Market Analysis, Insights and Forecast - by Production Analysis
- 9. Middle East & Africa Military Actuators Industry Analysis, Insights and Forecast, 2019-2031
- 9.1. Market Analysis, Insights and Forecast - by Production Analysis
- 9.2. Market Analysis, Insights and Forecast - by Consumption Analysis
- 9.3. Market Analysis, Insights and Forecast - by Import Market Analysis (Value & Volume)
- 9.4. Market Analysis, Insights and Forecast - by Export Market Analysis (Value & Volume)
- 9.5. Market Analysis, Insights and Forecast - by Price Trend Analysis
- 9.1. Market Analysis, Insights and Forecast - by Production Analysis
- 10. Asia Pacific Military Actuators Industry Analysis, Insights and Forecast, 2019-2031
- 10.1. Market Analysis, Insights and Forecast - by Production Analysis
- 10.2. Market Analysis, Insights and Forecast - by Consumption Analysis
- 10.3. Market Analysis, Insights and Forecast - by Import Market Analysis (Value & Volume)
- 10.4. Market Analysis, Insights and Forecast - by Export Market Analysis (Value & Volume)
- 10.5. Market Analysis, Insights and Forecast - by Price Trend Analysis
- 10.1. Market Analysis, Insights and Forecast - by Production Analysis
- 11. North America Military Actuators Industry Analysis, Insights and Forecast, 2019-2031
- 11.1. Market Analysis, Insights and Forecast - By Country/Sub-region
- 11.1.1 United States
- 11.1.2 Canada
- 12. Europe Military Actuators Industry Analysis, Insights and Forecast, 2019-2031
- 12.1. Market Analysis, Insights and Forecast - By Country/Sub-region
- 12.1.1 United Kingdom
- 12.1.2 Germany
- 12.1.3 France
- 12.1.4 Russia
- 12.1.5 Rest of Europe
- 13. Asia Pacific Military Actuators Industry Analysis, Insights and Forecast, 2019-2031
- 13.1. Market Analysis, Insights and Forecast - By Country/Sub-region
- 13.1.1 China
- 13.1.2 Japan
- 13.1.3 India
- 13.1.4 South Korea
- 13.1.5 Rest of Asia Pacific
- 14. Latin America Military Actuators Industry Analysis, Insights and Forecast, 2019-2031
- 14.1. Market Analysis, Insights and Forecast - By Country/Sub-region
- 14.1.1 Brazil
- 14.1.2 Rest of Latin America
- 15. Middle East and Africa Military Actuators Industry Analysis, Insights and Forecast, 2019-2031
- 15.1. Market Analysis, Insights and Forecast - By Country/Sub-region
- 15.1.1 United Arab Emirates
- 15.1.2 Saudi Arabia
- 15.1.3 Egypt
- 15.1.4 Turkey
- 15.1.5 Rest of Middle East and Africa
- 16. Competitive Analysis
- 16.1. Global Market Share Analysis 2024
- 16.2. Company Profiles
- 16.2.1 Raytheon Technologies Corporation
- 16.2.1.1. Overview
- 16.2.1.2. Products
- 16.2.1.3. SWOT Analysis
- 16.2.1.4. Recent Developments
- 16.2.1.5. Financials (Based on Availability)
- 16.2.2 AMETEK Inc
- 16.2.2.1. Overview
- 16.2.2.2. Products
- 16.2.2.3. SWOT Analysis
- 16.2.2.4. Recent Developments
- 16.2.2.5. Financials (Based on Availability)
- 16.2.3 Liebherr-International Deutschland GmbH
- 16.2.3.1. Overview
- 16.2.3.2. Products
- 16.2.3.3. SWOT Analysis
- 16.2.3.4. Recent Developments
- 16.2.3.5. Financials (Based on Availability)
- 16.2.4 Creative Motion Control
- 16.2.4.1. Overview
- 16.2.4.2. Products
- 16.2.4.3. SWOT Analysis
- 16.2.4.4. Recent Developments
- 16.2.4.5. Financials (Based on Availability)
- 16.2.5 Nook Industries Inc
- 16.2.5.1. Overview
- 16.2.5.2. Products
- 16.2.5.3. SWOT Analysis
- 16.2.5.4. Recent Developments
- 16.2.5.5. Financials (Based on Availability)
- 16.2.6 Woodward Inc
- 16.2.6.1. Overview
- 16.2.6.2. Products
- 16.2.6.3. SWOT Analysis
- 16.2.6.4. Recent Developments
- 16.2.6.5. Financials (Based on Availability)
- 16.2.7 Moog Inc
- 16.2.7.1. Overview
- 16.2.7.2. Products
- 16.2.7.3. SWOT Analysis
- 16.2.7.4. Recent Developments
- 16.2.7.5. Financials (Based on Availability)
- 16.2.8 Beaver Aerospace & Defense Inc
- 16.2.8.1. Overview
- 16.2.8.2. Products
- 16.2.8.3. SWOT Analysis
- 16.2.8.4. Recent Developments
- 16.2.8.5. Financials (Based on Availability)
- 16.2.9 Kyntronics
- 16.2.9.1. Overview
- 16.2.9.2. Products
- 16.2.9.3. SWOT Analysis
- 16.2.9.4. Recent Developments
- 16.2.9.5. Financials (Based on Availability)
- 16.2.10 Curtiss-Wright Corporation
- 16.2.10.1. Overview
- 16.2.10.2. Products
- 16.2.10.3. SWOT Analysis
- 16.2.10.4. Recent Developments
- 16.2.10.5. Financials (Based on Availability)
- 16.2.11 Triumph Group
- 16.2.11.1. Overview
- 16.2.11.2. Products
- 16.2.11.3. SWOT Analysis
- 16.2.11.4. Recent Developments
- 16.2.11.5. Financials (Based on Availability)
- 16.2.12 Parker Hannifin Corporation
- 16.2.12.1. Overview
- 16.2.12.2. Products
- 16.2.12.3. SWOT Analysis
- 16.2.12.4. Recent Developments
- 16.2.12.5. Financials (Based on Availability)
- 16.2.13 AUMA Riester GmbH & Co KG
- 16.2.13.1. Overview
- 16.2.13.2. Products
- 16.2.13.3. SWOT Analysis
- 16.2.13.4. Recent Developments
- 16.2.13.5. Financials (Based on Availability)
- 16.2.14 Cobham Limite
- 16.2.14.1. Overview
- 16.2.14.2. Products
- 16.2.14.3. SWOT Analysis
- 16.2.14.4. Recent Developments
- 16.2.14.5. Financials (Based on Availability)
- 16.2.1 Raytheon Technologies Corporation
List of Figures
- Figure 1: Global Military Actuators Industry Revenue Breakdown (Million, %) by Region 2024 & 2032
- Figure 2: North America Military Actuators Industry Revenue (Million), by Country 2024 & 2032
- Figure 3: North America Military Actuators Industry Revenue Share (%), by Country 2024 & 2032
- Figure 4: Europe Military Actuators Industry Revenue (Million), by Country 2024 & 2032
- Figure 5: Europe Military Actuators Industry Revenue Share (%), by Country 2024 & 2032
- Figure 6: Asia Pacific Military Actuators Industry Revenue (Million), by Country 2024 & 2032
- Figure 7: Asia Pacific Military Actuators Industry Revenue Share (%), by Country 2024 & 2032
- Figure 8: Latin America Military Actuators Industry Revenue (Million), by Country 2024 & 2032
- Figure 9: Latin America Military Actuators Industry Revenue Share (%), by Country 2024 & 2032
- Figure 10: Middle East and Africa Military Actuators Industry Revenue (Million), by Country 2024 & 2032
- Figure 11: Middle East and Africa Military Actuators Industry Revenue Share (%), by Country 2024 & 2032
- Figure 12: North America Military Actuators Industry Revenue (Million), by Production Analysis 2024 & 2032
- Figure 13: North America Military Actuators Industry Revenue Share (%), by Production Analysis 2024 & 2032
- Figure 14: North America Military Actuators Industry Revenue (Million), by Consumption Analysis 2024 & 2032
- Figure 15: North America Military Actuators Industry Revenue Share (%), by Consumption Analysis 2024 & 2032
- Figure 16: North America Military Actuators Industry Revenue (Million), by Import Market Analysis (Value & Volume) 2024 & 2032
- Figure 17: North America Military Actuators Industry Revenue Share (%), by Import Market Analysis (Value & Volume) 2024 & 2032
- Figure 18: North America Military Actuators Industry Revenue (Million), by Export Market Analysis (Value & Volume) 2024 & 2032
- Figure 19: North America Military Actuators Industry Revenue Share (%), by Export Market Analysis (Value & Volume) 2024 & 2032
- Figure 20: North America Military Actuators Industry Revenue (Million), by Price Trend Analysis 2024 & 2032
- Figure 21: North America Military Actuators Industry Revenue Share (%), by Price Trend Analysis 2024 & 2032
- Figure 22: North America Military Actuators Industry Revenue (Million), by Country 2024 & 2032
- Figure 23: North America Military Actuators Industry Revenue Share (%), by Country 2024 & 2032
- Figure 24: South America Military Actuators Industry Revenue (Million), by Production Analysis 2024 & 2032
- Figure 25: South America Military Actuators Industry Revenue Share (%), by Production Analysis 2024 & 2032
- Figure 26: South America Military Actuators Industry Revenue (Million), by Consumption Analysis 2024 & 2032
- Figure 27: South America Military Actuators Industry Revenue Share (%), by Consumption Analysis 2024 & 2032
- Figure 28: South America Military Actuators Industry Revenue (Million), by Import Market Analysis (Value & Volume) 2024 & 2032
- Figure 29: South America Military Actuators Industry Revenue Share (%), by Import Market Analysis (Value & Volume) 2024 & 2032
- Figure 30: South America Military Actuators Industry Revenue (Million), by Export Market Analysis (Value & Volume) 2024 & 2032
- Figure 31: South America Military Actuators Industry Revenue Share (%), by Export Market Analysis (Value & Volume) 2024 & 2032
- Figure 32: South America Military Actuators Industry Revenue (Million), by Price Trend Analysis 2024 & 2032
- Figure 33: South America Military Actuators Industry Revenue Share (%), by Price Trend Analysis 2024 & 2032
- Figure 34: South America Military Actuators Industry Revenue (Million), by Country 2024 & 2032
- Figure 35: South America Military Actuators Industry Revenue Share (%), by Country 2024 & 2032
- Figure 36: Europe Military Actuators Industry Revenue (Million), by Production Analysis 2024 & 2032
- Figure 37: Europe Military Actuators Industry Revenue Share (%), by Production Analysis 2024 & 2032
- Figure 38: Europe Military Actuators Industry Revenue (Million), by Consumption Analysis 2024 & 2032
- Figure 39: Europe Military Actuators Industry Revenue Share (%), by Consumption Analysis 2024 & 2032
- Figure 40: Europe Military Actuators Industry Revenue (Million), by Import Market Analysis (Value & Volume) 2024 & 2032
- Figure 41: Europe Military Actuators Industry Revenue Share (%), by Import Market Analysis (Value & Volume) 2024 & 2032
- Figure 42: Europe Military Actuators Industry Revenue (Million), by Export Market Analysis (Value & Volume) 2024 & 2032
- Figure 43: Europe Military Actuators Industry Revenue Share (%), by Export Market Analysis (Value & Volume) 2024 & 2032
- Figure 44: Europe Military Actuators Industry Revenue (Million), by Price Trend Analysis 2024 & 2032
- Figure 45: Europe Military Actuators Industry Revenue Share (%), by Price Trend Analysis 2024 & 2032
- Figure 46: Europe Military Actuators Industry Revenue (Million), by Country 2024 & 2032
- Figure 47: Europe Military Actuators Industry Revenue Share (%), by Country 2024 & 2032
- Figure 48: Middle East & Africa Military Actuators Industry Revenue (Million), by Production Analysis 2024 & 2032
- Figure 49: Middle East & Africa Military Actuators Industry Revenue Share (%), by Production Analysis 2024 & 2032
- Figure 50: Middle East & Africa Military Actuators Industry Revenue (Million), by Consumption Analysis 2024 & 2032
- Figure 51: Middle East & Africa Military Actuators Industry Revenue Share (%), by Consumption Analysis 2024 & 2032
- Figure 52: Middle East & Africa Military Actuators Industry Revenue (Million), by Import Market Analysis (Value & Volume) 2024 & 2032
- Figure 53: Middle East & Africa Military Actuators Industry Revenue Share (%), by Import Market Analysis (Value & Volume) 2024 & 2032
- Figure 54: Middle East & Africa Military Actuators Industry Revenue (Million), by Export Market Analysis (Value & Volume) 2024 & 2032
- Figure 55: Middle East & Africa Military Actuators Industry Revenue Share (%), by Export Market Analysis (Value & Volume) 2024 & 2032
- Figure 56: Middle East & Africa Military Actuators Industry Revenue (Million), by Price Trend Analysis 2024 & 2032
- Figure 57: Middle East & Africa Military Actuators Industry Revenue Share (%), by Price Trend Analysis 2024 & 2032
- Figure 58: Middle East & Africa Military Actuators Industry Revenue (Million), by Country 2024 & 2032
- Figure 59: Middle East & Africa Military Actuators Industry Revenue Share (%), by Country 2024 & 2032
- Figure 60: Asia Pacific Military Actuators Industry Revenue (Million), by Production Analysis 2024 & 2032
- Figure 61: Asia Pacific Military Actuators Industry Revenue Share (%), by Production Analysis 2024 & 2032
- Figure 62: Asia Pacific Military Actuators Industry Revenue (Million), by Consumption Analysis 2024 & 2032
- Figure 63: Asia Pacific Military Actuators Industry Revenue Share (%), by Consumption Analysis 2024 & 2032
- Figure 64: Asia Pacific Military Actuators Industry Revenue (Million), by Import Market Analysis (Value & Volume) 2024 & 2032
- Figure 65: Asia Pacific Military Actuators Industry Revenue Share (%), by Import Market Analysis (Value & Volume) 2024 & 2032
- Figure 66: Asia Pacific Military Actuators Industry Revenue (Million), by Export Market Analysis (Value & Volume) 2024 & 2032
- Figure 67: Asia Pacific Military Actuators Industry Revenue Share (%), by Export Market Analysis (Value & Volume) 2024 & 2032
- Figure 68: Asia Pacific Military Actuators Industry Revenue (Million), by Price Trend Analysis 2024 & 2032
- Figure 69: Asia Pacific Military Actuators Industry Revenue Share (%), by Price Trend Analysis 2024 & 2032
- Figure 70: Asia Pacific Military Actuators Industry Revenue (Million), by Country 2024 & 2032
- Figure 71: Asia Pacific Military Actuators Industry Revenue Share (%), by Country 2024 & 2032
List of Tables
- Table 1: Global Military Actuators Industry Revenue Million Forecast, by Region 2019 & 2032
- Table 2: Global Military Actuators Industry Revenue Million Forecast, by Production Analysis 2019 & 2032
- Table 3: Global Military Actuators Industry Revenue Million Forecast, by Consumption Analysis 2019 & 2032
- Table 4: Global Military Actuators Industry Revenue Million Forecast, by Import Market Analysis (Value & Volume) 2019 & 2032
- Table 5: Global Military Actuators Industry Revenue Million Forecast, by Export Market Analysis (Value & Volume) 2019 & 2032
- Table 6: Global Military Actuators Industry Revenue Million Forecast, by Price Trend Analysis 2019 & 2032
- Table 7: Global Military Actuators Industry Revenue Million Forecast, by Region 2019 & 2032
- Table 8: Global Military Actuators Industry Revenue Million Forecast, by Country 2019 & 2032
- Table 9: United States Military Actuators Industry Revenue (Million) Forecast, by Application 2019 & 2032
- Table 10: Canada Military Actuators Industry Revenue (Million) Forecast, by Application 2019 & 2032
- Table 11: Global Military Actuators Industry Revenue Million Forecast, by Country 2019 & 2032
- Table 12: United Kingdom Military Actuators Industry Revenue (Million) Forecast, by Application 2019 & 2032
- Table 13: Germany Military Actuators Industry Revenue (Million) Forecast, by Application 2019 & 2032
- Table 14: France Military Actuators Industry Revenue (Million) Forecast, by Application 2019 & 2032
- Table 15: Russia Military Actuators Industry Revenue (Million) Forecast, by Application 2019 & 2032
- Table 16: Rest of Europe Military Actuators Industry Revenue (Million) Forecast, by Application 2019 & 2032
- Table 17: Global Military Actuators Industry Revenue Million Forecast, by Country 2019 & 2032
- Table 18: China Military Actuators Industry Revenue (Million) Forecast, by Application 2019 & 2032
- Table 19: Japan Military Actuators Industry Revenue (Million) Forecast, by Application 2019 & 2032
- Table 20: India Military Actuators Industry Revenue (Million) Forecast, by Application 2019 & 2032
- Table 21: South Korea Military Actuators Industry Revenue (Million) Forecast, by Application 2019 & 2032
- Table 22: Rest of Asia Pacific Military Actuators Industry Revenue (Million) Forecast, by Application 2019 & 2032
- Table 23: Global Military Actuators Industry Revenue Million Forecast, by Country 2019 & 2032
- Table 24: Brazil Military Actuators Industry Revenue (Million) Forecast, by Application 2019 & 2032
- Table 25: Rest of Latin America Military Actuators Industry Revenue (Million) Forecast, by Application 2019 & 2032
- Table 26: Global Military Actuators Industry Revenue Million Forecast, by Country 2019 & 2032
- Table 27: United Arab Emirates Military Actuators Industry Revenue (Million) Forecast, by Application 2019 & 2032
- Table 28: Saudi Arabia Military Actuators Industry Revenue (Million) Forecast, by Application 2019 & 2032
- Table 29: Egypt Military Actuators Industry Revenue (Million) Forecast, by Application 2019 & 2032
- Table 30: Turkey Military Actuators Industry Revenue (Million) Forecast, by Application 2019 & 2032
- Table 31: Rest of Middle East and Africa Military Actuators Industry Revenue (Million) Forecast, by Application 2019 & 2032
- Table 32: Global Military Actuators Industry Revenue Million Forecast, by Production Analysis 2019 & 2032
- Table 33: Global Military Actuators Industry Revenue Million Forecast, by Consumption Analysis 2019 & 2032
- Table 34: Global Military Actuators Industry Revenue Million Forecast, by Import Market Analysis (Value & Volume) 2019 & 2032
- Table 35: Global Military Actuators Industry Revenue Million Forecast, by Export Market Analysis (Value & Volume) 2019 & 2032
- Table 36: Global Military Actuators Industry Revenue Million Forecast, by Price Trend Analysis 2019 & 2032
- Table 37: Global Military Actuators Industry Revenue Million Forecast, by Country 2019 & 2032
- Table 38: United States Military Actuators Industry Revenue (Million) Forecast, by Application 2019 & 2032
- Table 39: Canada Military Actuators Industry Revenue (Million) Forecast, by Application 2019 & 2032
- Table 40: Mexico Military Actuators Industry Revenue (Million) Forecast, by Application 2019 & 2032
- Table 41: Global Military Actuators Industry Revenue Million Forecast, by Production Analysis 2019 & 2032
- Table 42: Global Military Actuators Industry Revenue Million Forecast, by Consumption Analysis 2019 & 2032
- Table 43: Global Military Actuators Industry Revenue Million Forecast, by Import Market Analysis (Value & Volume) 2019 & 2032
- Table 44: Global Military Actuators Industry Revenue Million Forecast, by Export Market Analysis (Value & Volume) 2019 & 2032
- Table 45: Global Military Actuators Industry Revenue Million Forecast, by Price Trend Analysis 2019 & 2032
- Table 46: Global Military Actuators Industry Revenue Million Forecast, by Country 2019 & 2032
- Table 47: Brazil Military Actuators Industry Revenue (Million) Forecast, by Application 2019 & 2032
- Table 48: Argentina Military Actuators Industry Revenue (Million) Forecast, by Application 2019 & 2032
- Table 49: Rest of South America Military Actuators Industry Revenue (Million) Forecast, by Application 2019 & 2032
- Table 50: Global Military Actuators Industry Revenue Million Forecast, by Production Analysis 2019 & 2032
- Table 51: Global Military Actuators Industry Revenue Million Forecast, by Consumption Analysis 2019 & 2032
- Table 52: Global Military Actuators Industry Revenue Million Forecast, by Import Market Analysis (Value & Volume) 2019 & 2032
- Table 53: Global Military Actuators Industry Revenue Million Forecast, by Export Market Analysis (Value & Volume) 2019 & 2032
- Table 54: Global Military Actuators Industry Revenue Million Forecast, by Price Trend Analysis 2019 & 2032
- Table 55: Global Military Actuators Industry Revenue Million Forecast, by Country 2019 & 2032
- Table 56: United Kingdom Military Actuators Industry Revenue (Million) Forecast, by Application 2019 & 2032
- Table 57: Germany Military Actuators Industry Revenue (Million) Forecast, by Application 2019 & 2032
- Table 58: France Military Actuators Industry Revenue (Million) Forecast, by Application 2019 & 2032
- Table 59: Italy Military Actuators Industry Revenue (Million) Forecast, by Application 2019 & 2032
- Table 60: Spain Military Actuators Industry Revenue (Million) Forecast, by Application 2019 & 2032
- Table 61: Russia Military Actuators Industry Revenue (Million) Forecast, by Application 2019 & 2032
- Table 62: Benelux Military Actuators Industry Revenue (Million) Forecast, by Application 2019 & 2032
- Table 63: Nordics Military Actuators Industry Revenue (Million) Forecast, by Application 2019 & 2032
- Table 64: Rest of Europe Military Actuators Industry Revenue (Million) Forecast, by Application 2019 & 2032
- Table 65: Global Military Actuators Industry Revenue Million Forecast, by Production Analysis 2019 & 2032
- Table 66: Global Military Actuators Industry Revenue Million Forecast, by Consumption Analysis 2019 & 2032
- Table 67: Global Military Actuators Industry Revenue Million Forecast, by Import Market Analysis (Value & Volume) 2019 & 2032
- Table 68: Global Military Actuators Industry Revenue Million Forecast, by Export Market Analysis (Value & Volume) 2019 & 2032
- Table 69: Global Military Actuators Industry Revenue Million Forecast, by Price Trend Analysis 2019 & 2032
- Table 70: Global Military Actuators Industry Revenue Million Forecast, by Country 2019 & 2032
- Table 71: Turkey Military Actuators Industry Revenue (Million) Forecast, by Application 2019 & 2032
- Table 72: Israel Military Actuators Industry Revenue (Million) Forecast, by Application 2019 & 2032
- Table 73: GCC Military Actuators Industry Revenue (Million) Forecast, by Application 2019 & 2032
- Table 74: North Africa Military Actuators Industry Revenue (Million) Forecast, by Application 2019 & 2032
- Table 75: South Africa Military Actuators Industry Revenue (Million) Forecast, by Application 2019 & 2032
- Table 76: Rest of Middle East & Africa Military Actuators Industry Revenue (Million) Forecast, by Application 2019 & 2032
- Table 77: Global Military Actuators Industry Revenue Million Forecast, by Production Analysis 2019 & 2032
- Table 78: Global Military Actuators Industry Revenue Million Forecast, by Consumption Analysis 2019 & 2032
- Table 79: Global Military Actuators Industry Revenue Million Forecast, by Import Market Analysis (Value & Volume) 2019 & 2032
- Table 80: Global Military Actuators Industry Revenue Million Forecast, by Export Market Analysis (Value & Volume) 2019 & 2032
- Table 81: Global Military Actuators Industry Revenue Million Forecast, by Price Trend Analysis 2019 & 2032
- Table 82: Global Military Actuators Industry Revenue Million Forecast, by Country 2019 & 2032
- Table 83: China Military Actuators Industry Revenue (Million) Forecast, by Application 2019 & 2032
- Table 84: India Military Actuators Industry Revenue (Million) Forecast, by Application 2019 & 2032
- Table 85: Japan Military Actuators Industry Revenue (Million) Forecast, by Application 2019 & 2032
- Table 86: South Korea Military Actuators Industry Revenue (Million) Forecast, by Application 2019 & 2032
- Table 87: ASEAN Military Actuators Industry Revenue (Million) Forecast, by Application 2019 & 2032
- Table 88: Oceania Military Actuators Industry Revenue (Million) Forecast, by Application 2019 & 2032
- Table 89: Rest of Asia Pacific Military Actuators Industry Revenue (Million) Forecast, by Application 2019 & 2032
Frequently Asked Questions
1. What is the projected Compound Annual Growth Rate (CAGR) of the Military Actuators Industry?
The projected CAGR is approximately 3.14%.
2. Which companies are prominent players in the Military Actuators Industry?
Key companies in the market include Raytheon Technologies Corporation, AMETEK Inc, Liebherr-International Deutschland GmbH, Creative Motion Control, Nook Industries Inc, Woodward Inc, Moog Inc, Beaver Aerospace & Defense Inc, Kyntronics, Curtiss-Wright Corporation, Triumph Group, Parker Hannifin Corporation, AUMA Riester GmbH & Co KG, Cobham Limite.
3. What are the main segments of the Military Actuators Industry?
The market segments include Production Analysis, Consumption Analysis, Import Market Analysis (Value & Volume), Export Market Analysis (Value & Volume), Price Trend Analysis.
4. Can you provide details about the market size?
The market size is estimated to be USD XX Million as of 2022.
5. What are some drivers contributing to market growth?
; Increasing Number Of Air Passengers; Use Of Portable Electronic Devices.
6. What are the notable trends driving market growth?
The Land Segment is Anticipated to Witness Highest Growth During the Forecast Period.
7. Are there any restraints impacting market growth?
; High Cost Of Connectivity Equipments.
8. Can you provide examples of recent developments in the market?
In June 2021, Kytronics announced that the company joined the Rockwell Automation Technology Partner program, under which the company's SMART Electro-Hydraulic Actuators will be integrated into the program with Rockwell Automation servo motors, drives, and controls.
9. What pricing options are available for accessing the report?
Pricing options include single-user, multi-user, and enterprise licenses priced at USD 4750, USD 5250, and USD 8750 respectively.
10. Is the market size provided in terms of value or volume?
The market size is provided in terms of value, measured in Million.
11. Are there any specific market keywords associated with the report?
Yes, the market keyword associated with the report is "Military Actuators Industry," which aids in identifying and referencing the specific market segment covered.
12. How do I determine which pricing option suits my needs best?
The pricing options vary based on user requirements and access needs. Individual users may opt for single-user licenses, while businesses requiring broader access may choose multi-user or enterprise licenses for cost-effective access to the report.
13. Are there any additional resources or data provided in the Military Actuators Industry report?
While the report offers comprehensive insights, it's advisable to review the specific contents or supplementary materials provided to ascertain if additional resources or data are available.
14. How can I stay updated on further developments or reports in the Military Actuators Industry?
To stay informed about further developments, trends, and reports in the Military Actuators Industry, consider subscribing to industry newsletters, following relevant companies and organizations, or regularly checking reputable industry news sources and publications.
Methodology
Step 1 - Identification of Relevant Samples Size from Population Database


Step 2 - Approaches for Defining Global Market Size (Value, Volume* & Price*)

Note*: In applicable scenarios
Step 3 - Data Sources
Primary Research
- Web Analytics
- Survey Reports
- Research Institute
- Latest Research Reports
- Opinion Leaders
Secondary Research
- Annual Reports
- White Paper
- Latest Press Release
- Industry Association
- Paid Database
- Investor Presentations

Step 4 - Data Triangulation
Involves using different sources of information in order to increase the validity of a study
These sources are likely to be stakeholders in a program - participants, other researchers, program staff, other community members, and so on.
Then we put all data in single framework & apply various statistical tools to find out the dynamic on the market.
During the analysis stage, feedback from the stakeholder groups would be compared to determine areas of agreement as well as areas of divergence
