

Key Insights
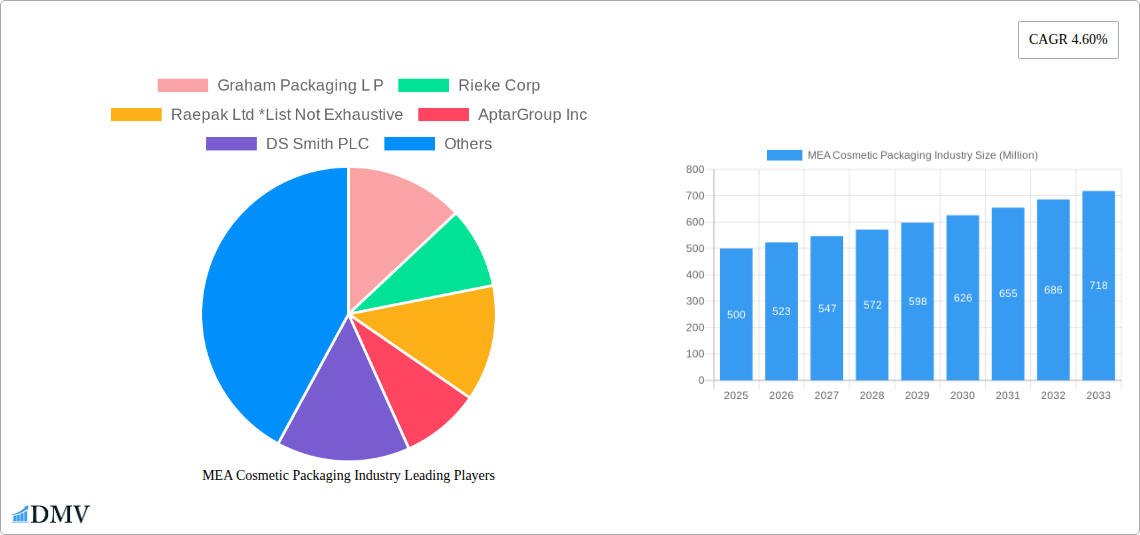
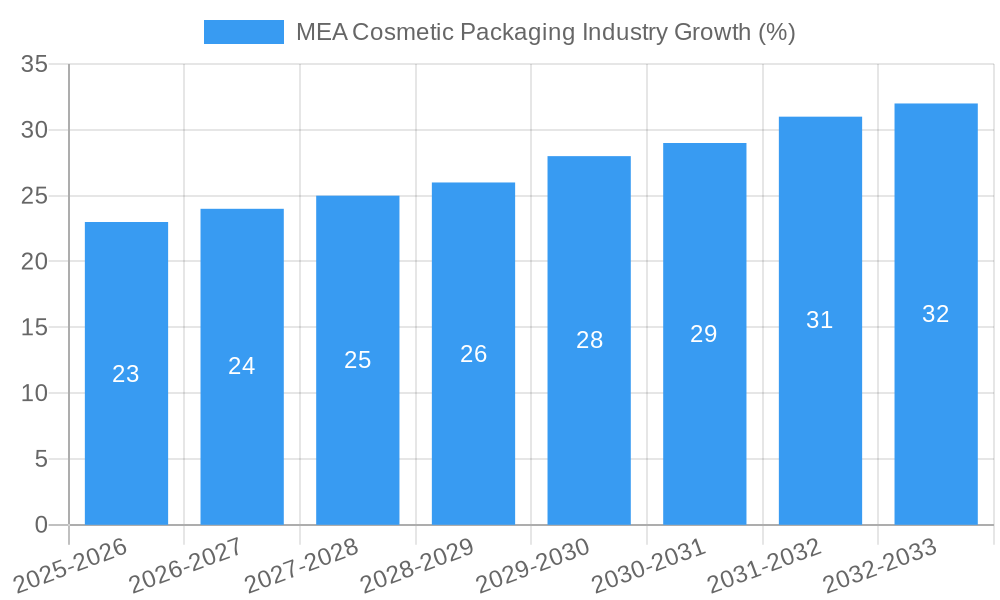
The Middle East and Africa (MEA) cosmetic packaging market is experiencing robust growth, driven by a surge in demand for cosmetics and personal care products across the region. A rising middle class with increased disposable income, coupled with a growing awareness of personal grooming and beauty trends, fuels this expansion. The market's value is estimated to be in the hundreds of millions of dollars in 2025, projecting significant expansion throughout the forecast period (2025-2033) with a Compound Annual Growth Rate (CAGR) of 4.60%. This growth is further propelled by the increasing popularity of e-commerce, leading to innovative packaging solutions for online sales and enhanced consumer experience. The market segmentation reveals a diverse landscape, with plastic packaging holding a significant share due to its cost-effectiveness and versatility. However, growing environmental concerns are driving a shift toward sustainable alternatives like glass and paper-based packaging, presenting lucrative opportunities for eco-conscious brands. The increasing demand for luxury cosmetics and premium packaging in countries like the UAE and Saudi Arabia also contributes to market expansion. Specific product types like plastic bottles and containers, along with folding cartons and corrugated boxes, dominate the market owing to their adaptability to various cosmetic products and brand requirements. The key players in the MEA cosmetic packaging industry are leveraging advanced technologies and sustainable materials to meet the evolving demands of the market, fostering innovation and competition.
The major segments within the MEA cosmetic packaging market – hair care, skin care, color cosmetics, and men's grooming – exhibit varying growth rates, reflecting shifting consumer preferences and product trends. The burgeoning personal care industry in developing economies within the MEA region presents substantial growth potential. However, economic fluctuations and potential regulatory changes in certain countries pose challenges. Furthermore, the cost of raw materials and logistical complexities can influence profitability. Despite these potential restraints, the long-term outlook for the MEA cosmetic packaging market remains positive, driven by factors including rising urbanization, increased tourism, and the continuing expansion of the beauty and personal care sector across the region. Strategic partnerships, mergers, and acquisitions will likely further shape the market dynamics in the coming years. Companies are increasingly focusing on offering customized packaging solutions tailored to specific brands and products to gain a competitive edge.
MEA Cosmetic Packaging Industry: A Comprehensive Market Report (2019-2033)
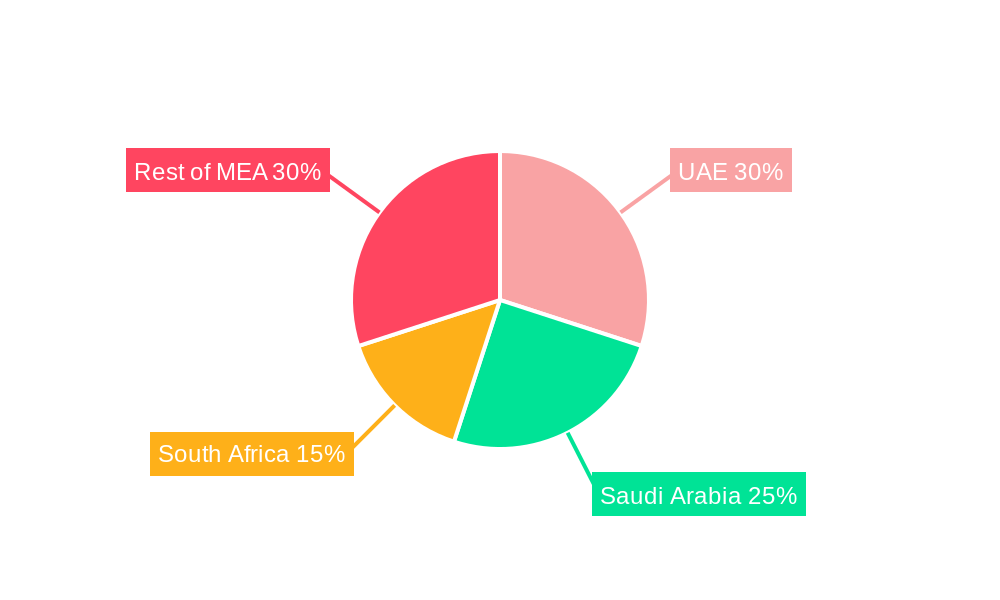
This insightful report provides a detailed analysis of the Middle East and Africa (MEA) cosmetic packaging industry, offering a comprehensive overview of market trends, growth drivers, challenges, and future opportunities. The study covers the period from 2019 to 2033, with a base year of 2025 and a forecast period from 2025 to 2033. The MEA region, encompassing key markets such as the United Arab Emirates, Saudi Arabia, and South Africa, experiences substantial growth in the cosmetics sector, creating significant demand for innovative and sustainable packaging solutions. The report's findings are invaluable for stakeholders including manufacturers, suppliers, investors, and industry professionals seeking to navigate this dynamic market. The total market value is estimated at XXX Million in 2025 and is projected to reach XXX Million by 2033.
MEA Cosmetic Packaging Industry Market Composition & Trends
This section delves into the competitive landscape of the MEA cosmetic packaging market, examining market concentration, innovation, regulatory frameworks, substitute products, and key players' strategic moves. The market share distribution reveals a moderately concentrated landscape, with top players such as Amcor PLC, Berry Global Group (formerly RPC Group PLC), and AptarGroup Inc holding significant positions. However, the presence of several regional players indicates opportunities for new entrants. Innovation is driven by consumer preferences for sustainable and convenient packaging, leading to increased adoption of eco-friendly materials like recycled plastics and biodegradable alternatives.
- Market Concentration: Moderately concentrated, with top 5 players holding approximately xx% market share in 2025.
- Innovation Catalysts: Growing demand for sustainable packaging, e-commerce expansion, and customized packaging solutions.
- Regulatory Landscape: Varying regulations across MEA countries concerning material safety and recyclability are influencing packaging choices.
- Substitute Products: Limited direct substitutes, with focus shifting towards improved material performance and functionality.
- End-User Profiles: Major end-users include leading cosmetic brands, contract manufacturers, and retailers.
- M&A Activities: Significant M&A activity observed in the historical period (2019-2024), with deal values totaling approximately xx Million. Key drivers include expansion into new markets and technology acquisition.
MEA Cosmetic Packaging Industry Industry Evolution
The MEA cosmetic packaging industry has witnessed significant growth from 2019 to 2024, fueled by expanding cosmetic consumption, rising disposable incomes, and the growing popularity of personalized beauty products. Technological advancements, such as advanced printing techniques, lightweighting strategies, and smart packaging solutions, are transforming the industry, enabling manufacturers to enhance product appeal and shelf life. Shifting consumer preferences towards sustainable and ethically sourced materials are driving the demand for eco-friendly packaging options. This evolution is characterized by:
- An average annual growth rate (CAGR) of xx% during the historical period (2019-2024).
- Increased adoption of sustainable materials, with recycled plastic and paper-based packaging witnessing a xx% increase in market share between 2019 and 2024.
- Rising demand for innovative closures and dispensing mechanisms, such as airless pumps and smart dispensers, reflecting evolving consumer preferences.
- Growing investment in automation and digitalization across the packaging value chain, enhancing efficiency and reducing production costs. The predicted CAGR from 2025-2033 is projected to be xx%.
Leading Regions, Countries, or Segments in MEA Cosmetic Packaging Industry
The United Arab Emirates and Saudi Arabia are leading markets within the MEA region, owing to their strong cosmetic industries and high consumer spending on beauty products. Within the segment breakdown, plastic packaging dominates due to its cost-effectiveness and versatility. The skin care segment shows the highest growth, driven by increasing awareness of skincare benefits and the availability of diverse products.
- Key Drivers (UAE & Saudi Arabia):
- High per capita income and rising disposable incomes.
- Significant investment in the cosmetics sector and retail infrastructure.
- Supportive government policies promoting local manufacturing and economic diversification.
- Dominance Factors (Plastic Packaging):
- Cost-effectiveness and wide range of applications.
- Technological advancements offering improved barrier properties and aesthetics.
- Readily available supply chain compared to other materials.
- Growth in Skin Care Segment:
- Growing awareness of skincare benefits and increased consumer preference for premium products.
- Innovation in formulations and packaging to address diverse skin types and concerns.
MEA Cosmetic Packaging Industry Product Innovations
Recent innovations include lightweighting technologies reducing material usage and environmental impact; sustainable materials, such as recycled plastics and bio-based polymers; smart packaging, incorporating features like QR codes for product authentication and enhanced consumer engagement; and advanced printing technologies enhancing visual appeal and brand communication. These innovations create unique selling propositions enhancing brand value and consumer loyalty.
Propelling Factors for MEA Cosmetic Packaging Industry Growth
The MEA cosmetic packaging market is experiencing robust growth fueled by several key factors: A rising middle class and expanding consumer base; the booming e-commerce sector driving demand for e-commerce friendly packaging; increasing focus on sustainability driving demand for eco-friendly alternatives; and government support and infrastructure investments fostering industry development.
Obstacles in the MEA Cosmetic Packaging Industry Market
Challenges include fluctuating raw material prices impacting profitability; supply chain disruptions from geopolitical instability and logistics issues; stringent regulatory compliance requirements, particularly for material safety and labeling; and intense competition from established and emerging players.
Future Opportunities in MEA Cosmetic Packaging Industry
Future growth hinges on exploring new sustainable material options; expansion into niche segments, such as personalized cosmetics and luxury packaging; leveraging digital technologies to enhance customer engagement and traceability; and adapting to evolving consumer preferences towards eco-conscious choices.
Major Players in the MEA Cosmetic Packaging Industry Ecosystem
- Graham Packaging L P
- Rieke Corp
- Raepak Ltd
- AptarGroup Inc
- DS Smith PLC
- Amcor PLC
- Cosmopak Ltd
- Albea SA
- RPC Group PLC (Berry Global Group)
- Silgan Holdings Inc
- Gerresheimer AG
Key Developments in MEA Cosmetic Packaging Industry Industry
- January 2023: Amcor PLC launched a new range of recyclable cosmetic packaging.
- March 2022: Berry Global Group acquired a regional packaging company, expanding its market presence. (Further details require specific information)
- June 2021: New regulations regarding plastic usage in cosmetic packaging implemented in Saudi Arabia. (Further details require specific information)
Strategic MEA Cosmetic Packaging Industry Market Forecast
The MEA cosmetic packaging market is poised for significant growth, driven by several factors. Increasing consumer spending power, coupled with demand for sustainable and innovative packaging solutions, will stimulate market expansion. The rise of e-commerce and the growing preference for personalized beauty products will further propel the market's trajectory. The forecast period (2025-2033) anticipates strong growth, with a CAGR exceeding xx%, indicating substantial market potential for both established and emerging players.
MEA Cosmetic Packaging Industry Segmentation
-
1. Material type
- 1.1. Plastic
- 1.2. Glass
- 1.3. Metal
- 1.4. Paper
-
2. Product Type
- 2.1. Plastic Bottles and Containers
- 2.2. Glass Bottles and Containers
- 2.3. Metal Containers
- 2.4. Folding Cartons
- 2.5. Corrugated Boxes
- 2.6. Tubes and Sticks
- 2.7. Caps and Closures
- 2.8. Pump and Dispenser
- 2.9. Droppers
- 2.10. Ampoules
- 2.11. Flexible Plastic Packaging
-
3. Cosmetic Type
- 3.1. Hair Care
- 3.2. Color Cosmetics
- 3.3. Skin Care
- 3.4. Men's Grooming
- 3.5. Deodorants
- 3.6. Other Co
MEA Cosmetic Packaging Industry Segmentation By Geography
-
1. North America
- 1.1. United States
- 1.2. Canada
- 1.3. Mexico
-
2. South America
- 2.1. Brazil
- 2.2. Argentina
- 2.3. Rest of South America
-
3. Europe
- 3.1. United Kingdom
- 3.2. Germany
- 3.3. France
- 3.4. Italy
- 3.5. Spain
- 3.6. Russia
- 3.7. Benelux
- 3.8. Nordics
- 3.9. Rest of Europe
-
4. Middle East & Africa
- 4.1. Turkey
- 4.2. Israel
- 4.3. GCC
- 4.4. North Africa
- 4.5. South Africa
- 4.6. Rest of Middle East & Africa
-
5. Asia Pacific
- 5.1. China
- 5.2. India
- 5.3. Japan
- 5.4. South Korea
- 5.5. ASEAN
- 5.6. Oceania
- 5.7. Rest of Asia Pacific
MEA Cosmetic Packaging Industry REPORT HIGHLIGHTS
| Aspects | Details |
|---|---|
| Study Period | 2019-2033 |
| Base Year | 2024 |
| Estimated Year | 2025 |
| Forecast Period | 2025-2033 |
| Historical Period | 2019-2024 |
| Growth Rate | CAGR of 4.60% from 2019-2033 |
| Segmentation |
|
Table of Contents
- 1. Introduction
- 1.1. Research Scope
- 1.2. Market Segmentation
- 1.3. Research Methodology
- 1.4. Definitions and Assumptions
- 2. Executive Summary
- 2.1. Introduction
- 3. Market Dynamics
- 3.1. Introduction
- 3.2. Market Drivers
- 3.2.1. ; Increasing Focus on Innovation and Attractive Packaging
- 3.3. Market Restrains
- 3.3.1. ; Growing Sustainability Concerns
- 3.4. Market Trends
- 3.4.1. Sustainable Packaging to Drive the Market Growth
- 4. Market Factor Analysis
- 4.1. Porters Five Forces
- 4.2. Supply/Value Chain
- 4.3. PESTEL analysis
- 4.4. Market Entropy
- 4.5. Patent/Trademark Analysis
- 5. Global MEA Cosmetic Packaging Industry Analysis, Insights and Forecast, 2019-2031
- 5.1. Market Analysis, Insights and Forecast - by Material type
- 5.1.1. Plastic
- 5.1.2. Glass
- 5.1.3. Metal
- 5.1.4. Paper
- 5.2. Market Analysis, Insights and Forecast - by Product Type
- 5.2.1. Plastic Bottles and Containers
- 5.2.2. Glass Bottles and Containers
- 5.2.3. Metal Containers
- 5.2.4. Folding Cartons
- 5.2.5. Corrugated Boxes
- 5.2.6. Tubes and Sticks
- 5.2.7. Caps and Closures
- 5.2.8. Pump and Dispenser
- 5.2.9. Droppers
- 5.2.10. Ampoules
- 5.2.11. Flexible Plastic Packaging
- 5.3. Market Analysis, Insights and Forecast - by Cosmetic Type
- 5.3.1. Hair Care
- 5.3.2. Color Cosmetics
- 5.3.3. Skin Care
- 5.3.4. Men's Grooming
- 5.3.5. Deodorants
- 5.3.6. Other Co
- 5.4. Market Analysis, Insights and Forecast - by Region
- 5.4.1. North America
- 5.4.2. South America
- 5.4.3. Europe
- 5.4.4. Middle East & Africa
- 5.4.5. Asia Pacific
- 5.1. Market Analysis, Insights and Forecast - by Material type
- 6. North America MEA Cosmetic Packaging Industry Analysis, Insights and Forecast, 2019-2031
- 6.1. Market Analysis, Insights and Forecast - by Material type
- 6.1.1. Plastic
- 6.1.2. Glass
- 6.1.3. Metal
- 6.1.4. Paper
- 6.2. Market Analysis, Insights and Forecast - by Product Type
- 6.2.1. Plastic Bottles and Containers
- 6.2.2. Glass Bottles and Containers
- 6.2.3. Metal Containers
- 6.2.4. Folding Cartons
- 6.2.5. Corrugated Boxes
- 6.2.6. Tubes and Sticks
- 6.2.7. Caps and Closures
- 6.2.8. Pump and Dispenser
- 6.2.9. Droppers
- 6.2.10. Ampoules
- 6.2.11. Flexible Plastic Packaging
- 6.3. Market Analysis, Insights and Forecast - by Cosmetic Type
- 6.3.1. Hair Care
- 6.3.2. Color Cosmetics
- 6.3.3. Skin Care
- 6.3.4. Men's Grooming
- 6.3.5. Deodorants
- 6.3.6. Other Co
- 6.1. Market Analysis, Insights and Forecast - by Material type
- 7. South America MEA Cosmetic Packaging Industry Analysis, Insights and Forecast, 2019-2031
- 7.1. Market Analysis, Insights and Forecast - by Material type
- 7.1.1. Plastic
- 7.1.2. Glass
- 7.1.3. Metal
- 7.1.4. Paper
- 7.2. Market Analysis, Insights and Forecast - by Product Type
- 7.2.1. Plastic Bottles and Containers
- 7.2.2. Glass Bottles and Containers
- 7.2.3. Metal Containers
- 7.2.4. Folding Cartons
- 7.2.5. Corrugated Boxes
- 7.2.6. Tubes and Sticks
- 7.2.7. Caps and Closures
- 7.2.8. Pump and Dispenser
- 7.2.9. Droppers
- 7.2.10. Ampoules
- 7.2.11. Flexible Plastic Packaging
- 7.3. Market Analysis, Insights and Forecast - by Cosmetic Type
- 7.3.1. Hair Care
- 7.3.2. Color Cosmetics
- 7.3.3. Skin Care
- 7.3.4. Men's Grooming
- 7.3.5. Deodorants
- 7.3.6. Other Co
- 7.1. Market Analysis, Insights and Forecast - by Material type
- 8. Europe MEA Cosmetic Packaging Industry Analysis, Insights and Forecast, 2019-2031
- 8.1. Market Analysis, Insights and Forecast - by Material type
- 8.1.1. Plastic
- 8.1.2. Glass
- 8.1.3. Metal
- 8.1.4. Paper
- 8.2. Market Analysis, Insights and Forecast - by Product Type
- 8.2.1. Plastic Bottles and Containers
- 8.2.2. Glass Bottles and Containers
- 8.2.3. Metal Containers
- 8.2.4. Folding Cartons
- 8.2.5. Corrugated Boxes
- 8.2.6. Tubes and Sticks
- 8.2.7. Caps and Closures
- 8.2.8. Pump and Dispenser
- 8.2.9. Droppers
- 8.2.10. Ampoules
- 8.2.11. Flexible Plastic Packaging
- 8.3. Market Analysis, Insights and Forecast - by Cosmetic Type
- 8.3.1. Hair Care
- 8.3.2. Color Cosmetics
- 8.3.3. Skin Care
- 8.3.4. Men's Grooming
- 8.3.5. Deodorants
- 8.3.6. Other Co
- 8.1. Market Analysis, Insights and Forecast - by Material type
- 9. Middle East & Africa MEA Cosmetic Packaging Industry Analysis, Insights and Forecast, 2019-2031
- 9.1. Market Analysis, Insights and Forecast - by Material type
- 9.1.1. Plastic
- 9.1.2. Glass
- 9.1.3. Metal
- 9.1.4. Paper
- 9.2. Market Analysis, Insights and Forecast - by Product Type
- 9.2.1. Plastic Bottles and Containers
- 9.2.2. Glass Bottles and Containers
- 9.2.3. Metal Containers
- 9.2.4. Folding Cartons
- 9.2.5. Corrugated Boxes
- 9.2.6. Tubes and Sticks
- 9.2.7. Caps and Closures
- 9.2.8. Pump and Dispenser
- 9.2.9. Droppers
- 9.2.10. Ampoules
- 9.2.11. Flexible Plastic Packaging
- 9.3. Market Analysis, Insights and Forecast - by Cosmetic Type
- 9.3.1. Hair Care
- 9.3.2. Color Cosmetics
- 9.3.3. Skin Care
- 9.3.4. Men's Grooming
- 9.3.5. Deodorants
- 9.3.6. Other Co
- 9.1. Market Analysis, Insights and Forecast - by Material type
- 10. Asia Pacific MEA Cosmetic Packaging Industry Analysis, Insights and Forecast, 2019-2031
- 10.1. Market Analysis, Insights and Forecast - by Material type
- 10.1.1. Plastic
- 10.1.2. Glass
- 10.1.3. Metal
- 10.1.4. Paper
- 10.2. Market Analysis, Insights and Forecast - by Product Type
- 10.2.1. Plastic Bottles and Containers
- 10.2.2. Glass Bottles and Containers
- 10.2.3. Metal Containers
- 10.2.4. Folding Cartons
- 10.2.5. Corrugated Boxes
- 10.2.6. Tubes and Sticks
- 10.2.7. Caps and Closures
- 10.2.8. Pump and Dispenser
- 10.2.9. Droppers
- 10.2.10. Ampoules
- 10.2.11. Flexible Plastic Packaging
- 10.3. Market Analysis, Insights and Forecast - by Cosmetic Type
- 10.3.1. Hair Care
- 10.3.2. Color Cosmetics
- 10.3.3. Skin Care
- 10.3.4. Men's Grooming
- 10.3.5. Deodorants
- 10.3.6. Other Co
- 10.1. Market Analysis, Insights and Forecast - by Material type
- 11. Competitive Analysis
- 11.1. Global Market Share Analysis 2024
- 11.2. Company Profiles
- 11.2.1 Graham Packaging L P
- 11.2.1.1. Overview
- 11.2.1.2. Products
- 11.2.1.3. SWOT Analysis
- 11.2.1.4. Recent Developments
- 11.2.1.5. Financials (Based on Availability)
- 11.2.2 Rieke Corp
- 11.2.2.1. Overview
- 11.2.2.2. Products
- 11.2.2.3. SWOT Analysis
- 11.2.2.4. Recent Developments
- 11.2.2.5. Financials (Based on Availability)
- 11.2.3 Raepak Ltd *List Not Exhaustive
- 11.2.3.1. Overview
- 11.2.3.2. Products
- 11.2.3.3. SWOT Analysis
- 11.2.3.4. Recent Developments
- 11.2.3.5. Financials (Based on Availability)
- 11.2.4 AptarGroup Inc
- 11.2.4.1. Overview
- 11.2.4.2. Products
- 11.2.4.3. SWOT Analysis
- 11.2.4.4. Recent Developments
- 11.2.4.5. Financials (Based on Availability)
- 11.2.5 DS Smith PLC
- 11.2.5.1. Overview
- 11.2.5.2. Products
- 11.2.5.3. SWOT Analysis
- 11.2.5.4. Recent Developments
- 11.2.5.5. Financials (Based on Availability)
- 11.2.6 Amcor PLC
- 11.2.6.1. Overview
- 11.2.6.2. Products
- 11.2.6.3. SWOT Analysis
- 11.2.6.4. Recent Developments
- 11.2.6.5. Financials (Based on Availability)
- 11.2.7 Cosmopak Ltd
- 11.2.7.1. Overview
- 11.2.7.2. Products
- 11.2.7.3. SWOT Analysis
- 11.2.7.4. Recent Developments
- 11.2.7.5. Financials (Based on Availability)
- 11.2.8 Albea SA
- 11.2.8.1. Overview
- 11.2.8.2. Products
- 11.2.8.3. SWOT Analysis
- 11.2.8.4. Recent Developments
- 11.2.8.5. Financials (Based on Availability)
- 11.2.9 RPC Group PLC (Berry Global Group)
- 11.2.9.1. Overview
- 11.2.9.2. Products
- 11.2.9.3. SWOT Analysis
- 11.2.9.4. Recent Developments
- 11.2.9.5. Financials (Based on Availability)
- 11.2.10 Silgan Holdings Inc
- 11.2.10.1. Overview
- 11.2.10.2. Products
- 11.2.10.3. SWOT Analysis
- 11.2.10.4. Recent Developments
- 11.2.10.5. Financials (Based on Availability)
- 11.2.11 Gerresheimer AG
- 11.2.11.1. Overview
- 11.2.11.2. Products
- 11.2.11.3. SWOT Analysis
- 11.2.11.4. Recent Developments
- 11.2.11.5. Financials (Based on Availability)
- 11.2.1 Graham Packaging L P
List of Figures
- Figure 1: Global MEA Cosmetic Packaging Industry Revenue Breakdown (Million, %) by Region 2024 & 2032
- Figure 2: North America MEA Cosmetic Packaging Industry Revenue (Million), by Material type 2024 & 2032
- Figure 3: North America MEA Cosmetic Packaging Industry Revenue Share (%), by Material type 2024 & 2032
- Figure 4: North America MEA Cosmetic Packaging Industry Revenue (Million), by Product Type 2024 & 2032
- Figure 5: North America MEA Cosmetic Packaging Industry Revenue Share (%), by Product Type 2024 & 2032
- Figure 6: North America MEA Cosmetic Packaging Industry Revenue (Million), by Cosmetic Type 2024 & 2032
- Figure 7: North America MEA Cosmetic Packaging Industry Revenue Share (%), by Cosmetic Type 2024 & 2032
- Figure 8: North America MEA Cosmetic Packaging Industry Revenue (Million), by Country 2024 & 2032
- Figure 9: North America MEA Cosmetic Packaging Industry Revenue Share (%), by Country 2024 & 2032
- Figure 10: South America MEA Cosmetic Packaging Industry Revenue (Million), by Material type 2024 & 2032
- Figure 11: South America MEA Cosmetic Packaging Industry Revenue Share (%), by Material type 2024 & 2032
- Figure 12: South America MEA Cosmetic Packaging Industry Revenue (Million), by Product Type 2024 & 2032
- Figure 13: South America MEA Cosmetic Packaging Industry Revenue Share (%), by Product Type 2024 & 2032
- Figure 14: South America MEA Cosmetic Packaging Industry Revenue (Million), by Cosmetic Type 2024 & 2032
- Figure 15: South America MEA Cosmetic Packaging Industry Revenue Share (%), by Cosmetic Type 2024 & 2032
- Figure 16: South America MEA Cosmetic Packaging Industry Revenue (Million), by Country 2024 & 2032
- Figure 17: South America MEA Cosmetic Packaging Industry Revenue Share (%), by Country 2024 & 2032
- Figure 18: Europe MEA Cosmetic Packaging Industry Revenue (Million), by Material type 2024 & 2032
- Figure 19: Europe MEA Cosmetic Packaging Industry Revenue Share (%), by Material type 2024 & 2032
- Figure 20: Europe MEA Cosmetic Packaging Industry Revenue (Million), by Product Type 2024 & 2032
- Figure 21: Europe MEA Cosmetic Packaging Industry Revenue Share (%), by Product Type 2024 & 2032
- Figure 22: Europe MEA Cosmetic Packaging Industry Revenue (Million), by Cosmetic Type 2024 & 2032
- Figure 23: Europe MEA Cosmetic Packaging Industry Revenue Share (%), by Cosmetic Type 2024 & 2032
- Figure 24: Europe MEA Cosmetic Packaging Industry Revenue (Million), by Country 2024 & 2032
- Figure 25: Europe MEA Cosmetic Packaging Industry Revenue Share (%), by Country 2024 & 2032
- Figure 26: Middle East & Africa MEA Cosmetic Packaging Industry Revenue (Million), by Material type 2024 & 2032
- Figure 27: Middle East & Africa MEA Cosmetic Packaging Industry Revenue Share (%), by Material type 2024 & 2032
- Figure 28: Middle East & Africa MEA Cosmetic Packaging Industry Revenue (Million), by Product Type 2024 & 2032
- Figure 29: Middle East & Africa MEA Cosmetic Packaging Industry Revenue Share (%), by Product Type 2024 & 2032
- Figure 30: Middle East & Africa MEA Cosmetic Packaging Industry Revenue (Million), by Cosmetic Type 2024 & 2032
- Figure 31: Middle East & Africa MEA Cosmetic Packaging Industry Revenue Share (%), by Cosmetic Type 2024 & 2032
- Figure 32: Middle East & Africa MEA Cosmetic Packaging Industry Revenue (Million), by Country 2024 & 2032
- Figure 33: Middle East & Africa MEA Cosmetic Packaging Industry Revenue Share (%), by Country 2024 & 2032
- Figure 34: Asia Pacific MEA Cosmetic Packaging Industry Revenue (Million), by Material type 2024 & 2032
- Figure 35: Asia Pacific MEA Cosmetic Packaging Industry Revenue Share (%), by Material type 2024 & 2032
- Figure 36: Asia Pacific MEA Cosmetic Packaging Industry Revenue (Million), by Product Type 2024 & 2032
- Figure 37: Asia Pacific MEA Cosmetic Packaging Industry Revenue Share (%), by Product Type 2024 & 2032
- Figure 38: Asia Pacific MEA Cosmetic Packaging Industry Revenue (Million), by Cosmetic Type 2024 & 2032
- Figure 39: Asia Pacific MEA Cosmetic Packaging Industry Revenue Share (%), by Cosmetic Type 2024 & 2032
- Figure 40: Asia Pacific MEA Cosmetic Packaging Industry Revenue (Million), by Country 2024 & 2032
- Figure 41: Asia Pacific MEA Cosmetic Packaging Industry Revenue Share (%), by Country 2024 & 2032
List of Tables
- Table 1: Global MEA Cosmetic Packaging Industry Revenue Million Forecast, by Region 2019 & 2032
- Table 2: Global MEA Cosmetic Packaging Industry Revenue Million Forecast, by Material type 2019 & 2032
- Table 3: Global MEA Cosmetic Packaging Industry Revenue Million Forecast, by Product Type 2019 & 2032
- Table 4: Global MEA Cosmetic Packaging Industry Revenue Million Forecast, by Cosmetic Type 2019 & 2032
- Table 5: Global MEA Cosmetic Packaging Industry Revenue Million Forecast, by Region 2019 & 2032
- Table 6: Global MEA Cosmetic Packaging Industry Revenue Million Forecast, by Material type 2019 & 2032
- Table 7: Global MEA Cosmetic Packaging Industry Revenue Million Forecast, by Product Type 2019 & 2032
- Table 8: Global MEA Cosmetic Packaging Industry Revenue Million Forecast, by Cosmetic Type 2019 & 2032
- Table 9: Global MEA Cosmetic Packaging Industry Revenue Million Forecast, by Country 2019 & 2032
- Table 10: United States MEA Cosmetic Packaging Industry Revenue (Million) Forecast, by Application 2019 & 2032
- Table 11: Canada MEA Cosmetic Packaging Industry Revenue (Million) Forecast, by Application 2019 & 2032
- Table 12: Mexico MEA Cosmetic Packaging Industry Revenue (Million) Forecast, by Application 2019 & 2032
- Table 13: Global MEA Cosmetic Packaging Industry Revenue Million Forecast, by Material type 2019 & 2032
- Table 14: Global MEA Cosmetic Packaging Industry Revenue Million Forecast, by Product Type 2019 & 2032
- Table 15: Global MEA Cosmetic Packaging Industry Revenue Million Forecast, by Cosmetic Type 2019 & 2032
- Table 16: Global MEA Cosmetic Packaging Industry Revenue Million Forecast, by Country 2019 & 2032
- Table 17: Brazil MEA Cosmetic Packaging Industry Revenue (Million) Forecast, by Application 2019 & 2032
- Table 18: Argentina MEA Cosmetic Packaging Industry Revenue (Million) Forecast, by Application 2019 & 2032
- Table 19: Rest of South America MEA Cosmetic Packaging Industry Revenue (Million) Forecast, by Application 2019 & 2032
- Table 20: Global MEA Cosmetic Packaging Industry Revenue Million Forecast, by Material type 2019 & 2032
- Table 21: Global MEA Cosmetic Packaging Industry Revenue Million Forecast, by Product Type 2019 & 2032
- Table 22: Global MEA Cosmetic Packaging Industry Revenue Million Forecast, by Cosmetic Type 2019 & 2032
- Table 23: Global MEA Cosmetic Packaging Industry Revenue Million Forecast, by Country 2019 & 2032
- Table 24: United Kingdom MEA Cosmetic Packaging Industry Revenue (Million) Forecast, by Application 2019 & 2032
- Table 25: Germany MEA Cosmetic Packaging Industry Revenue (Million) Forecast, by Application 2019 & 2032
- Table 26: France MEA Cosmetic Packaging Industry Revenue (Million) Forecast, by Application 2019 & 2032
- Table 27: Italy MEA Cosmetic Packaging Industry Revenue (Million) Forecast, by Application 2019 & 2032
- Table 28: Spain MEA Cosmetic Packaging Industry Revenue (Million) Forecast, by Application 2019 & 2032
- Table 29: Russia MEA Cosmetic Packaging Industry Revenue (Million) Forecast, by Application 2019 & 2032
- Table 30: Benelux MEA Cosmetic Packaging Industry Revenue (Million) Forecast, by Application 2019 & 2032
- Table 31: Nordics MEA Cosmetic Packaging Industry Revenue (Million) Forecast, by Application 2019 & 2032
- Table 32: Rest of Europe MEA Cosmetic Packaging Industry Revenue (Million) Forecast, by Application 2019 & 2032
- Table 33: Global MEA Cosmetic Packaging Industry Revenue Million Forecast, by Material type 2019 & 2032
- Table 34: Global MEA Cosmetic Packaging Industry Revenue Million Forecast, by Product Type 2019 & 2032
- Table 35: Global MEA Cosmetic Packaging Industry Revenue Million Forecast, by Cosmetic Type 2019 & 2032
- Table 36: Global MEA Cosmetic Packaging Industry Revenue Million Forecast, by Country 2019 & 2032
- Table 37: Turkey MEA Cosmetic Packaging Industry Revenue (Million) Forecast, by Application 2019 & 2032
- Table 38: Israel MEA Cosmetic Packaging Industry Revenue (Million) Forecast, by Application 2019 & 2032
- Table 39: GCC MEA Cosmetic Packaging Industry Revenue (Million) Forecast, by Application 2019 & 2032
- Table 40: North Africa MEA Cosmetic Packaging Industry Revenue (Million) Forecast, by Application 2019 & 2032
- Table 41: South Africa MEA Cosmetic Packaging Industry Revenue (Million) Forecast, by Application 2019 & 2032
- Table 42: Rest of Middle East & Africa MEA Cosmetic Packaging Industry Revenue (Million) Forecast, by Application 2019 & 2032
- Table 43: Global MEA Cosmetic Packaging Industry Revenue Million Forecast, by Material type 2019 & 2032
- Table 44: Global MEA Cosmetic Packaging Industry Revenue Million Forecast, by Product Type 2019 & 2032
- Table 45: Global MEA Cosmetic Packaging Industry Revenue Million Forecast, by Cosmetic Type 2019 & 2032
- Table 46: Global MEA Cosmetic Packaging Industry Revenue Million Forecast, by Country 2019 & 2032
- Table 47: China MEA Cosmetic Packaging Industry Revenue (Million) Forecast, by Application 2019 & 2032
- Table 48: India MEA Cosmetic Packaging Industry Revenue (Million) Forecast, by Application 2019 & 2032
- Table 49: Japan MEA Cosmetic Packaging Industry Revenue (Million) Forecast, by Application 2019 & 2032
- Table 50: South Korea MEA Cosmetic Packaging Industry Revenue (Million) Forecast, by Application 2019 & 2032
- Table 51: ASEAN MEA Cosmetic Packaging Industry Revenue (Million) Forecast, by Application 2019 & 2032
- Table 52: Oceania MEA Cosmetic Packaging Industry Revenue (Million) Forecast, by Application 2019 & 2032
- Table 53: Rest of Asia Pacific MEA Cosmetic Packaging Industry Revenue (Million) Forecast, by Application 2019 & 2032
Frequently Asked Questions
1. What is the projected Compound Annual Growth Rate (CAGR) of the MEA Cosmetic Packaging Industry?
The projected CAGR is approximately 4.60%.
2. Which companies are prominent players in the MEA Cosmetic Packaging Industry?
Key companies in the market include Graham Packaging L P, Rieke Corp, Raepak Ltd *List Not Exhaustive, AptarGroup Inc, DS Smith PLC, Amcor PLC, Cosmopak Ltd, Albea SA, RPC Group PLC (Berry Global Group), Silgan Holdings Inc, Gerresheimer AG.
3. What are the main segments of the MEA Cosmetic Packaging Industry?
The market segments include Material type, Product Type, Cosmetic Type.
4. Can you provide details about the market size?
The market size is estimated to be USD XX Million as of 2022.
5. What are some drivers contributing to market growth?
; Increasing Focus on Innovation and Attractive Packaging.
6. What are the notable trends driving market growth?
Sustainable Packaging to Drive the Market Growth.
7. Are there any restraints impacting market growth?
; Growing Sustainability Concerns.
8. Can you provide examples of recent developments in the market?
N/A
9. What pricing options are available for accessing the report?
Pricing options include single-user, multi-user, and enterprise licenses priced at USD 3800, USD 4500, and USD 5800 respectively.
10. Is the market size provided in terms of value or volume?
The market size is provided in terms of value, measured in Million.
11. Are there any specific market keywords associated with the report?
Yes, the market keyword associated with the report is "MEA Cosmetic Packaging Industry," which aids in identifying and referencing the specific market segment covered.
12. How do I determine which pricing option suits my needs best?
The pricing options vary based on user requirements and access needs. Individual users may opt for single-user licenses, while businesses requiring broader access may choose multi-user or enterprise licenses for cost-effective access to the report.
13. Are there any additional resources or data provided in the MEA Cosmetic Packaging Industry report?
While the report offers comprehensive insights, it's advisable to review the specific contents or supplementary materials provided to ascertain if additional resources or data are available.
14. How can I stay updated on further developments or reports in the MEA Cosmetic Packaging Industry?
To stay informed about further developments, trends, and reports in the MEA Cosmetic Packaging Industry, consider subscribing to industry newsletters, following relevant companies and organizations, or regularly checking reputable industry news sources and publications.
Methodology
Step 1 - Identification of Relevant Samples Size from Population Database


Step 2 - Approaches for Defining Global Market Size (Value, Volume* & Price*)

Note*: In applicable scenarios
Step 3 - Data Sources
Primary Research
- Web Analytics
- Survey Reports
- Research Institute
- Latest Research Reports
- Opinion Leaders
Secondary Research
- Annual Reports
- White Paper
- Latest Press Release
- Industry Association
- Paid Database
- Investor Presentations

Step 4 - Data Triangulation
Involves using different sources of information in order to increase the validity of a study
These sources are likely to be stakeholders in a program - participants, other researchers, program staff, other community members, and so on.
Then we put all data in single framework & apply various statistical tools to find out the dynamic on the market.
During the analysis stage, feedback from the stakeholder groups would be compared to determine areas of agreement as well as areas of divergence
