

Key Insights
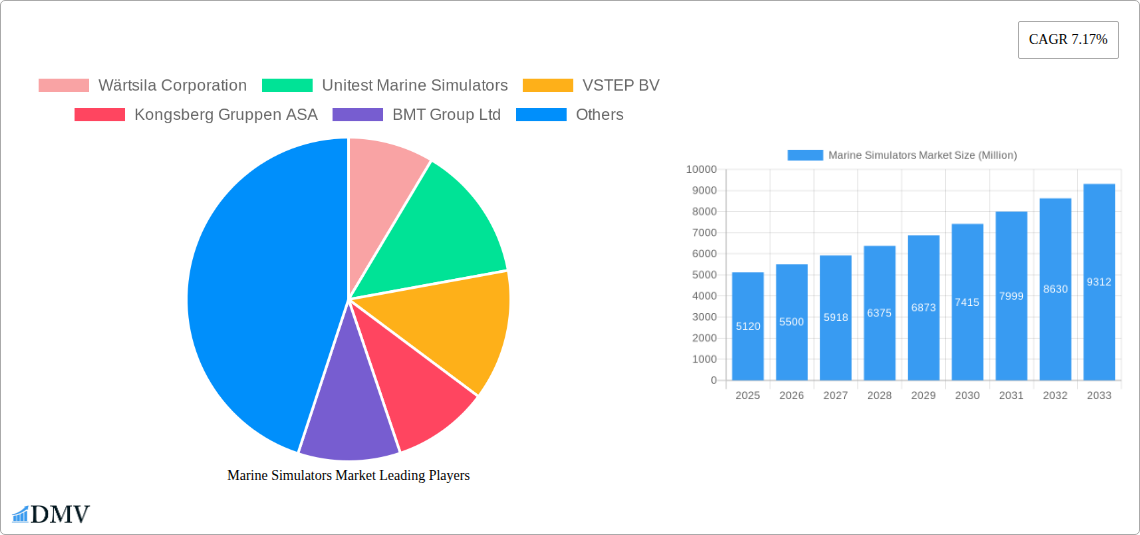
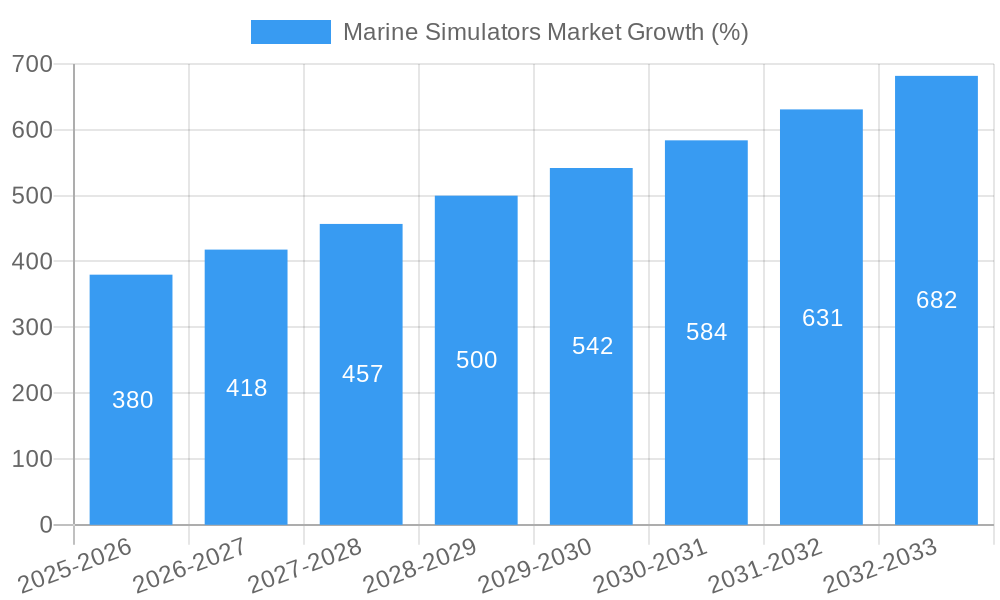
The global marine simulators market, valued at $5.12 billion in 2025, is projected to experience robust growth, driven by increasing demand for enhanced maritime training and safety regulations. The market's Compound Annual Growth Rate (CAGR) of 7.17% from 2025 to 2033 indicates a significant expansion, fueled by several key factors. The rising complexity of modern vessels, coupled with the need for efficient crew training to meet stringent international maritime standards, is a major catalyst. Technological advancements in simulator technology, such as the integration of virtual reality (VR) and augmented reality (AR), are enhancing training effectiveness and realism, further stimulating market growth. Furthermore, the growing adoption of simulator-based training for various maritime operations, including navigation, cargo handling, and emergency response, is contributing to the market's expansion. The market is segmented by simulator type (full mission, part-task, etc.), application (training, research, etc.), and region. Leading companies such as Wärtsilä Corporation, Kongsberg Gruppen ASA, and VSTEP BV are investing heavily in research and development to enhance product offerings and consolidate their market positions.
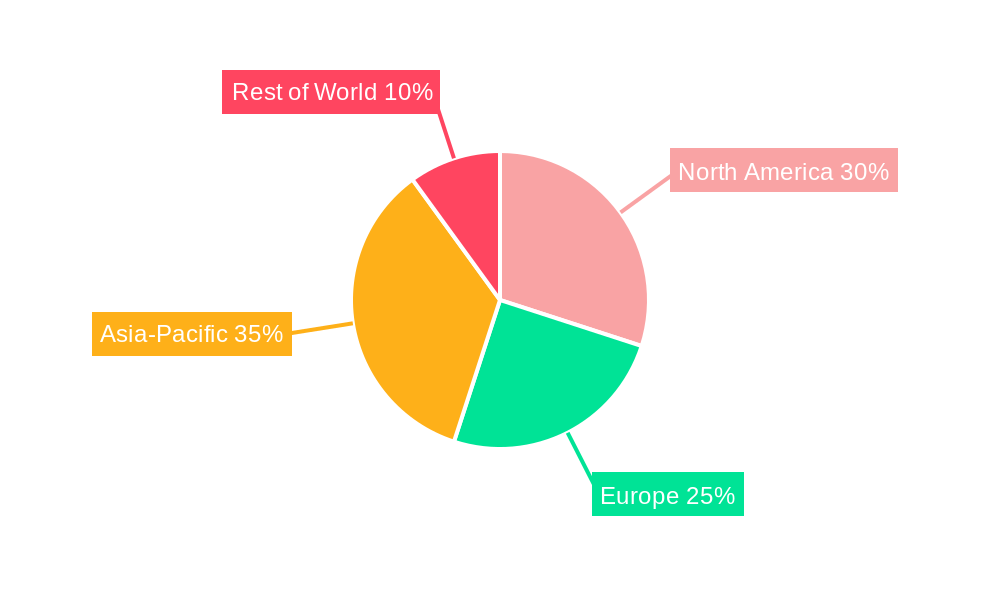
The market's growth, however, faces some challenges. High initial investment costs associated with acquiring and maintaining advanced simulators can pose a barrier to entry for smaller training institutions. Furthermore, the need for continuous software updates and technical support can lead to ongoing operational expenses. Despite these restraints, the long-term benefits of improved crew proficiency, reduced operational risks, and enhanced maritime safety outweigh the initial investment costs, ensuring sustainable market expansion. The integration of advanced technologies, coupled with the increasing focus on efficient and safe maritime operations, positions the marine simulators market for significant growth in the coming years, particularly in regions with expanding maritime industries and stricter safety regulations. We project substantial growth in Asia-Pacific and North America due to the increasing number of shipping activities and stringent safety regulations in these regions.
Marine Simulators Market: A Comprehensive Market Report (2019-2033)
This insightful report provides a detailed analysis of the global Marine Simulators Market, offering a comprehensive overview of market trends, leading players, and future growth prospects. The study period spans from 2019 to 2033, with 2025 serving as the base and estimated year. This report is essential for stakeholders, investors, and industry professionals seeking to understand the dynamics and potential of this rapidly evolving market. The market size is projected to reach xx Million by 2033.
Marine Simulators Market Composition & Trends
This section dives deep into the competitive landscape of the marine simulators market, examining market concentration, innovation drivers, regulatory frameworks, substitute products, end-user profiles, and mergers and acquisitions (M&A) activities. The report analyzes the market share distribution among key players, revealing a moderately concentrated market with several dominant players holding significant shares. For example, Wärtsilä Corporation and Kongsberg Gruppen ASA are likely to hold a significant portion, estimated at approximately xx% and yy% respectively, of the market share, while others such as VSTEP BV and BMT Group Ltd contribute substantially. M&A activities are analyzed, with a focus on deal values and their impact on market consolidation. The report includes an examination of innovative technologies driving market growth, including augmented reality (AR) and virtual reality (VR) integration and the role of regulatory bodies in shaping market standards and safety protocols. Substitute products are considered, along with their competitive advantages and limitations. The analysis also highlights trends within end-user segments, such as the growing demand from the commercial shipping sector and the naval forces.
- Market Concentration: Moderately concentrated, with several key players dominating.
- Innovation Catalysts: AR/VR integration, advanced simulation technologies.
- Regulatory Landscape: Stringent safety standards and compliance requirements.
- Substitute Products: Limited direct substitutes; competition primarily from alternative training methods.
- End-User Profiles: Commercial shipping, naval forces, educational institutions.
- M&A Activities: Analysis of significant deals and their implications (Deal values: xx Million in total estimated from 2019 to 2024).
Marine Simulators Market Industry Evolution
This section meticulously tracks the evolution of the marine simulators market, analyzing market growth trajectories from 2019 to 2024 and projecting future trends through 2033. We examine technological advancements, including the integration of advanced simulation technologies and software updates leading to improved realism and training effectiveness. The report also explores evolving consumer demands, such as the increasing need for customized training solutions and the growing preference for simulator-based training over traditional methods. The analysis incorporates data points such as compound annual growth rates (CAGR) and adoption rates of new technologies to illustrate market growth patterns. The shift towards more sophisticated and integrated simulator systems, incorporating bridge systems and advanced sensor simulations, is analyzed alongside the growth of e-learning platforms that integrate simulator training. The impact of global economic conditions and the cyclical nature of shipbuilding and shipping on market growth is also examined.
Leading Regions, Countries, or Segments in Marine Simulators Market
This section identifies the dominant regions and segments within the marine simulators market. The analysis reveals that [Specific Region, e.g., North America or Europe] holds the leading position, driven by factors such as robust maritime industries, stringent safety regulations, and substantial investments in maritime training infrastructure.
Key Drivers (Leading Region):
- High maritime activity and commercial shipping volumes.
- Stringent safety regulations and training mandates.
- Significant investments in maritime training facilities.
- Presence of major simulator manufacturers and providers.
Dominance Factors: Paragraph detailing in-depth analysis of why this region is dominant, for example, the presence of key manufacturers, high government investment in maritime safety, and a high number of shipping companies requiring advanced training programs.
Marine Simulators Market Product Innovations
Recent product innovations have significantly enhanced the realism and effectiveness of marine simulators. The incorporation of augmented reality (AR) and virtual reality (VR) technologies allows for immersive and interactive training experiences, significantly improving crew competency. Advanced features such as dynamic weather simulation, accurate vessel modelling and complex scenarios further enhance training quality. These improvements lead to higher learning outcomes and increased safety standards across various maritime sectors. Key innovations include the introduction of more realistic bridge simulation systems, more advanced hydrodynamics models, and improved haptic feedback systems for a more immersive user experience.
Propelling Factors for Marine Simulators Market Growth
Several factors are driving the growth of the marine simulators market. The rising demand for skilled maritime professionals, coupled with stringent safety regulations and the need for cost-effective training solutions, are key drivers. Technological advancements, such as the integration of AR/VR and improved simulation accuracy, are also boosting market growth. Moreover, governmental investments in maritime training infrastructure and increased focus on enhancing maritime safety are further propelling market expansion.
Obstacles in the Marine Simulators Market
The market faces challenges such as high initial investment costs for advanced simulators, the need for continuous software updates, and the potential for supply chain disruptions impacting component availability. Competitive pressure from established players and emerging technologies also presents obstacles. The regulatory landscape, while driving demand, can also create complexity and increase the cost of compliance for manufacturers and users.
Future Opportunities in Marine Simulators Market
Emerging opportunities include expanding into new markets, particularly in developing economies with growing maritime industries. The development and integration of new technologies, such as AI-powered training modules and advanced simulation platforms capable of simulating more complex scenarios, presents significant opportunities. Furthermore, the growing demand for customized training solutions tailored to specific vessel types and operational requirements will open new avenues for market expansion.
Major Players in the Marine Simulators Market Ecosystem
- Wärtsilä Corporation
- Unitest Marine Simulators
- VSTEP BV
- Kongsberg Gruppen ASA
- BMT Group Ltd
- Virtual Marine Inc
- FORCE Technology
- NAUDEQ
- Altair Engineering Inc
- Global Dynamic Systems
- Pivot Maritime International
Key Developments in Marine Simulators Market Industry
May 2023: The MoD awarded BMT a hydrodynamic marine simulator training contract to provide safety, operational efficiency, readiness, and an advanced 5-bridge training platform capability in customized navigation training for the Admiralty Pilots and Tug Masters of the Queen Elizabeth-class aircraft carriers. This highlights the growing demand for high-fidelity simulators in military training.
January 2024: FORCE Technology was chosen to implement its SimFlex4 AR solution in a comprehensive upgrade for Smartship Australia, a Queensland maritime simulation and training facility. This demonstrates the increasing adoption of AR technology in enhancing simulator training effectiveness.
Strategic Marine Simulators Market Forecast
The marine simulators market is poised for substantial growth driven by factors such as increasing demand for skilled maritime professionals, technological advancements, and rising safety concerns. The integration of AR/VR and AI technologies will further enhance the realism and effectiveness of simulators, creating exciting new possibilities for training and education. The market is anticipated to experience a robust CAGR of xx% during the forecast period (2025-2033), driven by expansion into new markets and the development of innovative training solutions. Significant opportunities exist for companies that can leverage cutting-edge technology to provide customized and highly effective training programs.
Marine Simulators Market Segmentation
-
1. Type
- 1.1. Ship Bridge Simulators
- 1.2. Engine Room Simulators
- 1.3. Cargo Handling Simulators
- 1.4. Communic
- 1.5. Other Types
-
2. Application
- 2.1. Training and Education
- 2.2. Fleet Operations
- 2.3. Port and Terminal Operations
-
3. End Use
- 3.1. Commercial
- 3.2. Military
Marine Simulators Market Segmentation By Geography
-
1. North America
- 1.1. United States
- 1.2. Canada
-
2. Europe
- 2.1. Germany
- 2.2. United Kingdom
- 2.3. Russia
- 2.4. France
- 2.5. Rest of Europe
-
3. Asia Pacific
- 3.1. India
- 3.2. China
- 3.3. Japan
- 3.4. South Korea
- 3.5. Rest of Asia Pacific
-
4. Latin America
- 4.1. Brazil
- 4.2. Rest of Latin America
-
5. Middle East and Africa
- 5.1. United Arab Emirates
- 5.2. Saudi Arabia
- 5.3. Israel
- 5.4. Rest of Middle East and Africa
Marine Simulators Market REPORT HIGHLIGHTS
| Aspects | Details |
|---|---|
| Study Period | 2019-2033 |
| Base Year | 2024 |
| Estimated Year | 2025 |
| Forecast Period | 2025-2033 |
| Historical Period | 2019-2024 |
| Growth Rate | CAGR of 7.17% from 2019-2033 |
| Segmentation |
|
Table of Contents
- 1. Introduction
- 1.1. Research Scope
- 1.2. Market Segmentation
- 1.3. Research Methodology
- 1.4. Definitions and Assumptions
- 2. Executive Summary
- 2.1. Introduction
- 3. Market Dynamics
- 3.1. Introduction
- 3.2. Market Drivers
- 3.3. Market Restrains
- 3.4. Market Trends
- 3.4.1. The Military Segment is Expected to Showcase Significant Growth During the Forecast Period
- 4. Market Factor Analysis
- 4.1. Porters Five Forces
- 4.2. Supply/Value Chain
- 4.3. PESTEL analysis
- 4.4. Market Entropy
- 4.5. Patent/Trademark Analysis
- 5. Global Marine Simulators Market Analysis, Insights and Forecast, 2019-2031
- 5.1. Market Analysis, Insights and Forecast - by Type
- 5.1.1. Ship Bridge Simulators
- 5.1.2. Engine Room Simulators
- 5.1.3. Cargo Handling Simulators
- 5.1.4. Communic
- 5.1.5. Other Types
- 5.2. Market Analysis, Insights and Forecast - by Application
- 5.2.1. Training and Education
- 5.2.2. Fleet Operations
- 5.2.3. Port and Terminal Operations
- 5.3. Market Analysis, Insights and Forecast - by End Use
- 5.3.1. Commercial
- 5.3.2. Military
- 5.4. Market Analysis, Insights and Forecast - by Region
- 5.4.1. North America
- 5.4.2. Europe
- 5.4.3. Asia Pacific
- 5.4.4. Latin America
- 5.4.5. Middle East and Africa
- 5.1. Market Analysis, Insights and Forecast - by Type
- 6. North America Marine Simulators Market Analysis, Insights and Forecast, 2019-2031
- 6.1. Market Analysis, Insights and Forecast - by Type
- 6.1.1. Ship Bridge Simulators
- 6.1.2. Engine Room Simulators
- 6.1.3. Cargo Handling Simulators
- 6.1.4. Communic
- 6.1.5. Other Types
- 6.2. Market Analysis, Insights and Forecast - by Application
- 6.2.1. Training and Education
- 6.2.2. Fleet Operations
- 6.2.3. Port and Terminal Operations
- 6.3. Market Analysis, Insights and Forecast - by End Use
- 6.3.1. Commercial
- 6.3.2. Military
- 6.1. Market Analysis, Insights and Forecast - by Type
- 7. Europe Marine Simulators Market Analysis, Insights and Forecast, 2019-2031
- 7.1. Market Analysis, Insights and Forecast - by Type
- 7.1.1. Ship Bridge Simulators
- 7.1.2. Engine Room Simulators
- 7.1.3. Cargo Handling Simulators
- 7.1.4. Communic
- 7.1.5. Other Types
- 7.2. Market Analysis, Insights and Forecast - by Application
- 7.2.1. Training and Education
- 7.2.2. Fleet Operations
- 7.2.3. Port and Terminal Operations
- 7.3. Market Analysis, Insights and Forecast - by End Use
- 7.3.1. Commercial
- 7.3.2. Military
- 7.1. Market Analysis, Insights and Forecast - by Type
- 8. Asia Pacific Marine Simulators Market Analysis, Insights and Forecast, 2019-2031
- 8.1. Market Analysis, Insights and Forecast - by Type
- 8.1.1. Ship Bridge Simulators
- 8.1.2. Engine Room Simulators
- 8.1.3. Cargo Handling Simulators
- 8.1.4. Communic
- 8.1.5. Other Types
- 8.2. Market Analysis, Insights and Forecast - by Application
- 8.2.1. Training and Education
- 8.2.2. Fleet Operations
- 8.2.3. Port and Terminal Operations
- 8.3. Market Analysis, Insights and Forecast - by End Use
- 8.3.1. Commercial
- 8.3.2. Military
- 8.1. Market Analysis, Insights and Forecast - by Type
- 9. Latin America Marine Simulators Market Analysis, Insights and Forecast, 2019-2031
- 9.1. Market Analysis, Insights and Forecast - by Type
- 9.1.1. Ship Bridge Simulators
- 9.1.2. Engine Room Simulators
- 9.1.3. Cargo Handling Simulators
- 9.1.4. Communic
- 9.1.5. Other Types
- 9.2. Market Analysis, Insights and Forecast - by Application
- 9.2.1. Training and Education
- 9.2.2. Fleet Operations
- 9.2.3. Port and Terminal Operations
- 9.3. Market Analysis, Insights and Forecast - by End Use
- 9.3.1. Commercial
- 9.3.2. Military
- 9.1. Market Analysis, Insights and Forecast - by Type
- 10. Middle East and Africa Marine Simulators Market Analysis, Insights and Forecast, 2019-2031
- 10.1. Market Analysis, Insights and Forecast - by Type
- 10.1.1. Ship Bridge Simulators
- 10.1.2. Engine Room Simulators
- 10.1.3. Cargo Handling Simulators
- 10.1.4. Communic
- 10.1.5. Other Types
- 10.2. Market Analysis, Insights and Forecast - by Application
- 10.2.1. Training and Education
- 10.2.2. Fleet Operations
- 10.2.3. Port and Terminal Operations
- 10.3. Market Analysis, Insights and Forecast - by End Use
- 10.3.1. Commercial
- 10.3.2. Military
- 10.1. Market Analysis, Insights and Forecast - by Type
- 11. Competitive Analysis
- 11.1. Global Market Share Analysis 2024
- 11.2. Company Profiles
- 11.2.1 Wärtsila Corporation
- 11.2.1.1. Overview
- 11.2.1.2. Products
- 11.2.1.3. SWOT Analysis
- 11.2.1.4. Recent Developments
- 11.2.1.5. Financials (Based on Availability)
- 11.2.2 Unitest Marine Simulators
- 11.2.2.1. Overview
- 11.2.2.2. Products
- 11.2.2.3. SWOT Analysis
- 11.2.2.4. Recent Developments
- 11.2.2.5. Financials (Based on Availability)
- 11.2.3 VSTEP BV
- 11.2.3.1. Overview
- 11.2.3.2. Products
- 11.2.3.3. SWOT Analysis
- 11.2.3.4. Recent Developments
- 11.2.3.5. Financials (Based on Availability)
- 11.2.4 Kongsberg Gruppen ASA
- 11.2.4.1. Overview
- 11.2.4.2. Products
- 11.2.4.3. SWOT Analysis
- 11.2.4.4. Recent Developments
- 11.2.4.5. Financials (Based on Availability)
- 11.2.5 BMT Group Ltd
- 11.2.5.1. Overview
- 11.2.5.2. Products
- 11.2.5.3. SWOT Analysis
- 11.2.5.4. Recent Developments
- 11.2.5.5. Financials (Based on Availability)
- 11.2.6 Virtual Marine Inc
- 11.2.6.1. Overview
- 11.2.6.2. Products
- 11.2.6.3. SWOT Analysis
- 11.2.6.4. Recent Developments
- 11.2.6.5. Financials (Based on Availability)
- 11.2.7 FORCE Technology
- 11.2.7.1. Overview
- 11.2.7.2. Products
- 11.2.7.3. SWOT Analysis
- 11.2.7.4. Recent Developments
- 11.2.7.5. Financials (Based on Availability)
- 11.2.8 NAUDEQ
- 11.2.8.1. Overview
- 11.2.8.2. Products
- 11.2.8.3. SWOT Analysis
- 11.2.8.4. Recent Developments
- 11.2.8.5. Financials (Based on Availability)
- 11.2.9 Altair Engineering Inc
- 11.2.9.1. Overview
- 11.2.9.2. Products
- 11.2.9.3. SWOT Analysis
- 11.2.9.4. Recent Developments
- 11.2.9.5. Financials (Based on Availability)
- 11.2.10 Global Dynamic Systems
- 11.2.10.1. Overview
- 11.2.10.2. Products
- 11.2.10.3. SWOT Analysis
- 11.2.10.4. Recent Developments
- 11.2.10.5. Financials (Based on Availability)
- 11.2.11 Pivot Maritime Internationa
- 11.2.11.1. Overview
- 11.2.11.2. Products
- 11.2.11.3. SWOT Analysis
- 11.2.11.4. Recent Developments
- 11.2.11.5. Financials (Based on Availability)
- 11.2.1 Wärtsila Corporation
List of Figures
- Figure 1: Global Marine Simulators Market Revenue Breakdown (Million, %) by Region 2024 & 2032
- Figure 2: Global Marine Simulators Market Volume Breakdown (Billion, %) by Region 2024 & 2032
- Figure 3: North America Marine Simulators Market Revenue (Million), by Type 2024 & 2032
- Figure 4: North America Marine Simulators Market Volume (Billion), by Type 2024 & 2032
- Figure 5: North America Marine Simulators Market Revenue Share (%), by Type 2024 & 2032
- Figure 6: North America Marine Simulators Market Volume Share (%), by Type 2024 & 2032
- Figure 7: North America Marine Simulators Market Revenue (Million), by Application 2024 & 2032
- Figure 8: North America Marine Simulators Market Volume (Billion), by Application 2024 & 2032
- Figure 9: North America Marine Simulators Market Revenue Share (%), by Application 2024 & 2032
- Figure 10: North America Marine Simulators Market Volume Share (%), by Application 2024 & 2032
- Figure 11: North America Marine Simulators Market Revenue (Million), by End Use 2024 & 2032
- Figure 12: North America Marine Simulators Market Volume (Billion), by End Use 2024 & 2032
- Figure 13: North America Marine Simulators Market Revenue Share (%), by End Use 2024 & 2032
- Figure 14: North America Marine Simulators Market Volume Share (%), by End Use 2024 & 2032
- Figure 15: North America Marine Simulators Market Revenue (Million), by Country 2024 & 2032
- Figure 16: North America Marine Simulators Market Volume (Billion), by Country 2024 & 2032
- Figure 17: North America Marine Simulators Market Revenue Share (%), by Country 2024 & 2032
- Figure 18: North America Marine Simulators Market Volume Share (%), by Country 2024 & 2032
- Figure 19: Europe Marine Simulators Market Revenue (Million), by Type 2024 & 2032
- Figure 20: Europe Marine Simulators Market Volume (Billion), by Type 2024 & 2032
- Figure 21: Europe Marine Simulators Market Revenue Share (%), by Type 2024 & 2032
- Figure 22: Europe Marine Simulators Market Volume Share (%), by Type 2024 & 2032
- Figure 23: Europe Marine Simulators Market Revenue (Million), by Application 2024 & 2032
- Figure 24: Europe Marine Simulators Market Volume (Billion), by Application 2024 & 2032
- Figure 25: Europe Marine Simulators Market Revenue Share (%), by Application 2024 & 2032
- Figure 26: Europe Marine Simulators Market Volume Share (%), by Application 2024 & 2032
- Figure 27: Europe Marine Simulators Market Revenue (Million), by End Use 2024 & 2032
- Figure 28: Europe Marine Simulators Market Volume (Billion), by End Use 2024 & 2032
- Figure 29: Europe Marine Simulators Market Revenue Share (%), by End Use 2024 & 2032
- Figure 30: Europe Marine Simulators Market Volume Share (%), by End Use 2024 & 2032
- Figure 31: Europe Marine Simulators Market Revenue (Million), by Country 2024 & 2032
- Figure 32: Europe Marine Simulators Market Volume (Billion), by Country 2024 & 2032
- Figure 33: Europe Marine Simulators Market Revenue Share (%), by Country 2024 & 2032
- Figure 34: Europe Marine Simulators Market Volume Share (%), by Country 2024 & 2032
- Figure 35: Asia Pacific Marine Simulators Market Revenue (Million), by Type 2024 & 2032
- Figure 36: Asia Pacific Marine Simulators Market Volume (Billion), by Type 2024 & 2032
- Figure 37: Asia Pacific Marine Simulators Market Revenue Share (%), by Type 2024 & 2032
- Figure 38: Asia Pacific Marine Simulators Market Volume Share (%), by Type 2024 & 2032
- Figure 39: Asia Pacific Marine Simulators Market Revenue (Million), by Application 2024 & 2032
- Figure 40: Asia Pacific Marine Simulators Market Volume (Billion), by Application 2024 & 2032
- Figure 41: Asia Pacific Marine Simulators Market Revenue Share (%), by Application 2024 & 2032
- Figure 42: Asia Pacific Marine Simulators Market Volume Share (%), by Application 2024 & 2032
- Figure 43: Asia Pacific Marine Simulators Market Revenue (Million), by End Use 2024 & 2032
- Figure 44: Asia Pacific Marine Simulators Market Volume (Billion), by End Use 2024 & 2032
- Figure 45: Asia Pacific Marine Simulators Market Revenue Share (%), by End Use 2024 & 2032
- Figure 46: Asia Pacific Marine Simulators Market Volume Share (%), by End Use 2024 & 2032
- Figure 47: Asia Pacific Marine Simulators Market Revenue (Million), by Country 2024 & 2032
- Figure 48: Asia Pacific Marine Simulators Market Volume (Billion), by Country 2024 & 2032
- Figure 49: Asia Pacific Marine Simulators Market Revenue Share (%), by Country 2024 & 2032
- Figure 50: Asia Pacific Marine Simulators Market Volume Share (%), by Country 2024 & 2032
- Figure 51: Latin America Marine Simulators Market Revenue (Million), by Type 2024 & 2032
- Figure 52: Latin America Marine Simulators Market Volume (Billion), by Type 2024 & 2032
- Figure 53: Latin America Marine Simulators Market Revenue Share (%), by Type 2024 & 2032
- Figure 54: Latin America Marine Simulators Market Volume Share (%), by Type 2024 & 2032
- Figure 55: Latin America Marine Simulators Market Revenue (Million), by Application 2024 & 2032
- Figure 56: Latin America Marine Simulators Market Volume (Billion), by Application 2024 & 2032
- Figure 57: Latin America Marine Simulators Market Revenue Share (%), by Application 2024 & 2032
- Figure 58: Latin America Marine Simulators Market Volume Share (%), by Application 2024 & 2032
- Figure 59: Latin America Marine Simulators Market Revenue (Million), by End Use 2024 & 2032
- Figure 60: Latin America Marine Simulators Market Volume (Billion), by End Use 2024 & 2032
- Figure 61: Latin America Marine Simulators Market Revenue Share (%), by End Use 2024 & 2032
- Figure 62: Latin America Marine Simulators Market Volume Share (%), by End Use 2024 & 2032
- Figure 63: Latin America Marine Simulators Market Revenue (Million), by Country 2024 & 2032
- Figure 64: Latin America Marine Simulators Market Volume (Billion), by Country 2024 & 2032
- Figure 65: Latin America Marine Simulators Market Revenue Share (%), by Country 2024 & 2032
- Figure 66: Latin America Marine Simulators Market Volume Share (%), by Country 2024 & 2032
- Figure 67: Middle East and Africa Marine Simulators Market Revenue (Million), by Type 2024 & 2032
- Figure 68: Middle East and Africa Marine Simulators Market Volume (Billion), by Type 2024 & 2032
- Figure 69: Middle East and Africa Marine Simulators Market Revenue Share (%), by Type 2024 & 2032
- Figure 70: Middle East and Africa Marine Simulators Market Volume Share (%), by Type 2024 & 2032
- Figure 71: Middle East and Africa Marine Simulators Market Revenue (Million), by Application 2024 & 2032
- Figure 72: Middle East and Africa Marine Simulators Market Volume (Billion), by Application 2024 & 2032
- Figure 73: Middle East and Africa Marine Simulators Market Revenue Share (%), by Application 2024 & 2032
- Figure 74: Middle East and Africa Marine Simulators Market Volume Share (%), by Application 2024 & 2032
- Figure 75: Middle East and Africa Marine Simulators Market Revenue (Million), by End Use 2024 & 2032
- Figure 76: Middle East and Africa Marine Simulators Market Volume (Billion), by End Use 2024 & 2032
- Figure 77: Middle East and Africa Marine Simulators Market Revenue Share (%), by End Use 2024 & 2032
- Figure 78: Middle East and Africa Marine Simulators Market Volume Share (%), by End Use 2024 & 2032
- Figure 79: Middle East and Africa Marine Simulators Market Revenue (Million), by Country 2024 & 2032
- Figure 80: Middle East and Africa Marine Simulators Market Volume (Billion), by Country 2024 & 2032
- Figure 81: Middle East and Africa Marine Simulators Market Revenue Share (%), by Country 2024 & 2032
- Figure 82: Middle East and Africa Marine Simulators Market Volume Share (%), by Country 2024 & 2032
List of Tables
- Table 1: Global Marine Simulators Market Revenue Million Forecast, by Region 2019 & 2032
- Table 2: Global Marine Simulators Market Volume Billion Forecast, by Region 2019 & 2032
- Table 3: Global Marine Simulators Market Revenue Million Forecast, by Type 2019 & 2032
- Table 4: Global Marine Simulators Market Volume Billion Forecast, by Type 2019 & 2032
- Table 5: Global Marine Simulators Market Revenue Million Forecast, by Application 2019 & 2032
- Table 6: Global Marine Simulators Market Volume Billion Forecast, by Application 2019 & 2032
- Table 7: Global Marine Simulators Market Revenue Million Forecast, by End Use 2019 & 2032
- Table 8: Global Marine Simulators Market Volume Billion Forecast, by End Use 2019 & 2032
- Table 9: Global Marine Simulators Market Revenue Million Forecast, by Region 2019 & 2032
- Table 10: Global Marine Simulators Market Volume Billion Forecast, by Region 2019 & 2032
- Table 11: Global Marine Simulators Market Revenue Million Forecast, by Type 2019 & 2032
- Table 12: Global Marine Simulators Market Volume Billion Forecast, by Type 2019 & 2032
- Table 13: Global Marine Simulators Market Revenue Million Forecast, by Application 2019 & 2032
- Table 14: Global Marine Simulators Market Volume Billion Forecast, by Application 2019 & 2032
- Table 15: Global Marine Simulators Market Revenue Million Forecast, by End Use 2019 & 2032
- Table 16: Global Marine Simulators Market Volume Billion Forecast, by End Use 2019 & 2032
- Table 17: Global Marine Simulators Market Revenue Million Forecast, by Country 2019 & 2032
- Table 18: Global Marine Simulators Market Volume Billion Forecast, by Country 2019 & 2032
- Table 19: United States Marine Simulators Market Revenue (Million) Forecast, by Application 2019 & 2032
- Table 20: United States Marine Simulators Market Volume (Billion) Forecast, by Application 2019 & 2032
- Table 21: Canada Marine Simulators Market Revenue (Million) Forecast, by Application 2019 & 2032
- Table 22: Canada Marine Simulators Market Volume (Billion) Forecast, by Application 2019 & 2032
- Table 23: Global Marine Simulators Market Revenue Million Forecast, by Type 2019 & 2032
- Table 24: Global Marine Simulators Market Volume Billion Forecast, by Type 2019 & 2032
- Table 25: Global Marine Simulators Market Revenue Million Forecast, by Application 2019 & 2032
- Table 26: Global Marine Simulators Market Volume Billion Forecast, by Application 2019 & 2032
- Table 27: Global Marine Simulators Market Revenue Million Forecast, by End Use 2019 & 2032
- Table 28: Global Marine Simulators Market Volume Billion Forecast, by End Use 2019 & 2032
- Table 29: Global Marine Simulators Market Revenue Million Forecast, by Country 2019 & 2032
- Table 30: Global Marine Simulators Market Volume Billion Forecast, by Country 2019 & 2032
- Table 31: Germany Marine Simulators Market Revenue (Million) Forecast, by Application 2019 & 2032
- Table 32: Germany Marine Simulators Market Volume (Billion) Forecast, by Application 2019 & 2032
- Table 33: United Kingdom Marine Simulators Market Revenue (Million) Forecast, by Application 2019 & 2032
- Table 34: United Kingdom Marine Simulators Market Volume (Billion) Forecast, by Application 2019 & 2032
- Table 35: Russia Marine Simulators Market Revenue (Million) Forecast, by Application 2019 & 2032
- Table 36: Russia Marine Simulators Market Volume (Billion) Forecast, by Application 2019 & 2032
- Table 37: France Marine Simulators Market Revenue (Million) Forecast, by Application 2019 & 2032
- Table 38: France Marine Simulators Market Volume (Billion) Forecast, by Application 2019 & 2032
- Table 39: Rest of Europe Marine Simulators Market Revenue (Million) Forecast, by Application 2019 & 2032
- Table 40: Rest of Europe Marine Simulators Market Volume (Billion) Forecast, by Application 2019 & 2032
- Table 41: Global Marine Simulators Market Revenue Million Forecast, by Type 2019 & 2032
- Table 42: Global Marine Simulators Market Volume Billion Forecast, by Type 2019 & 2032
- Table 43: Global Marine Simulators Market Revenue Million Forecast, by Application 2019 & 2032
- Table 44: Global Marine Simulators Market Volume Billion Forecast, by Application 2019 & 2032
- Table 45: Global Marine Simulators Market Revenue Million Forecast, by End Use 2019 & 2032
- Table 46: Global Marine Simulators Market Volume Billion Forecast, by End Use 2019 & 2032
- Table 47: Global Marine Simulators Market Revenue Million Forecast, by Country 2019 & 2032
- Table 48: Global Marine Simulators Market Volume Billion Forecast, by Country 2019 & 2032
- Table 49: India Marine Simulators Market Revenue (Million) Forecast, by Application 2019 & 2032
- Table 50: India Marine Simulators Market Volume (Billion) Forecast, by Application 2019 & 2032
- Table 51: China Marine Simulators Market Revenue (Million) Forecast, by Application 2019 & 2032
- Table 52: China Marine Simulators Market Volume (Billion) Forecast, by Application 2019 & 2032
- Table 53: Japan Marine Simulators Market Revenue (Million) Forecast, by Application 2019 & 2032
- Table 54: Japan Marine Simulators Market Volume (Billion) Forecast, by Application 2019 & 2032
- Table 55: South Korea Marine Simulators Market Revenue (Million) Forecast, by Application 2019 & 2032
- Table 56: South Korea Marine Simulators Market Volume (Billion) Forecast, by Application 2019 & 2032
- Table 57: Rest of Asia Pacific Marine Simulators Market Revenue (Million) Forecast, by Application 2019 & 2032
- Table 58: Rest of Asia Pacific Marine Simulators Market Volume (Billion) Forecast, by Application 2019 & 2032
- Table 59: Global Marine Simulators Market Revenue Million Forecast, by Type 2019 & 2032
- Table 60: Global Marine Simulators Market Volume Billion Forecast, by Type 2019 & 2032
- Table 61: Global Marine Simulators Market Revenue Million Forecast, by Application 2019 & 2032
- Table 62: Global Marine Simulators Market Volume Billion Forecast, by Application 2019 & 2032
- Table 63: Global Marine Simulators Market Revenue Million Forecast, by End Use 2019 & 2032
- Table 64: Global Marine Simulators Market Volume Billion Forecast, by End Use 2019 & 2032
- Table 65: Global Marine Simulators Market Revenue Million Forecast, by Country 2019 & 2032
- Table 66: Global Marine Simulators Market Volume Billion Forecast, by Country 2019 & 2032
- Table 67: Brazil Marine Simulators Market Revenue (Million) Forecast, by Application 2019 & 2032
- Table 68: Brazil Marine Simulators Market Volume (Billion) Forecast, by Application 2019 & 2032
- Table 69: Rest of Latin America Marine Simulators Market Revenue (Million) Forecast, by Application 2019 & 2032
- Table 70: Rest of Latin America Marine Simulators Market Volume (Billion) Forecast, by Application 2019 & 2032
- Table 71: Global Marine Simulators Market Revenue Million Forecast, by Type 2019 & 2032
- Table 72: Global Marine Simulators Market Volume Billion Forecast, by Type 2019 & 2032
- Table 73: Global Marine Simulators Market Revenue Million Forecast, by Application 2019 & 2032
- Table 74: Global Marine Simulators Market Volume Billion Forecast, by Application 2019 & 2032
- Table 75: Global Marine Simulators Market Revenue Million Forecast, by End Use 2019 & 2032
- Table 76: Global Marine Simulators Market Volume Billion Forecast, by End Use 2019 & 2032
- Table 77: Global Marine Simulators Market Revenue Million Forecast, by Country 2019 & 2032
- Table 78: Global Marine Simulators Market Volume Billion Forecast, by Country 2019 & 2032
- Table 79: United Arab Emirates Marine Simulators Market Revenue (Million) Forecast, by Application 2019 & 2032
- Table 80: United Arab Emirates Marine Simulators Market Volume (Billion) Forecast, by Application 2019 & 2032
- Table 81: Saudi Arabia Marine Simulators Market Revenue (Million) Forecast, by Application 2019 & 2032
- Table 82: Saudi Arabia Marine Simulators Market Volume (Billion) Forecast, by Application 2019 & 2032
- Table 83: Israel Marine Simulators Market Revenue (Million) Forecast, by Application 2019 & 2032
- Table 84: Israel Marine Simulators Market Volume (Billion) Forecast, by Application 2019 & 2032
- Table 85: Rest of Middle East and Africa Marine Simulators Market Revenue (Million) Forecast, by Application 2019 & 2032
- Table 86: Rest of Middle East and Africa Marine Simulators Market Volume (Billion) Forecast, by Application 2019 & 2032
Frequently Asked Questions
1. What is the projected Compound Annual Growth Rate (CAGR) of the Marine Simulators Market?
The projected CAGR is approximately 7.17%.
2. Which companies are prominent players in the Marine Simulators Market?
Key companies in the market include Wärtsila Corporation, Unitest Marine Simulators, VSTEP BV, Kongsberg Gruppen ASA, BMT Group Ltd, Virtual Marine Inc, FORCE Technology, NAUDEQ, Altair Engineering Inc, Global Dynamic Systems, Pivot Maritime Internationa.
3. What are the main segments of the Marine Simulators Market?
The market segments include Type, Application, End Use.
4. Can you provide details about the market size?
The market size is estimated to be USD 5.12 Million as of 2022.
5. What are some drivers contributing to market growth?
N/A
6. What are the notable trends driving market growth?
The Military Segment is Expected to Showcase Significant Growth During the Forecast Period.
7. Are there any restraints impacting market growth?
N/A
8. Can you provide examples of recent developments in the market?
January 2024: FORCE Technology was chosen to implement its SimFlex4 AR solution in a comprehensive upgrade for Smartship Australia, a Queensland maritime simulation and training facility.
9. What pricing options are available for accessing the report?
Pricing options include single-user, multi-user, and enterprise licenses priced at USD 4750, USD 5250, and USD 8750 respectively.
10. Is the market size provided in terms of value or volume?
The market size is provided in terms of value, measured in Million and volume, measured in Billion.
11. Are there any specific market keywords associated with the report?
Yes, the market keyword associated with the report is "Marine Simulators Market," which aids in identifying and referencing the specific market segment covered.
12. How do I determine which pricing option suits my needs best?
The pricing options vary based on user requirements and access needs. Individual users may opt for single-user licenses, while businesses requiring broader access may choose multi-user or enterprise licenses for cost-effective access to the report.
13. Are there any additional resources or data provided in the Marine Simulators Market report?
While the report offers comprehensive insights, it's advisable to review the specific contents or supplementary materials provided to ascertain if additional resources or data are available.
14. How can I stay updated on further developments or reports in the Marine Simulators Market?
To stay informed about further developments, trends, and reports in the Marine Simulators Market, consider subscribing to industry newsletters, following relevant companies and organizations, or regularly checking reputable industry news sources and publications.
Methodology
Step 1 - Identification of Relevant Samples Size from Population Database


Step 2 - Approaches for Defining Global Market Size (Value, Volume* & Price*)

Note*: In applicable scenarios
Step 3 - Data Sources
Primary Research
- Web Analytics
- Survey Reports
- Research Institute
- Latest Research Reports
- Opinion Leaders
Secondary Research
- Annual Reports
- White Paper
- Latest Press Release
- Industry Association
- Paid Database
- Investor Presentations

Step 4 - Data Triangulation
Involves using different sources of information in order to increase the validity of a study
These sources are likely to be stakeholders in a program - participants, other researchers, program staff, other community members, and so on.
Then we put all data in single framework & apply various statistical tools to find out the dynamic on the market.
During the analysis stage, feedback from the stakeholder groups would be compared to determine areas of agreement as well as areas of divergence
