

Key Insights
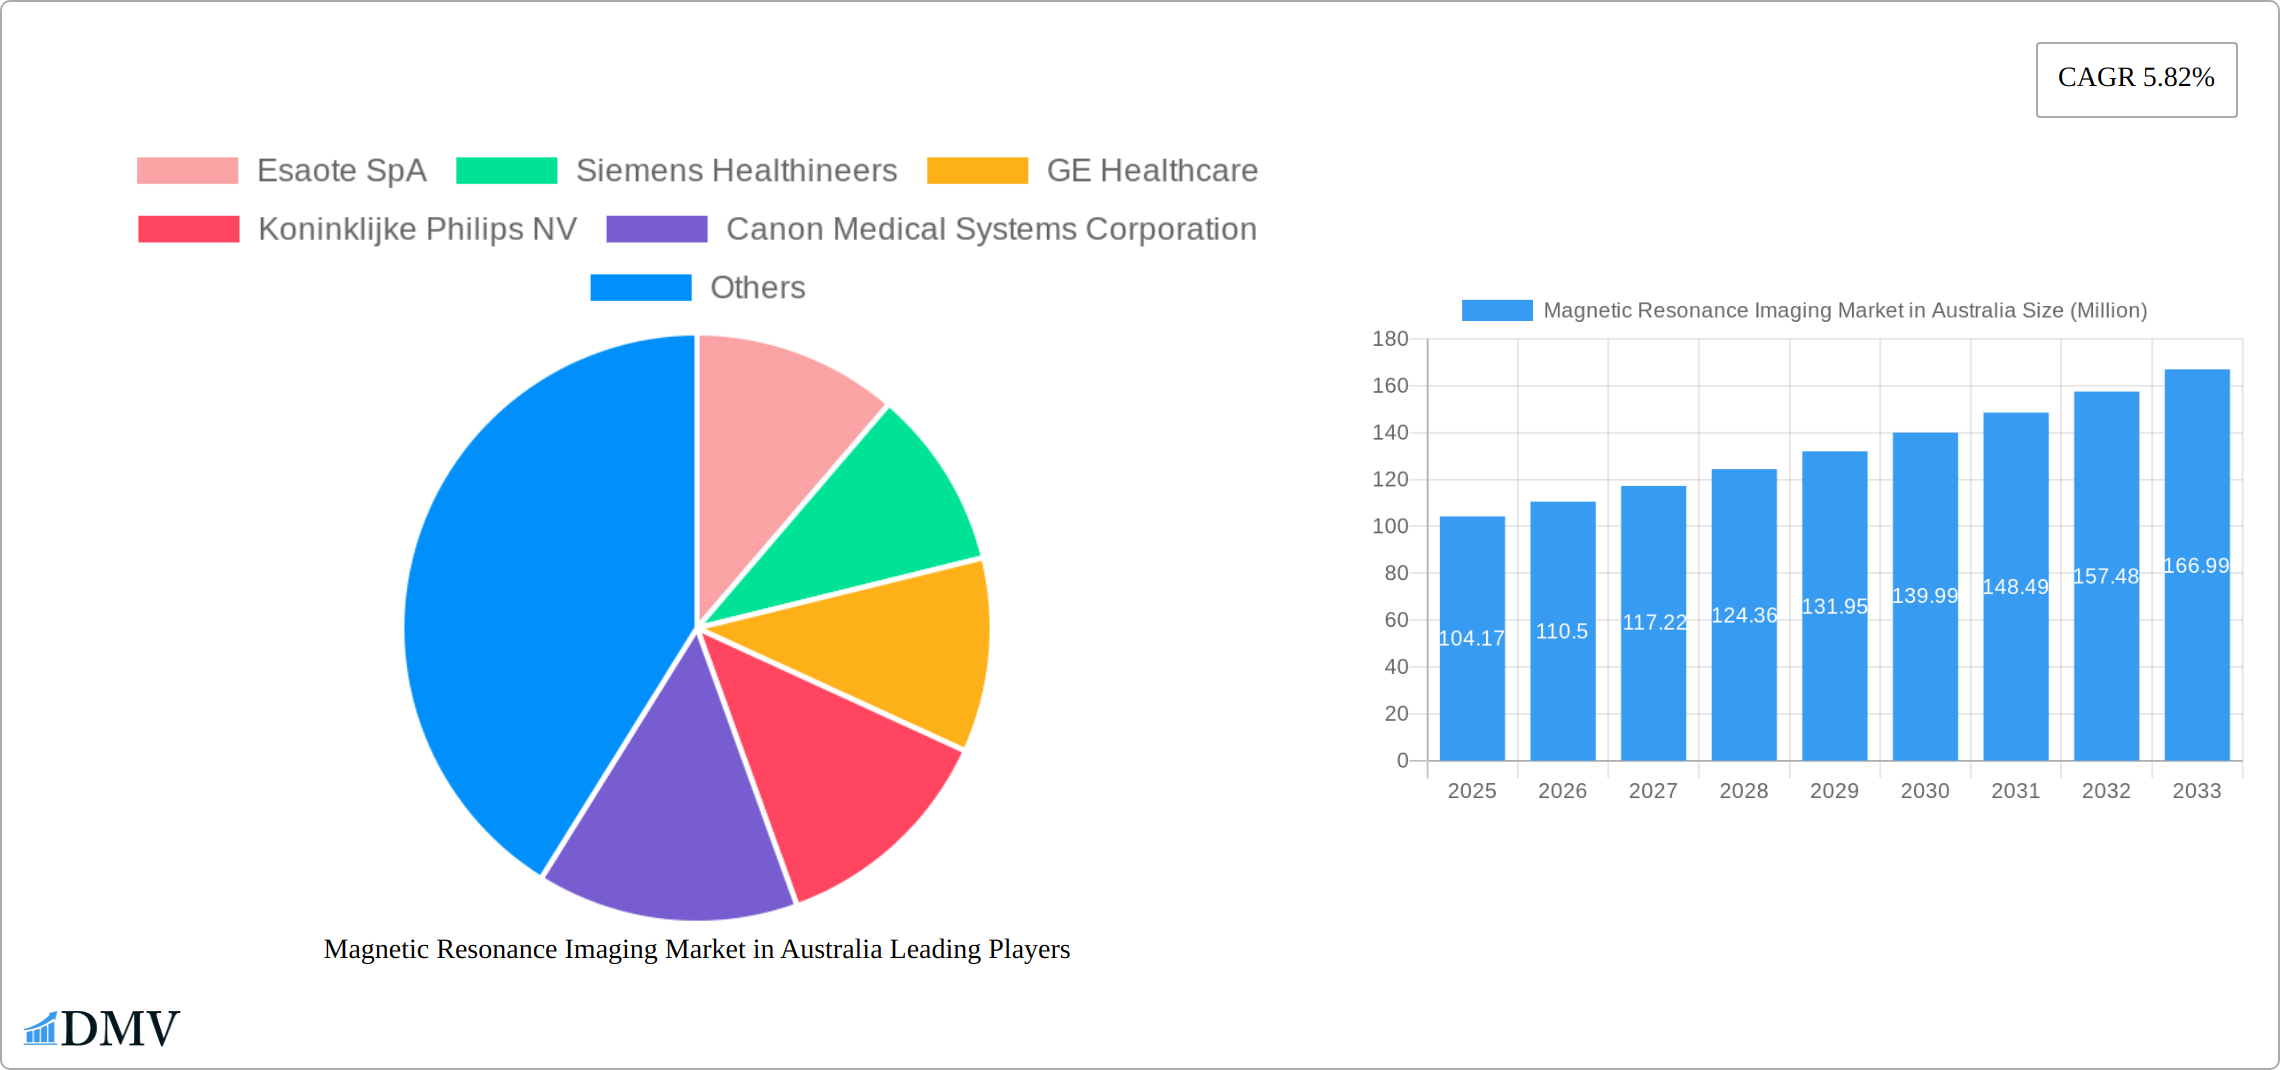
The Australian Magnetic Resonance Imaging (MRI) market, valued at approximately $104.17 million in 2025, is projected to experience robust growth, exhibiting a Compound Annual Growth Rate (CAGR) of 5.82% from 2025 to 2033. This expansion is fueled by several key factors. Rising prevalence of chronic diseases like cancer, cardiovascular conditions, and neurological disorders necessitates increased diagnostic imaging capabilities, driving demand for MRI systems. Technological advancements, such as the development of higher-field strength MRI systems (High Field, Very High Field, and Ultra-high Field) offering superior image quality and faster scan times, are significantly contributing to market growth. Furthermore, the increasing adoption of advanced MRI techniques, like functional MRI (fMRI) and diffusion tensor imaging (DTI), for enhanced diagnostic accuracy further boosts market expansion. Government initiatives focusing on improving healthcare infrastructure and promoting early disease detection are also providing a favorable environment for market growth. The market is segmented by system type (closed and open MRI), field strength (low, high, very high, and ultra-high field), and application (oncology, neurology, cardiology, gastroenterology, musculoskeletal, and other applications). Competition among major players like Esaote SpA, Siemens Healthineers, GE Healthcare, and Philips is driving innovation and affordability.
While the market enjoys positive growth prospects, certain challenges exist. The high cost of MRI systems and maintenance, coupled with the need for specialized personnel, could pose a barrier to entry for smaller clinics and hospitals, potentially limiting market penetration in certain regions. However, the long-term benefits of early and accurate diagnosis outweigh these challenges, and innovative financing models and technological advancements are likely to mitigate these constraints. The strong focus on technological improvements, coupled with increasing government investment in healthcare, positions the Australian MRI market for continuous and substantial expansion over the forecast period. The dominance of specific application segments, like oncology and neurology, is expected to remain prominent due to the high prevalence of these conditions in the Australian population.
Magnetic Resonance Imaging (MRI) Market in Australia: A Comprehensive Report (2019-2033)
This insightful report provides a comprehensive analysis of the Magnetic Resonance Imaging (MRI) market in Australia, covering the period from 2019 to 2033. It delves into market dynamics, technological advancements, key players, and future growth projections, offering invaluable insights for stakeholders across the healthcare ecosystem. The report leverages rigorous data analysis and industry expertise to present a clear picture of this evolving market, identifying key opportunities and challenges. The Australian MRI market is poised for significant growth, driven by factors such as increasing prevalence of chronic diseases, technological advancements, and government initiatives. This report provides a detailed understanding of this dynamic landscape.
Magnetic Resonance Imaging Market in Australia Market Composition & Trends
This section analyzes the competitive landscape, innovation drivers, regulatory environment, substitute technologies, end-user behavior, and mergers and acquisitions (M&A) activity within the Australian MRI market. The market is characterized by a moderate level of concentration, with key players like Siemens Healthineers, GE Healthcare, and Koninklijke Philips NV holding significant market share. However, smaller players and new entrants are actively contributing to market innovation.
- Market Share Distribution (2024 Estimate): Siemens Healthineers (35%), GE Healthcare (28%), Philips (20%), Others (17%). These figures are based on revenue generated within the Australian market.
- Innovation Catalysts: Advancements in MRI technology, such as higher field strength systems (ultra-high field MRI) and AI-powered image analysis, are driving market growth.
- Regulatory Landscape: The Therapeutic Goods Administration (TGA) plays a crucial role in regulating medical devices, including MRI systems, ensuring safety and efficacy.
- Substitute Products: While MRI remains the gold standard for many applications, other imaging modalities like CT scans and ultrasound provide competition in specific areas.
- End-User Profiles: The primary end-users are hospitals, diagnostic imaging centers, and specialized clinics. Growth is fueled by increasing demand from private healthcare providers.
- M&A Activity: While major M&A deals within the Australian MRI market have been limited in recent years, smaller acquisitions and strategic partnerships are prevalent, particularly focused on enhancing service offerings and expanding geographical reach. Total M&A deal value in the last 5 years is estimated at xx Million.

Magnetic Resonance Imaging Market in Australia Industry Evolution
The Australian MRI market has experienced steady growth over the historical period (2019-2024), with a Compound Annual Growth Rate (CAGR) of approximately xx%. This growth is projected to continue during the forecast period (2025-2033), driven by a number of factors. Technological advancements, such as the development of faster scan times and improved image quality, are enhancing the efficiency and diagnostic capabilities of MRI systems. This leads to increased patient throughput and improved clinical outcomes. Furthermore, the rising prevalence of chronic diseases, particularly in an aging population, is driving demand for advanced imaging technologies. The increasing adoption of minimally invasive surgical procedures, which often rely on intraoperative MRI, also contributes to market growth. The shift in consumer demands towards higher-quality, faster, and more convenient healthcare is further driving the adoption of advanced MRI technologies. Specifically, the increasing demand for faster, higher-resolution imaging has led to a significant increase in the adoption of high-field and ultra-high-field MRI systems. The growth of private healthcare and increased insurance coverage for MRI scans also contribute positively to the market expansion. Government initiatives aimed at improving healthcare infrastructure and access to advanced medical technologies also play a crucial role.
Leading Regions, Countries, or Segments in Magnetic Resonance Imaging Market in Australia
The Australian MRI market shows strong growth across various segments. While data on specific regional dominance is limited publicly, major metropolitan areas like Sydney and Melbourne likely dominate due to higher population density and concentration of healthcare facilities.
Dominant Segments:
- Architecture: Closed MRI systems currently hold the largest market share due to their superior image quality and versatility. However, open MRI systems are gaining traction due to their patient comfort and suitability for claustrophobic patients.
- Field Strength: High-field MRI systems (1.5T and 3T) dominate the market due to their superior image resolution and diagnostic capabilities. However, the adoption of ultra-high-field MRI systems (7T and above) is gradually increasing due to their enhanced sensitivity and ability to provide higher resolution images.
- Application: Oncology, Neurology, and Musculoskeletal applications currently represent the largest segments. The increasing prevalence of cancer and neurological disorders is driving demand for MRI services within these areas.
Key Drivers:
- Increased Government Funding: Government investments in healthcare infrastructure and advanced medical technologies are supporting market growth.
- Technological Advancements: Innovations in MRI technology, such as higher field strength systems and AI-powered image analysis, are driving adoption.
- Rising Prevalence of Chronic Diseases: The growing incidence of cancer, neurological disorders, and musculoskeletal conditions fuels demand for MRI services.
Magnetic Resonance Imaging Market in Australia Product Innovations
Recent innovations in MRI technology focus on improving image quality, reducing scan times, and enhancing patient comfort. This includes the development of higher field strength systems with improved signal-to-noise ratio, advanced coil technologies for better image clarity, and AI-powered image reconstruction algorithms for faster scan times and improved diagnostic accuracy. New MRI systems are increasingly incorporating features designed to improve the patient experience, such as wider bore magnets and noise reduction techniques. Unique selling propositions often include advanced software packages for specialized applications (e.g., neuroimaging) and improved workflow efficiencies.
Propelling Factors for Magnetic Resonance Imaging Market in Australia Growth
Several factors contribute to the growth of the Australian MRI market. Technological advancements, such as the development of faster and higher-resolution MRI systems, are a key driver. The increasing prevalence of chronic diseases necessitating advanced diagnostic imaging further fuels market expansion. Government initiatives supporting healthcare infrastructure development and increased private healthcare spending also contribute significantly.
Obstacles in the Magnetic Resonance Imaging Market in Australia Market
Despite its growth potential, the Australian MRI market faces certain challenges. High capital costs associated with purchasing and maintaining advanced MRI systems can pose a barrier for smaller healthcare providers. Regulatory hurdles and lengthy approval processes for new technologies can also slow down market penetration. Furthermore, intense competition among established players and the emergence of new entrants add pressure on pricing and profitability.
Future Opportunities in Magnetic Resonance Imaging Market in Australia
Future opportunities lie in the adoption of advanced technologies, such as ultra-high-field MRI and AI-powered image analysis, as well as expansion into new applications and geographical regions. The increasing demand for minimally invasive surgery and personalized medicine will further drive the growth of MRI. There’s potential for growth in rural and remote areas through mobile MRI units and telehealth initiatives.
Major Players in the Magnetic Resonance Imaging Market in Australia Ecosystem
- Esaote SpA
- Siemens Healthineers
- GE Healthcare
- Koninklijke Philips NV
- Canon Medical Systems Corporation
- Sonologic Inc
- United Imaging Healthcare Co Ltd
- Fujifilm Holdings Corporation
Key Developments in Magnetic Resonance Imaging Market in Australia Industry
- March 2022: Siemens MRI scanner installed at North Eastern Community Hospital in South Australia. This expands Siemens' presence in the regional market and enhances diagnostic capabilities within the hospital.
- April 2021: Philips installs cutting-edge digital imaging technologies, including Ingenia MR-OR intraoperative devices, at Westmead Hospital, Sydney. This signifies the adoption of advanced surgical technologies and contributes to improving surgical outcomes. The installation of Ingenia MR-OR systems in Australia and New Zealand further highlights technological advancements and the potential for enhanced healthcare services across the region.
Strategic Magnetic Resonance Imaging Market in Australia Market Forecast
The Australian MRI market is expected to witness robust growth over the forecast period (2025-2033), driven by continuous technological advancements, increasing prevalence of chronic diseases, and expanding healthcare infrastructure. The adoption of high-field and ultra-high-field MRI systems, along with AI-powered image analysis, will drive market expansion. Growth will also be propelled by increasing demand for minimally invasive surgical procedures and the expansion of private healthcare. The market presents significant opportunities for players to invest in advanced technologies, expand their service offerings, and strengthen their market position. The total market value is projected to reach xx Million by 2033.
Magnetic Resonance Imaging Market in Australia Segmentation
-
1. Architecture
- 1.1. Closed MRI Systems
- 1.2. Open MRI Systems
-
2. Field Strength
- 2.1. Low Field MRI Systems
- 2.2. High Field MRI Systems
- 2.3. Very Hig
-
3. Application
- 3.1. Oncology
- 3.2. Neurology
- 3.3. Cardiology
- 3.4. Gastroenterology
- 3.5. Musculoskeletal
- 3.6. Other Applications
Magnetic Resonance Imaging Market in Australia Segmentation By Geography
-
1. North America
- 1.1. United States
- 1.2. Canada
- 1.3. Mexico
-
2. South America
- 2.1. Brazil
- 2.2. Argentina
- 2.3. Rest of South America
-
3. Europe
- 3.1. United Kingdom
- 3.2. Germany
- 3.3. France
- 3.4. Italy
- 3.5. Spain
- 3.6. Russia
- 3.7. Benelux
- 3.8. Nordics
- 3.9. Rest of Europe
-
4. Middle East & Africa
- 4.1. Turkey
- 4.2. Israel
- 4.3. GCC
- 4.4. North Africa
- 4.5. South Africa
- 4.6. Rest of Middle East & Africa
-
5. Asia Pacific
- 5.1. China
- 5.2. India
- 5.3. Japan
- 5.4. South Korea
- 5.5. ASEAN
- 5.6. Oceania
- 5.7. Rest of Asia Pacific

Magnetic Resonance Imaging Market in Australia REPORT HIGHLIGHTS
| Aspects | Details |
|---|---|
| Study Period | 2019-2033 |
| Base Year | 2024 |
| Estimated Year | 2025 |
| Forecast Period | 2025-2033 |
| Historical Period | 2019-2024 |
| Growth Rate | CAGR of 5.82% from 2019-2033 |
| Segmentation |
|
Table of Contents
- 1. Introduction
- 1.1. Research Scope
- 1.2. Market Segmentation
- 1.3. Research Methodology
- 1.4. Definitions and Assumptions
- 2. Executive Summary
- 2.1. Introduction
- 3. Market Dynamics
- 3.1. Introduction
- 3.2. Market Drivers
- 3.2.1. Introduction of Hybrid MRI Systems; Availability of Universal Health Coverage
- 3.3. Market Restrains
- 3.3.1. High Cost of MRI Systems
- 3.4. Market Trends
- 3.4.1. Neurology is Expected to Witness Steady Growth Over the Forecast Period
- 4. Market Factor Analysis
- 4.1. Porters Five Forces
- 4.2. Supply/Value Chain
- 4.3. PESTEL analysis
- 4.4. Market Entropy
- 4.5. Patent/Trademark Analysis
- 5. Global Magnetic Resonance Imaging Market in Australia Analysis, Insights and Forecast, 2019-2031
- 5.1. Market Analysis, Insights and Forecast - by Architecture
- 5.1.1. Closed MRI Systems
- 5.1.2. Open MRI Systems
- 5.2. Market Analysis, Insights and Forecast - by Field Strength
- 5.2.1. Low Field MRI Systems
- 5.2.2. High Field MRI Systems
- 5.2.3. Very Hig
- 5.3. Market Analysis, Insights and Forecast - by Application
- 5.3.1. Oncology
- 5.3.2. Neurology
- 5.3.3. Cardiology
- 5.3.4. Gastroenterology
- 5.3.5. Musculoskeletal
- 5.3.6. Other Applications
- 5.4. Market Analysis, Insights and Forecast - by Region
- 5.4.1. North America
- 5.4.2. South America
- 5.4.3. Europe
- 5.4.4. Middle East & Africa
- 5.4.5. Asia Pacific
- 5.1. Market Analysis, Insights and Forecast - by Architecture
- 6. North America Magnetic Resonance Imaging Market in Australia Analysis, Insights and Forecast, 2019-2031
- 6.1. Market Analysis, Insights and Forecast - by Architecture
- 6.1.1. Closed MRI Systems
- 6.1.2. Open MRI Systems
- 6.2. Market Analysis, Insights and Forecast - by Field Strength
- 6.2.1. Low Field MRI Systems
- 6.2.2. High Field MRI Systems
- 6.2.3. Very Hig
- 6.3. Market Analysis, Insights and Forecast - by Application
- 6.3.1. Oncology
- 6.3.2. Neurology
- 6.3.3. Cardiology
- 6.3.4. Gastroenterology
- 6.3.5. Musculoskeletal
- 6.3.6. Other Applications
- 6.1. Market Analysis, Insights and Forecast - by Architecture
- 7. South America Magnetic Resonance Imaging Market in Australia Analysis, Insights and Forecast, 2019-2031
- 7.1. Market Analysis, Insights and Forecast - by Architecture
- 7.1.1. Closed MRI Systems
- 7.1.2. Open MRI Systems
- 7.2. Market Analysis, Insights and Forecast - by Field Strength
- 7.2.1. Low Field MRI Systems
- 7.2.2. High Field MRI Systems
- 7.2.3. Very Hig
- 7.3. Market Analysis, Insights and Forecast - by Application
- 7.3.1. Oncology
- 7.3.2. Neurology
- 7.3.3. Cardiology
- 7.3.4. Gastroenterology
- 7.3.5. Musculoskeletal
- 7.3.6. Other Applications
- 7.1. Market Analysis, Insights and Forecast - by Architecture
- 8. Europe Magnetic Resonance Imaging Market in Australia Analysis, Insights and Forecast, 2019-2031
- 8.1. Market Analysis, Insights and Forecast - by Architecture
- 8.1.1. Closed MRI Systems
- 8.1.2. Open MRI Systems
- 8.2. Market Analysis, Insights and Forecast - by Field Strength
- 8.2.1. Low Field MRI Systems
- 8.2.2. High Field MRI Systems
- 8.2.3. Very Hig
- 8.3. Market Analysis, Insights and Forecast - by Application
- 8.3.1. Oncology
- 8.3.2. Neurology
- 8.3.3. Cardiology
- 8.3.4. Gastroenterology
- 8.3.5. Musculoskeletal
- 8.3.6. Other Applications
- 8.1. Market Analysis, Insights and Forecast - by Architecture
- 9. Middle East & Africa Magnetic Resonance Imaging Market in Australia Analysis, Insights and Forecast, 2019-2031
- 9.1. Market Analysis, Insights and Forecast - by Architecture
- 9.1.1. Closed MRI Systems
- 9.1.2. Open MRI Systems
- 9.2. Market Analysis, Insights and Forecast - by Field Strength
- 9.2.1. Low Field MRI Systems
- 9.2.2. High Field MRI Systems
- 9.2.3. Very Hig
- 9.3. Market Analysis, Insights and Forecast - by Application
- 9.3.1. Oncology
- 9.3.2. Neurology
- 9.3.3. Cardiology
- 9.3.4. Gastroenterology
- 9.3.5. Musculoskeletal
- 9.3.6. Other Applications
- 9.1. Market Analysis, Insights and Forecast - by Architecture
- 10. Asia Pacific Magnetic Resonance Imaging Market in Australia Analysis, Insights and Forecast, 2019-2031
- 10.1. Market Analysis, Insights and Forecast - by Architecture
- 10.1.1. Closed MRI Systems
- 10.1.2. Open MRI Systems
- 10.2. Market Analysis, Insights and Forecast - by Field Strength
- 10.2.1. Low Field MRI Systems
- 10.2.2. High Field MRI Systems
- 10.2.3. Very Hig
- 10.3. Market Analysis, Insights and Forecast - by Application
- 10.3.1. Oncology
- 10.3.2. Neurology
- 10.3.3. Cardiology
- 10.3.4. Gastroenterology
- 10.3.5. Musculoskeletal
- 10.3.6. Other Applications
- 10.1. Market Analysis, Insights and Forecast - by Architecture
- 11. Competitive Analysis
- 11.1. Global Market Share Analysis 2024
- 11.2. Company Profiles
- 11.2.1 Esaote SpA
- 11.2.1.1. Overview
- 11.2.1.2. Products
- 11.2.1.3. SWOT Analysis
- 11.2.1.4. Recent Developments
- 11.2.1.5. Financials (Based on Availability)
- 11.2.2 Siemens Healthineers
- 11.2.2.1. Overview
- 11.2.2.2. Products
- 11.2.2.3. SWOT Analysis
- 11.2.2.4. Recent Developments
- 11.2.2.5. Financials (Based on Availability)
- 11.2.3 GE Healthcare
- 11.2.3.1. Overview
- 11.2.3.2. Products
- 11.2.3.3. SWOT Analysis
- 11.2.3.4. Recent Developments
- 11.2.3.5. Financials (Based on Availability)
- 11.2.4 Koninklijke Philips NV
- 11.2.4.1. Overview
- 11.2.4.2. Products
- 11.2.4.3. SWOT Analysis
- 11.2.4.4. Recent Developments
- 11.2.4.5. Financials (Based on Availability)
- 11.2.5 Canon Medical Systems Corporation
- 11.2.5.1. Overview
- 11.2.5.2. Products
- 11.2.5.3. SWOT Analysis
- 11.2.5.4. Recent Developments
- 11.2.5.5. Financials (Based on Availability)
- 11.2.6 Sonologic Inc
- 11.2.6.1. Overview
- 11.2.6.2. Products
- 11.2.6.3. SWOT Analysis
- 11.2.6.4. Recent Developments
- 11.2.6.5. Financials (Based on Availability)
- 11.2.7 United Imaging Healthcare Co Ltd
- 11.2.7.1. Overview
- 11.2.7.2. Products
- 11.2.7.3. SWOT Analysis
- 11.2.7.4. Recent Developments
- 11.2.7.5. Financials (Based on Availability)
- 11.2.8 Fujifilm Holdings Corporation
- 11.2.8.1. Overview
- 11.2.8.2. Products
- 11.2.8.3. SWOT Analysis
- 11.2.8.4. Recent Developments
- 11.2.8.5. Financials (Based on Availability)
- 11.2.1 Esaote SpA
List of Figures
- Figure 1: Global Magnetic Resonance Imaging Market in Australia Revenue Breakdown (Million, %) by Region 2024 & 2032
- Figure 2: Australia Magnetic Resonance Imaging Market in Australia Revenue (Million), by Country 2024 & 2032
- Figure 3: Australia Magnetic Resonance Imaging Market in Australia Revenue Share (%), by Country 2024 & 2032
- Figure 4: North America Magnetic Resonance Imaging Market in Australia Revenue (Million), by Architecture 2024 & 2032
- Figure 5: North America Magnetic Resonance Imaging Market in Australia Revenue Share (%), by Architecture 2024 & 2032
- Figure 6: North America Magnetic Resonance Imaging Market in Australia Revenue (Million), by Field Strength 2024 & 2032
- Figure 7: North America Magnetic Resonance Imaging Market in Australia Revenue Share (%), by Field Strength 2024 & 2032
- Figure 8: North America Magnetic Resonance Imaging Market in Australia Revenue (Million), by Application 2024 & 2032
- Figure 9: North America Magnetic Resonance Imaging Market in Australia Revenue Share (%), by Application 2024 & 2032
- Figure 10: North America Magnetic Resonance Imaging Market in Australia Revenue (Million), by Country 2024 & 2032
- Figure 11: North America Magnetic Resonance Imaging Market in Australia Revenue Share (%), by Country 2024 & 2032
- Figure 12: South America Magnetic Resonance Imaging Market in Australia Revenue (Million), by Architecture 2024 & 2032
- Figure 13: South America Magnetic Resonance Imaging Market in Australia Revenue Share (%), by Architecture 2024 & 2032
- Figure 14: South America Magnetic Resonance Imaging Market in Australia Revenue (Million), by Field Strength 2024 & 2032
- Figure 15: South America Magnetic Resonance Imaging Market in Australia Revenue Share (%), by Field Strength 2024 & 2032
- Figure 16: South America Magnetic Resonance Imaging Market in Australia Revenue (Million), by Application 2024 & 2032
- Figure 17: South America Magnetic Resonance Imaging Market in Australia Revenue Share (%), by Application 2024 & 2032
- Figure 18: South America Magnetic Resonance Imaging Market in Australia Revenue (Million), by Country 2024 & 2032
- Figure 19: South America Magnetic Resonance Imaging Market in Australia Revenue Share (%), by Country 2024 & 2032
- Figure 20: Europe Magnetic Resonance Imaging Market in Australia Revenue (Million), by Architecture 2024 & 2032
- Figure 21: Europe Magnetic Resonance Imaging Market in Australia Revenue Share (%), by Architecture 2024 & 2032
- Figure 22: Europe Magnetic Resonance Imaging Market in Australia Revenue (Million), by Field Strength 2024 & 2032
- Figure 23: Europe Magnetic Resonance Imaging Market in Australia Revenue Share (%), by Field Strength 2024 & 2032
- Figure 24: Europe Magnetic Resonance Imaging Market in Australia Revenue (Million), by Application 2024 & 2032
- Figure 25: Europe Magnetic Resonance Imaging Market in Australia Revenue Share (%), by Application 2024 & 2032
- Figure 26: Europe Magnetic Resonance Imaging Market in Australia Revenue (Million), by Country 2024 & 2032
- Figure 27: Europe Magnetic Resonance Imaging Market in Australia Revenue Share (%), by Country 2024 & 2032
- Figure 28: Middle East & Africa Magnetic Resonance Imaging Market in Australia Revenue (Million), by Architecture 2024 & 2032
- Figure 29: Middle East & Africa Magnetic Resonance Imaging Market in Australia Revenue Share (%), by Architecture 2024 & 2032
- Figure 30: Middle East & Africa Magnetic Resonance Imaging Market in Australia Revenue (Million), by Field Strength 2024 & 2032
- Figure 31: Middle East & Africa Magnetic Resonance Imaging Market in Australia Revenue Share (%), by Field Strength 2024 & 2032
- Figure 32: Middle East & Africa Magnetic Resonance Imaging Market in Australia Revenue (Million), by Application 2024 & 2032
- Figure 33: Middle East & Africa Magnetic Resonance Imaging Market in Australia Revenue Share (%), by Application 2024 & 2032
- Figure 34: Middle East & Africa Magnetic Resonance Imaging Market in Australia Revenue (Million), by Country 2024 & 2032
- Figure 35: Middle East & Africa Magnetic Resonance Imaging Market in Australia Revenue Share (%), by Country 2024 & 2032
- Figure 36: Asia Pacific Magnetic Resonance Imaging Market in Australia Revenue (Million), by Architecture 2024 & 2032
- Figure 37: Asia Pacific Magnetic Resonance Imaging Market in Australia Revenue Share (%), by Architecture 2024 & 2032
- Figure 38: Asia Pacific Magnetic Resonance Imaging Market in Australia Revenue (Million), by Field Strength 2024 & 2032
- Figure 39: Asia Pacific Magnetic Resonance Imaging Market in Australia Revenue Share (%), by Field Strength 2024 & 2032
- Figure 40: Asia Pacific Magnetic Resonance Imaging Market in Australia Revenue (Million), by Application 2024 & 2032
- Figure 41: Asia Pacific Magnetic Resonance Imaging Market in Australia Revenue Share (%), by Application 2024 & 2032
- Figure 42: Asia Pacific Magnetic Resonance Imaging Market in Australia Revenue (Million), by Country 2024 & 2032
- Figure 43: Asia Pacific Magnetic Resonance Imaging Market in Australia Revenue Share (%), by Country 2024 & 2032
List of Tables
- Table 1: Global Magnetic Resonance Imaging Market in Australia Revenue Million Forecast, by Region 2019 & 2032
- Table 2: Global Magnetic Resonance Imaging Market in Australia Revenue Million Forecast, by Architecture 2019 & 2032
- Table 3: Global Magnetic Resonance Imaging Market in Australia Revenue Million Forecast, by Field Strength 2019 & 2032
- Table 4: Global Magnetic Resonance Imaging Market in Australia Revenue Million Forecast, by Application 2019 & 2032
- Table 5: Global Magnetic Resonance Imaging Market in Australia Revenue Million Forecast, by Region 2019 & 2032
- Table 6: Global Magnetic Resonance Imaging Market in Australia Revenue Million Forecast, by Country 2019 & 2032
- Table 7: Global Magnetic Resonance Imaging Market in Australia Revenue Million Forecast, by Architecture 2019 & 2032
- Table 8: Global Magnetic Resonance Imaging Market in Australia Revenue Million Forecast, by Field Strength 2019 & 2032
- Table 9: Global Magnetic Resonance Imaging Market in Australia Revenue Million Forecast, by Application 2019 & 2032
- Table 10: Global Magnetic Resonance Imaging Market in Australia Revenue Million Forecast, by Country 2019 & 2032
- Table 11: United States Magnetic Resonance Imaging Market in Australia Revenue (Million) Forecast, by Application 2019 & 2032
- Table 12: Canada Magnetic Resonance Imaging Market in Australia Revenue (Million) Forecast, by Application 2019 & 2032
- Table 13: Mexico Magnetic Resonance Imaging Market in Australia Revenue (Million) Forecast, by Application 2019 & 2032
- Table 14: Global Magnetic Resonance Imaging Market in Australia Revenue Million Forecast, by Architecture 2019 & 2032
- Table 15: Global Magnetic Resonance Imaging Market in Australia Revenue Million Forecast, by Field Strength 2019 & 2032
- Table 16: Global Magnetic Resonance Imaging Market in Australia Revenue Million Forecast, by Application 2019 & 2032
- Table 17: Global Magnetic Resonance Imaging Market in Australia Revenue Million Forecast, by Country 2019 & 2032
- Table 18: Brazil Magnetic Resonance Imaging Market in Australia Revenue (Million) Forecast, by Application 2019 & 2032
- Table 19: Argentina Magnetic Resonance Imaging Market in Australia Revenue (Million) Forecast, by Application 2019 & 2032
- Table 20: Rest of South America Magnetic Resonance Imaging Market in Australia Revenue (Million) Forecast, by Application 2019 & 2032
- Table 21: Global Magnetic Resonance Imaging Market in Australia Revenue Million Forecast, by Architecture 2019 & 2032
- Table 22: Global Magnetic Resonance Imaging Market in Australia Revenue Million Forecast, by Field Strength 2019 & 2032
- Table 23: Global Magnetic Resonance Imaging Market in Australia Revenue Million Forecast, by Application 2019 & 2032
- Table 24: Global Magnetic Resonance Imaging Market in Australia Revenue Million Forecast, by Country 2019 & 2032
- Table 25: United Kingdom Magnetic Resonance Imaging Market in Australia Revenue (Million) Forecast, by Application 2019 & 2032
- Table 26: Germany Magnetic Resonance Imaging Market in Australia Revenue (Million) Forecast, by Application 2019 & 2032
- Table 27: France Magnetic Resonance Imaging Market in Australia Revenue (Million) Forecast, by Application 2019 & 2032
- Table 28: Italy Magnetic Resonance Imaging Market in Australia Revenue (Million) Forecast, by Application 2019 & 2032
- Table 29: Spain Magnetic Resonance Imaging Market in Australia Revenue (Million) Forecast, by Application 2019 & 2032
- Table 30: Russia Magnetic Resonance Imaging Market in Australia Revenue (Million) Forecast, by Application 2019 & 2032
- Table 31: Benelux Magnetic Resonance Imaging Market in Australia Revenue (Million) Forecast, by Application 2019 & 2032
- Table 32: Nordics Magnetic Resonance Imaging Market in Australia Revenue (Million) Forecast, by Application 2019 & 2032
- Table 33: Rest of Europe Magnetic Resonance Imaging Market in Australia Revenue (Million) Forecast, by Application 2019 & 2032
- Table 34: Global Magnetic Resonance Imaging Market in Australia Revenue Million Forecast, by Architecture 2019 & 2032
- Table 35: Global Magnetic Resonance Imaging Market in Australia Revenue Million Forecast, by Field Strength 2019 & 2032
- Table 36: Global Magnetic Resonance Imaging Market in Australia Revenue Million Forecast, by Application 2019 & 2032
- Table 37: Global Magnetic Resonance Imaging Market in Australia Revenue Million Forecast, by Country 2019 & 2032
- Table 38: Turkey Magnetic Resonance Imaging Market in Australia Revenue (Million) Forecast, by Application 2019 & 2032
- Table 39: Israel Magnetic Resonance Imaging Market in Australia Revenue (Million) Forecast, by Application 2019 & 2032
- Table 40: GCC Magnetic Resonance Imaging Market in Australia Revenue (Million) Forecast, by Application 2019 & 2032
- Table 41: North Africa Magnetic Resonance Imaging Market in Australia Revenue (Million) Forecast, by Application 2019 & 2032
- Table 42: South Africa Magnetic Resonance Imaging Market in Australia Revenue (Million) Forecast, by Application 2019 & 2032
- Table 43: Rest of Middle East & Africa Magnetic Resonance Imaging Market in Australia Revenue (Million) Forecast, by Application 2019 & 2032
- Table 44: Global Magnetic Resonance Imaging Market in Australia Revenue Million Forecast, by Architecture 2019 & 2032
- Table 45: Global Magnetic Resonance Imaging Market in Australia Revenue Million Forecast, by Field Strength 2019 & 2032
- Table 46: Global Magnetic Resonance Imaging Market in Australia Revenue Million Forecast, by Application 2019 & 2032
- Table 47: Global Magnetic Resonance Imaging Market in Australia Revenue Million Forecast, by Country 2019 & 2032
- Table 48: China Magnetic Resonance Imaging Market in Australia Revenue (Million) Forecast, by Application 2019 & 2032
- Table 49: India Magnetic Resonance Imaging Market in Australia Revenue (Million) Forecast, by Application 2019 & 2032
- Table 50: Japan Magnetic Resonance Imaging Market in Australia Revenue (Million) Forecast, by Application 2019 & 2032
- Table 51: South Korea Magnetic Resonance Imaging Market in Australia Revenue (Million) Forecast, by Application 2019 & 2032
- Table 52: ASEAN Magnetic Resonance Imaging Market in Australia Revenue (Million) Forecast, by Application 2019 & 2032
- Table 53: Oceania Magnetic Resonance Imaging Market in Australia Revenue (Million) Forecast, by Application 2019 & 2032
- Table 54: Rest of Asia Pacific Magnetic Resonance Imaging Market in Australia Revenue (Million) Forecast, by Application 2019 & 2032
Frequently Asked Questions
1. What is the projected Compound Annual Growth Rate (CAGR) of the Magnetic Resonance Imaging Market in Australia?
The projected CAGR is approximately 5.82%.
2. Which companies are prominent players in the Magnetic Resonance Imaging Market in Australia?
Key companies in the market include Esaote SpA, Siemens Healthineers, GE Healthcare, Koninklijke Philips NV, Canon Medical Systems Corporation, Sonologic Inc, United Imaging Healthcare Co Ltd, Fujifilm Holdings Corporation.
3. What are the main segments of the Magnetic Resonance Imaging Market in Australia?
The market segments include Architecture, Field Strength, Application.
4. Can you provide details about the market size?
The market size is estimated to be USD 104.17 Million as of 2022.
5. What are some drivers contributing to market growth?
Introduction of Hybrid MRI Systems; Availability of Universal Health Coverage.
6. What are the notable trends driving market growth?
Neurology is Expected to Witness Steady Growth Over the Forecast Period.
7. Are there any restraints impacting market growth?
High Cost of MRI Systems.
8. Can you provide examples of recent developments in the market?
In March 2022, Siemens MRI Scanner was installed at North Eastern Community Hospital in the Benson Radiology department in South Australia.
9. What pricing options are available for accessing the report?
Pricing options include single-user, multi-user, and enterprise licenses priced at USD 3800, USD 4500, and USD 5800 respectively.
10. Is the market size provided in terms of value or volume?
The market size is provided in terms of value, measured in Million.
11. Are there any specific market keywords associated with the report?
Yes, the market keyword associated with the report is "Magnetic Resonance Imaging Market in Australia," which aids in identifying and referencing the specific market segment covered.
12. How do I determine which pricing option suits my needs best?
The pricing options vary based on user requirements and access needs. Individual users may opt for single-user licenses, while businesses requiring broader access may choose multi-user or enterprise licenses for cost-effective access to the report.
13. Are there any additional resources or data provided in the Magnetic Resonance Imaging Market in Australia report?
While the report offers comprehensive insights, it's advisable to review the specific contents or supplementary materials provided to ascertain if additional resources or data are available.
14. How can I stay updated on further developments or reports in the Magnetic Resonance Imaging Market in Australia?
To stay informed about further developments, trends, and reports in the Magnetic Resonance Imaging Market in Australia, consider subscribing to industry newsletters, following relevant companies and organizations, or regularly checking reputable industry news sources and publications.
Methodology
Step 1 - Identification of Relevant Samples Size from Population Database


Step 2 - Approaches for Defining Global Market Size (Value, Volume* & Price*)

Note*: In applicable scenarios
Step 3 - Data Sources
Primary Research
- Web Analytics
- Survey Reports
- Research Institute
- Latest Research Reports
- Opinion Leaders
Secondary Research
- Annual Reports
- White Paper
- Latest Press Release
- Industry Association
- Paid Database
- Investor Presentations

Step 4 - Data Triangulation
Involves using different sources of information in order to increase the validity of a study
These sources are likely to be stakeholders in a program - participants, other researchers, program staff, other community members, and so on.
Then we put all data in single framework & apply various statistical tools to find out the dynamic on the market.
During the analysis stage, feedback from the stakeholder groups would be compared to determine areas of agreement as well as areas of divergence
