

Key Insights
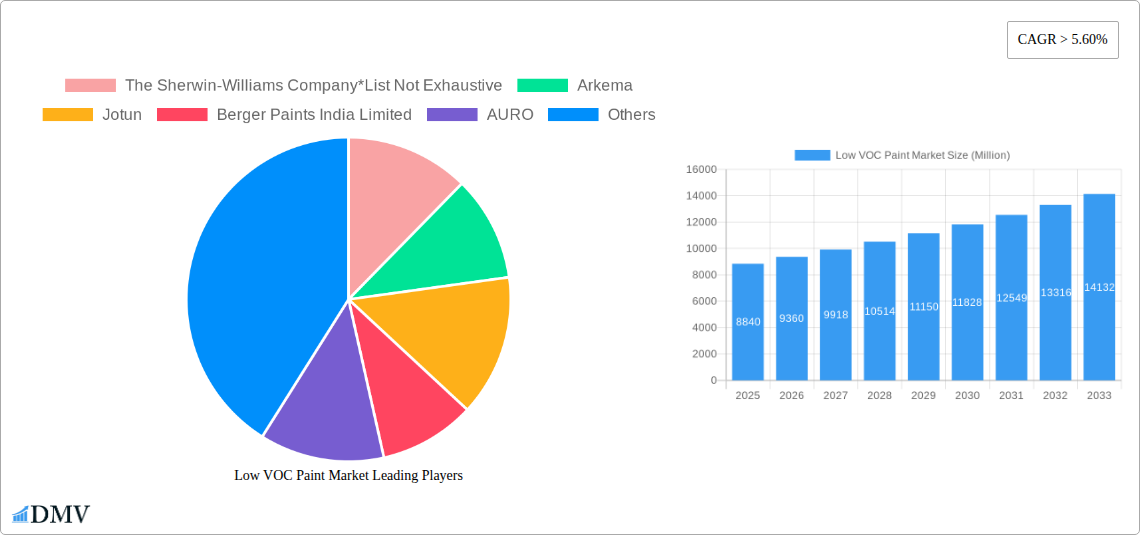
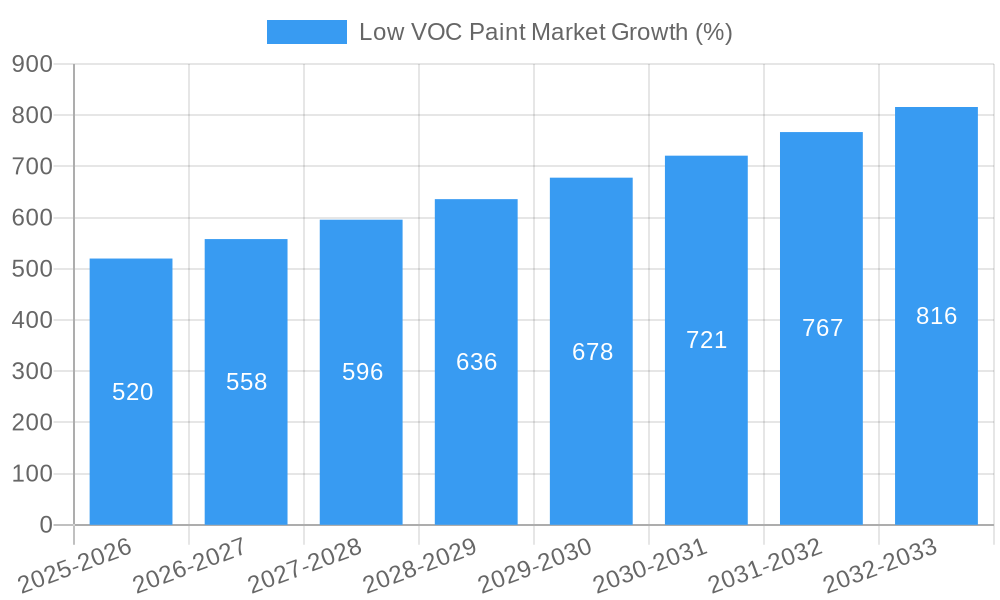
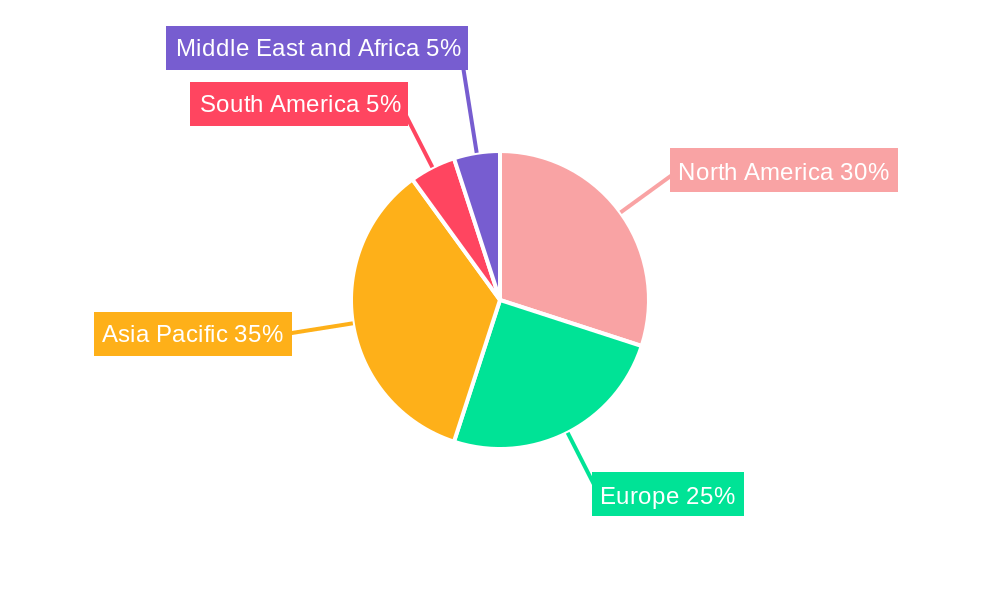
The low VOC paint market, valued at $8.84 billion in 2025, is experiencing robust growth, projected to expand at a CAGR exceeding 5.60% from 2025 to 2033. This expansion is driven by increasing environmental regulations aimed at reducing volatile organic compound (VOC) emissions, growing consumer awareness of indoor air quality, and a rising demand for eco-friendly building materials across various sectors. The architectural and decorative segment dominates the market, fueled by the construction boom and renovation activities globally. However, the general industrial, automotive (OEM and refinish), and marine sectors also contribute significantly to market growth, reflecting the increasing adoption of low-VOC paints in diverse applications demanding durability and reduced environmental impact. The water-borne formulation type holds a significant market share due to its lower VOC content compared to solvent-borne options. Furthermore, the growing popularity of powder coatings, particularly in industrial applications, further boosts market expansion. Regional variations exist, with Asia Pacific projected as a key growth driver, primarily due to rapid urbanization and industrialization in countries like China and India. North America and Europe also maintain significant market shares, driven by stringent environmental regulations and a focus on sustainable building practices. Competition in this sector is intense, with major players like Sherwin-Williams, PPG Industries, Akzo Nobel, and Asian Paints vying for market dominance through innovation in product formulations, expansion into new markets, and strategic acquisitions.
The market's future trajectory hinges on several factors. Continued advancements in paint technology leading to even lower VOC content and enhanced performance characteristics will be crucial. Government initiatives promoting sustainable building practices and stricter emission control regulations will further stimulate demand. Fluctuations in raw material prices and economic conditions will influence the market’s growth rate. However, the long-term outlook remains positive, with the increasing focus on sustainability and public health likely driving continued expansion of the low-VOC paint market throughout the forecast period. The emergence of bio-based and natural paints further reinforces the market's sustainable growth trajectory. Companies are actively investing in research and development to offer superior, environmentally-friendly options, which strengthens the market's long-term prospects.
Low VOC Paint Market: A Comprehensive Report (2019-2033)
This insightful report provides a detailed analysis of the Low VOC Paint Market, projecting robust growth from 2025 to 2033. We delve into market dynamics, competitive landscapes, and future opportunities, offering critical insights for stakeholders across the value chain. The study covers a comprehensive range of segments, including Low-VOC, No or Zero VOC, and Natural paints, examining various formulation types (water-borne, solvent-borne, powder) and applications spanning Architecture & Decorative, General Industrial, Automotive (OEM & Refinish), Marine, Consumer Durables, and other specialized sectors (Pharmaceuticals, Electronics). The report leverages data from the historical period (2019-2024), with 2025 serving as the base and estimated year, projecting market trends through 2033. Key players such as The Sherwin-Williams Company, Arkema, Jotun, and many more are analyzed, offering a complete understanding of this evolving market. The market value is expected to reach xx Million by 2033.
Low VOC Paint Market Composition & Trends
This section evaluates the Low VOC paint market's competitive intensity, identifying key innovation drivers and regulatory influences. We analyze market share distribution among leading players like The Sherwin-Williams Company, PPG Industries Inc, and Akzo Nobel N.V., assessing the impact of M&A activities (with estimated deal values reaching xx Million in recent years) on market consolidation. The report further explores the evolving regulatory landscape, the impact of substitute products, detailed end-user profiles, and emerging trends shaping the market.
- Market Concentration: Highly fragmented, with top 5 players holding approximately xx% market share in 2025.
- Innovation Catalysts: Growing demand for sustainable products, stringent VOC regulations, and advancements in water-borne technologies.
- Regulatory Landscape: Stringent environmental regulations driving adoption of low-VOC paints across various applications.
- Substitute Products: Limited viable substitutes, primarily traditional high-VOC paints, facing increasing regulatory pressure.
- End-User Profiles: Diverse, encompassing construction companies, automotive manufacturers, and individual consumers.
- M&A Activity: Consolidation through strategic acquisitions, with deal values averaging xx Million per transaction in the past 5 years.
Low VOC Paint Market Industry Evolution
This section delves into the historical (2019-2024) and projected (2025-2033) growth trajectories of the Low VOC paint market. We analyze the influence of technological advancements, particularly in water-borne formulations and nanotechnology, alongside evolving consumer preferences for environmentally friendly products. The market experienced a Compound Annual Growth Rate (CAGR) of xx% during 2019-2024, and we project a CAGR of xx% from 2025 to 2033, driven by increasing environmental consciousness and stricter regulations globally. Specific data points on adoption rates of various formulation types and market penetration in key regions are included. The shift towards sustainable building practices and stricter environmental norms are key drivers in this evolution.
Leading Regions, Countries, or Segments in Low VOC Paint Market
This section identifies the leading regions, countries, and segments within the Low VOC paint market. North America is currently the dominant region, driven by stringent environmental regulations and a strong focus on sustainable construction. Within product types, water-borne formulations hold the largest market share, while the architecture and decorative segment dominates application-wise.
- Key Drivers (North America):
- Strong regulatory support for low-VOC paints.
- High consumer awareness of environmental issues.
- Significant investments in sustainable building projects.
- Key Drivers (Europe):
- Stringent EU regulations on VOC emissions.
- Growing demand for eco-friendly products in the construction sector.
- Increasing adoption of sustainable building practices.
- Dominance Factors: Stringent environmental regulations, high consumer awareness, and substantial investments in sustainable infrastructure projects contribute to the dominance of specific regions and segments.
Low VOC Paint Market Product Innovations
Recent innovations focus on enhancing the performance characteristics of low-VOC paints while maintaining their environmental benefits. Formulations incorporating nanotechnology improve durability and resistance to weathering, while advancements in water-borne technologies offer superior adhesion and faster drying times. This focus on performance parity with traditional paints is a key factor in driving market growth. Unique selling propositions increasingly center around enhanced durability, ease of application, and reduced environmental impact.
Propelling Factors for Low VOC Paint Market Growth
Several factors fuel the growth of the Low VOC paint market. Stringent government regulations limiting VOC emissions are a primary driver, compelling manufacturers and consumers to adopt low-VOC alternatives. Increased consumer awareness of the health and environmental impacts of traditional paints also plays a significant role. Furthermore, advancements in formulation technology, leading to improved performance and aesthetics of low-VOC paints, contribute significantly to market expansion.
Obstacles in the Low VOC Paint Market
The market faces certain challenges. Higher production costs compared to conventional paints can hinder adoption, particularly in price-sensitive markets. Supply chain disruptions can impact the availability of raw materials, affecting production and potentially driving up prices. Intense competition among established paint manufacturers also presents a significant hurdle for new entrants.
Future Opportunities in Low VOC Paint Market
Future opportunities lie in expanding into developing economies with growing construction sectors, where the demand for eco-friendly building materials is increasing. Advancements in bio-based and recycled content formulations represent significant potential for innovation. The development of specialized low-VOC paints for niche applications, such as medical facilities and electronics manufacturing, also presents lucrative opportunities.
Major Players in the Low VOC Paint Market Ecosystem
- The Sherwin-Williams Company
- Arkema
- Jotun
- Berger Paints India Limited
- AURO
- American Formulating & Manufacturing
- PPG Industries Inc
- Benjamin Moore & Co
- Nippon Paint Holdings Co Ltd
- BASF SE
- Cloverdale Paint Inc
- Kalekim
- Akzo Nobel N V
- BioShield Paint Company
- Crown Trade
- Axalta Coating Systems LLC
- Asian Paints
- Kansai Paint Co Ltd
- Fine Paints of Europe
Key Developments in Low VOC Paint Market Industry
- 2022-Q4: PPG Industries Inc. launched a new line of water-based low-VOC paints for architectural applications.
- 2023-Q1: Akzo Nobel N.V. announced a strategic partnership to expand its distribution network for low-VOC paints in Southeast Asia.
- 2023-Q2: The Sherwin-Williams Company acquired a smaller manufacturer specializing in bio-based low-VOC paints. (Further details would be provided in the full report.)
Strategic Low VOC Paint Market Forecast
The Low VOC paint market is poised for continued expansion, driven by sustained growth in the construction and automotive sectors, coupled with increasing demand for sustainable and eco-friendly products. Stricter environmental regulations globally will further propel market growth. The focus on innovation in formulation technologies and expansion into new applications will ensure strong market potential through 2033.
Low VOC Paint Market Segmentation
-
1. Type
- 1.1. Low-VOC
- 1.2. No or Zero VOC
- 1.3. Natural
-
2. Formulation Type
- 2.1. Water-borne
- 2.2. Solvent-borne
- 2.3. Powder
-
3. Application
- 3.1. Architecture and Decorative
- 3.2. General Industrial
- 3.3. Automotive OEM
- 3.4. Automotive Refinish
- 3.5. Marine
- 3.6. Consumer Durables
- 3.7. Other Ap
Low VOC Paint Market Segmentation By Geography
-
1. Asia Pacific
- 1.1. China
- 1.2. India
- 1.3. Japan
- 1.4. South Korea
- 1.5. Rest of Asia Pacific
-
2. North America
- 2.1. United States
- 2.2. Canada
- 2.3. Mexico
-
3. Europe
- 3.1. Germany
- 3.2. United Kingdom
- 3.3. France
- 3.4. Italy
- 3.5. Rest of Europe
-
4. South America
- 4.1. Brazil
- 4.2. Argentina
- 4.3. Rest of South America
-
5. Middle East and Africa
- 5.1. Saudi Arabia
- 5.2. South Africa
- 5.3. Rest of Middle East and Africa
Low VOC Paint Market REPORT HIGHLIGHTS
| Aspects | Details |
|---|---|
| Study Period | 2019-2033 |
| Base Year | 2024 |
| Estimated Year | 2025 |
| Forecast Period | 2025-2033 |
| Historical Period | 2019-2024 |
| Growth Rate | CAGR of > 5.60% from 2019-2033 |
| Segmentation |
|
Table of Contents
- 1. Introduction
- 1.1. Research Scope
- 1.2. Market Segmentation
- 1.3. Research Methodology
- 1.4. Definitions and Assumptions
- 2. Executive Summary
- 2.1. Introduction
- 3. Market Dynamics
- 3.1. Introduction
- 3.2. Market Drivers
- 3.2.1. Increasing Awareness about Harmful Effects of Conventional Paint4.1.2 increasing Demand in Architectural and Decorative Industry; Other Drivers
- 3.3. Market Restrains
- 3.3.1. High Cost in Comparison to Conventional Paint; Other Restraints
- 3.4. Market Trends
- 3.4.1. Architectural and Decorative Segment to Dominate the Market
- 4. Market Factor Analysis
- 4.1. Porters Five Forces
- 4.2. Supply/Value Chain
- 4.3. PESTEL analysis
- 4.4. Market Entropy
- 4.5. Patent/Trademark Analysis
- 5. Global Low VOC Paint Market Analysis, Insights and Forecast, 2019-2031
- 5.1. Market Analysis, Insights and Forecast - by Type
- 5.1.1. Low-VOC
- 5.1.2. No or Zero VOC
- 5.1.3. Natural
- 5.2. Market Analysis, Insights and Forecast - by Formulation Type
- 5.2.1. Water-borne
- 5.2.2. Solvent-borne
- 5.2.3. Powder
- 5.3. Market Analysis, Insights and Forecast - by Application
- 5.3.1. Architecture and Decorative
- 5.3.2. General Industrial
- 5.3.3. Automotive OEM
- 5.3.4. Automotive Refinish
- 5.3.5. Marine
- 5.3.6. Consumer Durables
- 5.3.7. Other Ap
- 5.4. Market Analysis, Insights and Forecast - by Region
- 5.4.1. Asia Pacific
- 5.4.2. North America
- 5.4.3. Europe
- 5.4.4. South America
- 5.4.5. Middle East and Africa
- 5.1. Market Analysis, Insights and Forecast - by Type
- 6. Asia Pacific Low VOC Paint Market Analysis, Insights and Forecast, 2019-2031
- 6.1. Market Analysis, Insights and Forecast - by Type
- 6.1.1. Low-VOC
- 6.1.2. No or Zero VOC
- 6.1.3. Natural
- 6.2. Market Analysis, Insights and Forecast - by Formulation Type
- 6.2.1. Water-borne
- 6.2.2. Solvent-borne
- 6.2.3. Powder
- 6.3. Market Analysis, Insights and Forecast - by Application
- 6.3.1. Architecture and Decorative
- 6.3.2. General Industrial
- 6.3.3. Automotive OEM
- 6.3.4. Automotive Refinish
- 6.3.5. Marine
- 6.3.6. Consumer Durables
- 6.3.7. Other Ap
- 6.1. Market Analysis, Insights and Forecast - by Type
- 7. North America Low VOC Paint Market Analysis, Insights and Forecast, 2019-2031
- 7.1. Market Analysis, Insights and Forecast - by Type
- 7.1.1. Low-VOC
- 7.1.2. No or Zero VOC
- 7.1.3. Natural
- 7.2. Market Analysis, Insights and Forecast - by Formulation Type
- 7.2.1. Water-borne
- 7.2.2. Solvent-borne
- 7.2.3. Powder
- 7.3. Market Analysis, Insights and Forecast - by Application
- 7.3.1. Architecture and Decorative
- 7.3.2. General Industrial
- 7.3.3. Automotive OEM
- 7.3.4. Automotive Refinish
- 7.3.5. Marine
- 7.3.6. Consumer Durables
- 7.3.7. Other Ap
- 7.1. Market Analysis, Insights and Forecast - by Type
- 8. Europe Low VOC Paint Market Analysis, Insights and Forecast, 2019-2031
- 8.1. Market Analysis, Insights and Forecast - by Type
- 8.1.1. Low-VOC
- 8.1.2. No or Zero VOC
- 8.1.3. Natural
- 8.2. Market Analysis, Insights and Forecast - by Formulation Type
- 8.2.1. Water-borne
- 8.2.2. Solvent-borne
- 8.2.3. Powder
- 8.3. Market Analysis, Insights and Forecast - by Application
- 8.3.1. Architecture and Decorative
- 8.3.2. General Industrial
- 8.3.3. Automotive OEM
- 8.3.4. Automotive Refinish
- 8.3.5. Marine
- 8.3.6. Consumer Durables
- 8.3.7. Other Ap
- 8.1. Market Analysis, Insights and Forecast - by Type
- 9. South America Low VOC Paint Market Analysis, Insights and Forecast, 2019-2031
- 9.1. Market Analysis, Insights and Forecast - by Type
- 9.1.1. Low-VOC
- 9.1.2. No or Zero VOC
- 9.1.3. Natural
- 9.2. Market Analysis, Insights and Forecast - by Formulation Type
- 9.2.1. Water-borne
- 9.2.2. Solvent-borne
- 9.2.3. Powder
- 9.3. Market Analysis, Insights and Forecast - by Application
- 9.3.1. Architecture and Decorative
- 9.3.2. General Industrial
- 9.3.3. Automotive OEM
- 9.3.4. Automotive Refinish
- 9.3.5. Marine
- 9.3.6. Consumer Durables
- 9.3.7. Other Ap
- 9.1. Market Analysis, Insights and Forecast - by Type
- 10. Middle East and Africa Low VOC Paint Market Analysis, Insights and Forecast, 2019-2031
- 10.1. Market Analysis, Insights and Forecast - by Type
- 10.1.1. Low-VOC
- 10.1.2. No or Zero VOC
- 10.1.3. Natural
- 10.2. Market Analysis, Insights and Forecast - by Formulation Type
- 10.2.1. Water-borne
- 10.2.2. Solvent-borne
- 10.2.3. Powder
- 10.3. Market Analysis, Insights and Forecast - by Application
- 10.3.1. Architecture and Decorative
- 10.3.2. General Industrial
- 10.3.3. Automotive OEM
- 10.3.4. Automotive Refinish
- 10.3.5. Marine
- 10.3.6. Consumer Durables
- 10.3.7. Other Ap
- 10.1. Market Analysis, Insights and Forecast - by Type
- 11. Asia Pacific Low VOC Paint Market Analysis, Insights and Forecast, 2019-2031
- 11.1. Market Analysis, Insights and Forecast - By Country/Sub-region
- 11.1.1 China
- 11.1.2 India
- 11.1.3 Japan
- 11.1.4 South Korea
- 11.1.5 Rest of Asia Pacific
- 12. North America Low VOC Paint Market Analysis, Insights and Forecast, 2019-2031
- 12.1. Market Analysis, Insights and Forecast - By Country/Sub-region
- 12.1.1 United States
- 12.1.2 Canada
- 12.1.3 Mexico
- 13. Europe Low VOC Paint Market Analysis, Insights and Forecast, 2019-2031
- 13.1. Market Analysis, Insights and Forecast - By Country/Sub-region
- 13.1.1 Germany
- 13.1.2 United Kingdom
- 13.1.3 France
- 13.1.4 Italy
- 13.1.5 Rest of Europe
- 14. South America Low VOC Paint Market Analysis, Insights and Forecast, 2019-2031
- 14.1. Market Analysis, Insights and Forecast - By Country/Sub-region
- 14.1.1 Brazil
- 14.1.2 Argentina
- 14.1.3 Rest of South America
- 15. Middle East and Africa Low VOC Paint Market Analysis, Insights and Forecast, 2019-2031
- 15.1. Market Analysis, Insights and Forecast - By Country/Sub-region
- 15.1.1 Saudi Arabia
- 15.1.2 South Africa
- 15.1.3 Rest of Middle East and Africa
- 16. Competitive Analysis
- 16.1. Global Market Share Analysis 2024
- 16.2. Company Profiles
- 16.2.1 The Sherwin-Williams Company*List Not Exhaustive
- 16.2.1.1. Overview
- 16.2.1.2. Products
- 16.2.1.3. SWOT Analysis
- 16.2.1.4. Recent Developments
- 16.2.1.5. Financials (Based on Availability)
- 16.2.2 Arkema
- 16.2.2.1. Overview
- 16.2.2.2. Products
- 16.2.2.3. SWOT Analysis
- 16.2.2.4. Recent Developments
- 16.2.2.5. Financials (Based on Availability)
- 16.2.3 Jotun
- 16.2.3.1. Overview
- 16.2.3.2. Products
- 16.2.3.3. SWOT Analysis
- 16.2.3.4. Recent Developments
- 16.2.3.5. Financials (Based on Availability)
- 16.2.4 Berger Paints India Limited
- 16.2.4.1. Overview
- 16.2.4.2. Products
- 16.2.4.3. SWOT Analysis
- 16.2.4.4. Recent Developments
- 16.2.4.5. Financials (Based on Availability)
- 16.2.5 AURO
- 16.2.5.1. Overview
- 16.2.5.2. Products
- 16.2.5.3. SWOT Analysis
- 16.2.5.4. Recent Developments
- 16.2.5.5. Financials (Based on Availability)
- 16.2.6 American Formulating & Manufacturing
- 16.2.6.1. Overview
- 16.2.6.2. Products
- 16.2.6.3. SWOT Analysis
- 16.2.6.4. Recent Developments
- 16.2.6.5. Financials (Based on Availability)
- 16.2.7 PPG Industries Inc
- 16.2.7.1. Overview
- 16.2.7.2. Products
- 16.2.7.3. SWOT Analysis
- 16.2.7.4. Recent Developments
- 16.2.7.5. Financials (Based on Availability)
- 16.2.8 Benjamin Moore & Co
- 16.2.8.1. Overview
- 16.2.8.2. Products
- 16.2.8.3. SWOT Analysis
- 16.2.8.4. Recent Developments
- 16.2.8.5. Financials (Based on Availability)
- 16.2.9 Nippon Paint Holdings Co Ltd
- 16.2.9.1. Overview
- 16.2.9.2. Products
- 16.2.9.3. SWOT Analysis
- 16.2.9.4. Recent Developments
- 16.2.9.5. Financials (Based on Availability)
- 16.2.10 BASF SE
- 16.2.10.1. Overview
- 16.2.10.2. Products
- 16.2.10.3. SWOT Analysis
- 16.2.10.4. Recent Developments
- 16.2.10.5. Financials (Based on Availability)
- 16.2.11 Cloverdale Paint Inc
- 16.2.11.1. Overview
- 16.2.11.2. Products
- 16.2.11.3. SWOT Analysis
- 16.2.11.4. Recent Developments
- 16.2.11.5. Financials (Based on Availability)
- 16.2.12 Kalekim
- 16.2.12.1. Overview
- 16.2.12.2. Products
- 16.2.12.3. SWOT Analysis
- 16.2.12.4. Recent Developments
- 16.2.12.5. Financials (Based on Availability)
- 16.2.13 Akzo Nobel N V
- 16.2.13.1. Overview
- 16.2.13.2. Products
- 16.2.13.3. SWOT Analysis
- 16.2.13.4. Recent Developments
- 16.2.13.5. Financials (Based on Availability)
- 16.2.14 BioShield Paint Company
- 16.2.14.1. Overview
- 16.2.14.2. Products
- 16.2.14.3. SWOT Analysis
- 16.2.14.4. Recent Developments
- 16.2.14.5. Financials (Based on Availability)
- 16.2.15 Crown Trade
- 16.2.15.1. Overview
- 16.2.15.2. Products
- 16.2.15.3. SWOT Analysis
- 16.2.15.4. Recent Developments
- 16.2.15.5. Financials (Based on Availability)
- 16.2.16 Axalta Coating Systems LLC
- 16.2.16.1. Overview
- 16.2.16.2. Products
- 16.2.16.3. SWOT Analysis
- 16.2.16.4. Recent Developments
- 16.2.16.5. Financials (Based on Availability)
- 16.2.17 Asian Paints
- 16.2.17.1. Overview
- 16.2.17.2. Products
- 16.2.17.3. SWOT Analysis
- 16.2.17.4. Recent Developments
- 16.2.17.5. Financials (Based on Availability)
- 16.2.18 Kansai Paint Co Ltd
- 16.2.18.1. Overview
- 16.2.18.2. Products
- 16.2.18.3. SWOT Analysis
- 16.2.18.4. Recent Developments
- 16.2.18.5. Financials (Based on Availability)
- 16.2.19 Fine Paints of Europe
- 16.2.19.1. Overview
- 16.2.19.2. Products
- 16.2.19.3. SWOT Analysis
- 16.2.19.4. Recent Developments
- 16.2.19.5. Financials (Based on Availability)
- 16.2.1 The Sherwin-Williams Company*List Not Exhaustive
List of Figures
- Figure 1: Global Low VOC Paint Market Revenue Breakdown (Million, %) by Region 2024 & 2032
- Figure 2: Global Low VOC Paint Market Volume Breakdown (K Tons, %) by Region 2024 & 2032
- Figure 3: Asia Pacific Low VOC Paint Market Revenue (Million), by Country 2024 & 2032
- Figure 4: Asia Pacific Low VOC Paint Market Volume (K Tons), by Country 2024 & 2032
- Figure 5: Asia Pacific Low VOC Paint Market Revenue Share (%), by Country 2024 & 2032
- Figure 6: Asia Pacific Low VOC Paint Market Volume Share (%), by Country 2024 & 2032
- Figure 7: North America Low VOC Paint Market Revenue (Million), by Country 2024 & 2032
- Figure 8: North America Low VOC Paint Market Volume (K Tons), by Country 2024 & 2032
- Figure 9: North America Low VOC Paint Market Revenue Share (%), by Country 2024 & 2032
- Figure 10: North America Low VOC Paint Market Volume Share (%), by Country 2024 & 2032
- Figure 11: Europe Low VOC Paint Market Revenue (Million), by Country 2024 & 2032
- Figure 12: Europe Low VOC Paint Market Volume (K Tons), by Country 2024 & 2032
- Figure 13: Europe Low VOC Paint Market Revenue Share (%), by Country 2024 & 2032
- Figure 14: Europe Low VOC Paint Market Volume Share (%), by Country 2024 & 2032
- Figure 15: South America Low VOC Paint Market Revenue (Million), by Country 2024 & 2032
- Figure 16: South America Low VOC Paint Market Volume (K Tons), by Country 2024 & 2032
- Figure 17: South America Low VOC Paint Market Revenue Share (%), by Country 2024 & 2032
- Figure 18: South America Low VOC Paint Market Volume Share (%), by Country 2024 & 2032
- Figure 19: Middle East and Africa Low VOC Paint Market Revenue (Million), by Country 2024 & 2032
- Figure 20: Middle East and Africa Low VOC Paint Market Volume (K Tons), by Country 2024 & 2032
- Figure 21: Middle East and Africa Low VOC Paint Market Revenue Share (%), by Country 2024 & 2032
- Figure 22: Middle East and Africa Low VOC Paint Market Volume Share (%), by Country 2024 & 2032
- Figure 23: Asia Pacific Low VOC Paint Market Revenue (Million), by Type 2024 & 2032
- Figure 24: Asia Pacific Low VOC Paint Market Volume (K Tons), by Type 2024 & 2032
- Figure 25: Asia Pacific Low VOC Paint Market Revenue Share (%), by Type 2024 & 2032
- Figure 26: Asia Pacific Low VOC Paint Market Volume Share (%), by Type 2024 & 2032
- Figure 27: Asia Pacific Low VOC Paint Market Revenue (Million), by Formulation Type 2024 & 2032
- Figure 28: Asia Pacific Low VOC Paint Market Volume (K Tons), by Formulation Type 2024 & 2032
- Figure 29: Asia Pacific Low VOC Paint Market Revenue Share (%), by Formulation Type 2024 & 2032
- Figure 30: Asia Pacific Low VOC Paint Market Volume Share (%), by Formulation Type 2024 & 2032
- Figure 31: Asia Pacific Low VOC Paint Market Revenue (Million), by Application 2024 & 2032
- Figure 32: Asia Pacific Low VOC Paint Market Volume (K Tons), by Application 2024 & 2032
- Figure 33: Asia Pacific Low VOC Paint Market Revenue Share (%), by Application 2024 & 2032
- Figure 34: Asia Pacific Low VOC Paint Market Volume Share (%), by Application 2024 & 2032
- Figure 35: Asia Pacific Low VOC Paint Market Revenue (Million), by Country 2024 & 2032
- Figure 36: Asia Pacific Low VOC Paint Market Volume (K Tons), by Country 2024 & 2032
- Figure 37: Asia Pacific Low VOC Paint Market Revenue Share (%), by Country 2024 & 2032
- Figure 38: Asia Pacific Low VOC Paint Market Volume Share (%), by Country 2024 & 2032
- Figure 39: North America Low VOC Paint Market Revenue (Million), by Type 2024 & 2032
- Figure 40: North America Low VOC Paint Market Volume (K Tons), by Type 2024 & 2032
- Figure 41: North America Low VOC Paint Market Revenue Share (%), by Type 2024 & 2032
- Figure 42: North America Low VOC Paint Market Volume Share (%), by Type 2024 & 2032
- Figure 43: North America Low VOC Paint Market Revenue (Million), by Formulation Type 2024 & 2032
- Figure 44: North America Low VOC Paint Market Volume (K Tons), by Formulation Type 2024 & 2032
- Figure 45: North America Low VOC Paint Market Revenue Share (%), by Formulation Type 2024 & 2032
- Figure 46: North America Low VOC Paint Market Volume Share (%), by Formulation Type 2024 & 2032
- Figure 47: North America Low VOC Paint Market Revenue (Million), by Application 2024 & 2032
- Figure 48: North America Low VOC Paint Market Volume (K Tons), by Application 2024 & 2032
- Figure 49: North America Low VOC Paint Market Revenue Share (%), by Application 2024 & 2032
- Figure 50: North America Low VOC Paint Market Volume Share (%), by Application 2024 & 2032
- Figure 51: North America Low VOC Paint Market Revenue (Million), by Country 2024 & 2032
- Figure 52: North America Low VOC Paint Market Volume (K Tons), by Country 2024 & 2032
- Figure 53: North America Low VOC Paint Market Revenue Share (%), by Country 2024 & 2032
- Figure 54: North America Low VOC Paint Market Volume Share (%), by Country 2024 & 2032
- Figure 55: Europe Low VOC Paint Market Revenue (Million), by Type 2024 & 2032
- Figure 56: Europe Low VOC Paint Market Volume (K Tons), by Type 2024 & 2032
- Figure 57: Europe Low VOC Paint Market Revenue Share (%), by Type 2024 & 2032
- Figure 58: Europe Low VOC Paint Market Volume Share (%), by Type 2024 & 2032
- Figure 59: Europe Low VOC Paint Market Revenue (Million), by Formulation Type 2024 & 2032
- Figure 60: Europe Low VOC Paint Market Volume (K Tons), by Formulation Type 2024 & 2032
- Figure 61: Europe Low VOC Paint Market Revenue Share (%), by Formulation Type 2024 & 2032
- Figure 62: Europe Low VOC Paint Market Volume Share (%), by Formulation Type 2024 & 2032
- Figure 63: Europe Low VOC Paint Market Revenue (Million), by Application 2024 & 2032
- Figure 64: Europe Low VOC Paint Market Volume (K Tons), by Application 2024 & 2032
- Figure 65: Europe Low VOC Paint Market Revenue Share (%), by Application 2024 & 2032
- Figure 66: Europe Low VOC Paint Market Volume Share (%), by Application 2024 & 2032
- Figure 67: Europe Low VOC Paint Market Revenue (Million), by Country 2024 & 2032
- Figure 68: Europe Low VOC Paint Market Volume (K Tons), by Country 2024 & 2032
- Figure 69: Europe Low VOC Paint Market Revenue Share (%), by Country 2024 & 2032
- Figure 70: Europe Low VOC Paint Market Volume Share (%), by Country 2024 & 2032
- Figure 71: South America Low VOC Paint Market Revenue (Million), by Type 2024 & 2032
- Figure 72: South America Low VOC Paint Market Volume (K Tons), by Type 2024 & 2032
- Figure 73: South America Low VOC Paint Market Revenue Share (%), by Type 2024 & 2032
- Figure 74: South America Low VOC Paint Market Volume Share (%), by Type 2024 & 2032
- Figure 75: South America Low VOC Paint Market Revenue (Million), by Formulation Type 2024 & 2032
- Figure 76: South America Low VOC Paint Market Volume (K Tons), by Formulation Type 2024 & 2032
- Figure 77: South America Low VOC Paint Market Revenue Share (%), by Formulation Type 2024 & 2032
- Figure 78: South America Low VOC Paint Market Volume Share (%), by Formulation Type 2024 & 2032
- Figure 79: South America Low VOC Paint Market Revenue (Million), by Application 2024 & 2032
- Figure 80: South America Low VOC Paint Market Volume (K Tons), by Application 2024 & 2032
- Figure 81: South America Low VOC Paint Market Revenue Share (%), by Application 2024 & 2032
- Figure 82: South America Low VOC Paint Market Volume Share (%), by Application 2024 & 2032
- Figure 83: South America Low VOC Paint Market Revenue (Million), by Country 2024 & 2032
- Figure 84: South America Low VOC Paint Market Volume (K Tons), by Country 2024 & 2032
- Figure 85: South America Low VOC Paint Market Revenue Share (%), by Country 2024 & 2032
- Figure 86: South America Low VOC Paint Market Volume Share (%), by Country 2024 & 2032
- Figure 87: Middle East and Africa Low VOC Paint Market Revenue (Million), by Type 2024 & 2032
- Figure 88: Middle East and Africa Low VOC Paint Market Volume (K Tons), by Type 2024 & 2032
- Figure 89: Middle East and Africa Low VOC Paint Market Revenue Share (%), by Type 2024 & 2032
- Figure 90: Middle East and Africa Low VOC Paint Market Volume Share (%), by Type 2024 & 2032
- Figure 91: Middle East and Africa Low VOC Paint Market Revenue (Million), by Formulation Type 2024 & 2032
- Figure 92: Middle East and Africa Low VOC Paint Market Volume (K Tons), by Formulation Type 2024 & 2032
- Figure 93: Middle East and Africa Low VOC Paint Market Revenue Share (%), by Formulation Type 2024 & 2032
- Figure 94: Middle East and Africa Low VOC Paint Market Volume Share (%), by Formulation Type 2024 & 2032
- Figure 95: Middle East and Africa Low VOC Paint Market Revenue (Million), by Application 2024 & 2032
- Figure 96: Middle East and Africa Low VOC Paint Market Volume (K Tons), by Application 2024 & 2032
- Figure 97: Middle East and Africa Low VOC Paint Market Revenue Share (%), by Application 2024 & 2032
- Figure 98: Middle East and Africa Low VOC Paint Market Volume Share (%), by Application 2024 & 2032
- Figure 99: Middle East and Africa Low VOC Paint Market Revenue (Million), by Country 2024 & 2032
- Figure 100: Middle East and Africa Low VOC Paint Market Volume (K Tons), by Country 2024 & 2032
- Figure 101: Middle East and Africa Low VOC Paint Market Revenue Share (%), by Country 2024 & 2032
- Figure 102: Middle East and Africa Low VOC Paint Market Volume Share (%), by Country 2024 & 2032
List of Tables
- Table 1: Global Low VOC Paint Market Revenue Million Forecast, by Region 2019 & 2032
- Table 2: Global Low VOC Paint Market Volume K Tons Forecast, by Region 2019 & 2032
- Table 3: Global Low VOC Paint Market Revenue Million Forecast, by Type 2019 & 2032
- Table 4: Global Low VOC Paint Market Volume K Tons Forecast, by Type 2019 & 2032
- Table 5: Global Low VOC Paint Market Revenue Million Forecast, by Formulation Type 2019 & 2032
- Table 6: Global Low VOC Paint Market Volume K Tons Forecast, by Formulation Type 2019 & 2032
- Table 7: Global Low VOC Paint Market Revenue Million Forecast, by Application 2019 & 2032
- Table 8: Global Low VOC Paint Market Volume K Tons Forecast, by Application 2019 & 2032
- Table 9: Global Low VOC Paint Market Revenue Million Forecast, by Region 2019 & 2032
- Table 10: Global Low VOC Paint Market Volume K Tons Forecast, by Region 2019 & 2032
- Table 11: Global Low VOC Paint Market Revenue Million Forecast, by Country 2019 & 2032
- Table 12: Global Low VOC Paint Market Volume K Tons Forecast, by Country 2019 & 2032
- Table 13: China Low VOC Paint Market Revenue (Million) Forecast, by Application 2019 & 2032
- Table 14: China Low VOC Paint Market Volume (K Tons) Forecast, by Application 2019 & 2032
- Table 15: India Low VOC Paint Market Revenue (Million) Forecast, by Application 2019 & 2032
- Table 16: India Low VOC Paint Market Volume (K Tons) Forecast, by Application 2019 & 2032
- Table 17: Japan Low VOC Paint Market Revenue (Million) Forecast, by Application 2019 & 2032
- Table 18: Japan Low VOC Paint Market Volume (K Tons) Forecast, by Application 2019 & 2032
- Table 19: South Korea Low VOC Paint Market Revenue (Million) Forecast, by Application 2019 & 2032
- Table 20: South Korea Low VOC Paint Market Volume (K Tons) Forecast, by Application 2019 & 2032
- Table 21: Rest of Asia Pacific Low VOC Paint Market Revenue (Million) Forecast, by Application 2019 & 2032
- Table 22: Rest of Asia Pacific Low VOC Paint Market Volume (K Tons) Forecast, by Application 2019 & 2032
- Table 23: Global Low VOC Paint Market Revenue Million Forecast, by Country 2019 & 2032
- Table 24: Global Low VOC Paint Market Volume K Tons Forecast, by Country 2019 & 2032
- Table 25: United States Low VOC Paint Market Revenue (Million) Forecast, by Application 2019 & 2032
- Table 26: United States Low VOC Paint Market Volume (K Tons) Forecast, by Application 2019 & 2032
- Table 27: Canada Low VOC Paint Market Revenue (Million) Forecast, by Application 2019 & 2032
- Table 28: Canada Low VOC Paint Market Volume (K Tons) Forecast, by Application 2019 & 2032
- Table 29: Mexico Low VOC Paint Market Revenue (Million) Forecast, by Application 2019 & 2032
- Table 30: Mexico Low VOC Paint Market Volume (K Tons) Forecast, by Application 2019 & 2032
- Table 31: Global Low VOC Paint Market Revenue Million Forecast, by Country 2019 & 2032
- Table 32: Global Low VOC Paint Market Volume K Tons Forecast, by Country 2019 & 2032
- Table 33: Germany Low VOC Paint Market Revenue (Million) Forecast, by Application 2019 & 2032
- Table 34: Germany Low VOC Paint Market Volume (K Tons) Forecast, by Application 2019 & 2032
- Table 35: United Kingdom Low VOC Paint Market Revenue (Million) Forecast, by Application 2019 & 2032
- Table 36: United Kingdom Low VOC Paint Market Volume (K Tons) Forecast, by Application 2019 & 2032
- Table 37: France Low VOC Paint Market Revenue (Million) Forecast, by Application 2019 & 2032
- Table 38: France Low VOC Paint Market Volume (K Tons) Forecast, by Application 2019 & 2032
- Table 39: Italy Low VOC Paint Market Revenue (Million) Forecast, by Application 2019 & 2032
- Table 40: Italy Low VOC Paint Market Volume (K Tons) Forecast, by Application 2019 & 2032
- Table 41: Rest of Europe Low VOC Paint Market Revenue (Million) Forecast, by Application 2019 & 2032
- Table 42: Rest of Europe Low VOC Paint Market Volume (K Tons) Forecast, by Application 2019 & 2032
- Table 43: Global Low VOC Paint Market Revenue Million Forecast, by Country 2019 & 2032
- Table 44: Global Low VOC Paint Market Volume K Tons Forecast, by Country 2019 & 2032
- Table 45: Brazil Low VOC Paint Market Revenue (Million) Forecast, by Application 2019 & 2032
- Table 46: Brazil Low VOC Paint Market Volume (K Tons) Forecast, by Application 2019 & 2032
- Table 47: Argentina Low VOC Paint Market Revenue (Million) Forecast, by Application 2019 & 2032
- Table 48: Argentina Low VOC Paint Market Volume (K Tons) Forecast, by Application 2019 & 2032
- Table 49: Rest of South America Low VOC Paint Market Revenue (Million) Forecast, by Application 2019 & 2032
- Table 50: Rest of South America Low VOC Paint Market Volume (K Tons) Forecast, by Application 2019 & 2032
- Table 51: Global Low VOC Paint Market Revenue Million Forecast, by Country 2019 & 2032
- Table 52: Global Low VOC Paint Market Volume K Tons Forecast, by Country 2019 & 2032
- Table 53: Saudi Arabia Low VOC Paint Market Revenue (Million) Forecast, by Application 2019 & 2032
- Table 54: Saudi Arabia Low VOC Paint Market Volume (K Tons) Forecast, by Application 2019 & 2032
- Table 55: South Africa Low VOC Paint Market Revenue (Million) Forecast, by Application 2019 & 2032
- Table 56: South Africa Low VOC Paint Market Volume (K Tons) Forecast, by Application 2019 & 2032
- Table 57: Rest of Middle East and Africa Low VOC Paint Market Revenue (Million) Forecast, by Application 2019 & 2032
- Table 58: Rest of Middle East and Africa Low VOC Paint Market Volume (K Tons) Forecast, by Application 2019 & 2032
- Table 59: Global Low VOC Paint Market Revenue Million Forecast, by Type 2019 & 2032
- Table 60: Global Low VOC Paint Market Volume K Tons Forecast, by Type 2019 & 2032
- Table 61: Global Low VOC Paint Market Revenue Million Forecast, by Formulation Type 2019 & 2032
- Table 62: Global Low VOC Paint Market Volume K Tons Forecast, by Formulation Type 2019 & 2032
- Table 63: Global Low VOC Paint Market Revenue Million Forecast, by Application 2019 & 2032
- Table 64: Global Low VOC Paint Market Volume K Tons Forecast, by Application 2019 & 2032
- Table 65: Global Low VOC Paint Market Revenue Million Forecast, by Country 2019 & 2032
- Table 66: Global Low VOC Paint Market Volume K Tons Forecast, by Country 2019 & 2032
- Table 67: China Low VOC Paint Market Revenue (Million) Forecast, by Application 2019 & 2032
- Table 68: China Low VOC Paint Market Volume (K Tons) Forecast, by Application 2019 & 2032
- Table 69: India Low VOC Paint Market Revenue (Million) Forecast, by Application 2019 & 2032
- Table 70: India Low VOC Paint Market Volume (K Tons) Forecast, by Application 2019 & 2032
- Table 71: Japan Low VOC Paint Market Revenue (Million) Forecast, by Application 2019 & 2032
- Table 72: Japan Low VOC Paint Market Volume (K Tons) Forecast, by Application 2019 & 2032
- Table 73: South Korea Low VOC Paint Market Revenue (Million) Forecast, by Application 2019 & 2032
- Table 74: South Korea Low VOC Paint Market Volume (K Tons) Forecast, by Application 2019 & 2032
- Table 75: Rest of Asia Pacific Low VOC Paint Market Revenue (Million) Forecast, by Application 2019 & 2032
- Table 76: Rest of Asia Pacific Low VOC Paint Market Volume (K Tons) Forecast, by Application 2019 & 2032
- Table 77: Global Low VOC Paint Market Revenue Million Forecast, by Type 2019 & 2032
- Table 78: Global Low VOC Paint Market Volume K Tons Forecast, by Type 2019 & 2032
- Table 79: Global Low VOC Paint Market Revenue Million Forecast, by Formulation Type 2019 & 2032
- Table 80: Global Low VOC Paint Market Volume K Tons Forecast, by Formulation Type 2019 & 2032
- Table 81: Global Low VOC Paint Market Revenue Million Forecast, by Application 2019 & 2032
- Table 82: Global Low VOC Paint Market Volume K Tons Forecast, by Application 2019 & 2032
- Table 83: Global Low VOC Paint Market Revenue Million Forecast, by Country 2019 & 2032
- Table 84: Global Low VOC Paint Market Volume K Tons Forecast, by Country 2019 & 2032
- Table 85: United States Low VOC Paint Market Revenue (Million) Forecast, by Application 2019 & 2032
- Table 86: United States Low VOC Paint Market Volume (K Tons) Forecast, by Application 2019 & 2032
- Table 87: Canada Low VOC Paint Market Revenue (Million) Forecast, by Application 2019 & 2032
- Table 88: Canada Low VOC Paint Market Volume (K Tons) Forecast, by Application 2019 & 2032
- Table 89: Mexico Low VOC Paint Market Revenue (Million) Forecast, by Application 2019 & 2032
- Table 90: Mexico Low VOC Paint Market Volume (K Tons) Forecast, by Application 2019 & 2032
- Table 91: Global Low VOC Paint Market Revenue Million Forecast, by Type 2019 & 2032
- Table 92: Global Low VOC Paint Market Volume K Tons Forecast, by Type 2019 & 2032
- Table 93: Global Low VOC Paint Market Revenue Million Forecast, by Formulation Type 2019 & 2032
- Table 94: Global Low VOC Paint Market Volume K Tons Forecast, by Formulation Type 2019 & 2032
- Table 95: Global Low VOC Paint Market Revenue Million Forecast, by Application 2019 & 2032
- Table 96: Global Low VOC Paint Market Volume K Tons Forecast, by Application 2019 & 2032
- Table 97: Global Low VOC Paint Market Revenue Million Forecast, by Country 2019 & 2032
- Table 98: Global Low VOC Paint Market Volume K Tons Forecast, by Country 2019 & 2032
- Table 99: Germany Low VOC Paint Market Revenue (Million) Forecast, by Application 2019 & 2032
- Table 100: Germany Low VOC Paint Market Volume (K Tons) Forecast, by Application 2019 & 2032
- Table 101: United Kingdom Low VOC Paint Market Revenue (Million) Forecast, by Application 2019 & 2032
- Table 102: United Kingdom Low VOC Paint Market Volume (K Tons) Forecast, by Application 2019 & 2032
- Table 103: France Low VOC Paint Market Revenue (Million) Forecast, by Application 2019 & 2032
- Table 104: France Low VOC Paint Market Volume (K Tons) Forecast, by Application 2019 & 2032
- Table 105: Italy Low VOC Paint Market Revenue (Million) Forecast, by Application 2019 & 2032
- Table 106: Italy Low VOC Paint Market Volume (K Tons) Forecast, by Application 2019 & 2032
- Table 107: Rest of Europe Low VOC Paint Market Revenue (Million) Forecast, by Application 2019 & 2032
- Table 108: Rest of Europe Low VOC Paint Market Volume (K Tons) Forecast, by Application 2019 & 2032
- Table 109: Global Low VOC Paint Market Revenue Million Forecast, by Type 2019 & 2032
- Table 110: Global Low VOC Paint Market Volume K Tons Forecast, by Type 2019 & 2032
- Table 111: Global Low VOC Paint Market Revenue Million Forecast, by Formulation Type 2019 & 2032
- Table 112: Global Low VOC Paint Market Volume K Tons Forecast, by Formulation Type 2019 & 2032
- Table 113: Global Low VOC Paint Market Revenue Million Forecast, by Application 2019 & 2032
- Table 114: Global Low VOC Paint Market Volume K Tons Forecast, by Application 2019 & 2032
- Table 115: Global Low VOC Paint Market Revenue Million Forecast, by Country 2019 & 2032
- Table 116: Global Low VOC Paint Market Volume K Tons Forecast, by Country 2019 & 2032
- Table 117: Brazil Low VOC Paint Market Revenue (Million) Forecast, by Application 2019 & 2032
- Table 118: Brazil Low VOC Paint Market Volume (K Tons) Forecast, by Application 2019 & 2032
- Table 119: Argentina Low VOC Paint Market Revenue (Million) Forecast, by Application 2019 & 2032
- Table 120: Argentina Low VOC Paint Market Volume (K Tons) Forecast, by Application 2019 & 2032
- Table 121: Rest of South America Low VOC Paint Market Revenue (Million) Forecast, by Application 2019 & 2032
- Table 122: Rest of South America Low VOC Paint Market Volume (K Tons) Forecast, by Application 2019 & 2032
- Table 123: Global Low VOC Paint Market Revenue Million Forecast, by Type 2019 & 2032
- Table 124: Global Low VOC Paint Market Volume K Tons Forecast, by Type 2019 & 2032
- Table 125: Global Low VOC Paint Market Revenue Million Forecast, by Formulation Type 2019 & 2032
- Table 126: Global Low VOC Paint Market Volume K Tons Forecast, by Formulation Type 2019 & 2032
- Table 127: Global Low VOC Paint Market Revenue Million Forecast, by Application 2019 & 2032
- Table 128: Global Low VOC Paint Market Volume K Tons Forecast, by Application 2019 & 2032
- Table 129: Global Low VOC Paint Market Revenue Million Forecast, by Country 2019 & 2032
- Table 130: Global Low VOC Paint Market Volume K Tons Forecast, by Country 2019 & 2032
- Table 131: Saudi Arabia Low VOC Paint Market Revenue (Million) Forecast, by Application 2019 & 2032
- Table 132: Saudi Arabia Low VOC Paint Market Volume (K Tons) Forecast, by Application 2019 & 2032
- Table 133: South Africa Low VOC Paint Market Revenue (Million) Forecast, by Application 2019 & 2032
- Table 134: South Africa Low VOC Paint Market Volume (K Tons) Forecast, by Application 2019 & 2032
- Table 135: Rest of Middle East and Africa Low VOC Paint Market Revenue (Million) Forecast, by Application 2019 & 2032
- Table 136: Rest of Middle East and Africa Low VOC Paint Market Volume (K Tons) Forecast, by Application 2019 & 2032
Frequently Asked Questions
1. What is the projected Compound Annual Growth Rate (CAGR) of the Low VOC Paint Market?
The projected CAGR is approximately > 5.60%.
2. Which companies are prominent players in the Low VOC Paint Market?
Key companies in the market include The Sherwin-Williams Company*List Not Exhaustive, Arkema, Jotun, Berger Paints India Limited, AURO, American Formulating & Manufacturing, PPG Industries Inc, Benjamin Moore & Co, Nippon Paint Holdings Co Ltd, BASF SE, Cloverdale Paint Inc, Kalekim, Akzo Nobel N V, BioShield Paint Company, Crown Trade, Axalta Coating Systems LLC, Asian Paints, Kansai Paint Co Ltd, Fine Paints of Europe.
3. What are the main segments of the Low VOC Paint Market?
The market segments include Type, Formulation Type, Application.
4. Can you provide details about the market size?
The market size is estimated to be USD 8.84 Million as of 2022.
5. What are some drivers contributing to market growth?
Increasing Awareness about Harmful Effects of Conventional Paint4.1.2 increasing Demand in Architectural and Decorative Industry; Other Drivers.
6. What are the notable trends driving market growth?
Architectural and Decorative Segment to Dominate the Market.
7. Are there any restraints impacting market growth?
High Cost in Comparison to Conventional Paint; Other Restraints.
8. Can you provide examples of recent developments in the market?
N/A
9. What pricing options are available for accessing the report?
Pricing options include single-user, multi-user, and enterprise licenses priced at USD 4750, USD 5250, and USD 8750 respectively.
10. Is the market size provided in terms of value or volume?
The market size is provided in terms of value, measured in Million and volume, measured in K Tons.
11. Are there any specific market keywords associated with the report?
Yes, the market keyword associated with the report is "Low VOC Paint Market," which aids in identifying and referencing the specific market segment covered.
12. How do I determine which pricing option suits my needs best?
The pricing options vary based on user requirements and access needs. Individual users may opt for single-user licenses, while businesses requiring broader access may choose multi-user or enterprise licenses for cost-effective access to the report.
13. Are there any additional resources or data provided in the Low VOC Paint Market report?
While the report offers comprehensive insights, it's advisable to review the specific contents or supplementary materials provided to ascertain if additional resources or data are available.
14. How can I stay updated on further developments or reports in the Low VOC Paint Market?
To stay informed about further developments, trends, and reports in the Low VOC Paint Market, consider subscribing to industry newsletters, following relevant companies and organizations, or regularly checking reputable industry news sources and publications.
Methodology
Step 1 - Identification of Relevant Samples Size from Population Database


Step 2 - Approaches for Defining Global Market Size (Value, Volume* & Price*)

Note*: In applicable scenarios
Step 3 - Data Sources
Primary Research
- Web Analytics
- Survey Reports
- Research Institute
- Latest Research Reports
- Opinion Leaders
Secondary Research
- Annual Reports
- White Paper
- Latest Press Release
- Industry Association
- Paid Database
- Investor Presentations

Step 4 - Data Triangulation
Involves using different sources of information in order to increase the validity of a study
These sources are likely to be stakeholders in a program - participants, other researchers, program staff, other community members, and so on.
Then we put all data in single framework & apply various statistical tools to find out the dynamic on the market.
During the analysis stage, feedback from the stakeholder groups would be compared to determine areas of agreement as well as areas of divergence
