

Key Insights
The LNG (Liquefied Natural Gas) as a fuel industry is experiencing robust growth, driven by increasing demand for cleaner energy sources and stringent environmental regulations aimed at reducing greenhouse gas emissions from traditional fossil fuels. A compound annual growth rate (CAGR) exceeding 8% indicates a significant expansion of the market, projected to reach substantial value within the forecast period (2025-2033). This growth is fueled by several key drivers: the expanding transportation sector, particularly maritime shipping, is increasingly adopting LNG as a cleaner alternative to traditional marine fuels; the power generation sector is also a significant contributor, with LNG-fired power plants offering a relatively low-carbon solution for electricity production; and finally, the global push for energy security and diversification is encouraging nations to adopt LNG as a reliable and versatile energy source. Key regions driving this growth include North America, Europe, and Asia-Pacific, each characterized by unique market dynamics and regulatory landscapes. While challenges such as infrastructure development and price volatility persist, the overall trajectory suggests a positive outlook for LNG as a fuel, with continued expansion and penetration into various sectors.
Despite these positive trends, the LNG fuel market faces some constraints. High initial investment costs associated with LNG infrastructure development (liquefaction plants, storage terminals, and bunkering facilities) can be a barrier to entry, particularly in developing economies. Furthermore, price fluctuations linked to natural gas markets and global energy prices create uncertainty for investors and consumers. Competition from other cleaner energy sources, such as renewable energy technologies and biofuels, also poses a challenge to the LNG market's dominance. Nevertheless, the strategic positioning of LNG as a transitional fuel, bridging the gap between fossil fuels and a fully renewable energy future, offers continued opportunities for growth, even in the face of competitive pressures. The major players in the industry, including Total SA, Exxon Mobil, and Shell, are actively investing in expanding their LNG portfolios to capture market share in this dynamic and evolving landscape. The increasing adoption of LNG in heavy-duty transportation and power generation promises sustained growth in the coming decade.
LNG as a Fuel Industry: A Comprehensive Market Report (2019-2033)
This insightful report provides a comprehensive analysis of the LNG as a fuel industry, offering a detailed outlook for the period 2019-2033. With a focus on market trends, technological advancements, and key players, this study serves as an invaluable resource for stakeholders seeking to understand and capitalize on the opportunities within this dynamic sector. The report utilizes data from the historical period (2019-2024), with a base year of 2025 and a forecast period spanning 2025-2033. The total market value in 2025 is estimated at $XX Million.
LNG as a Fuel Industry Market Composition & Trends
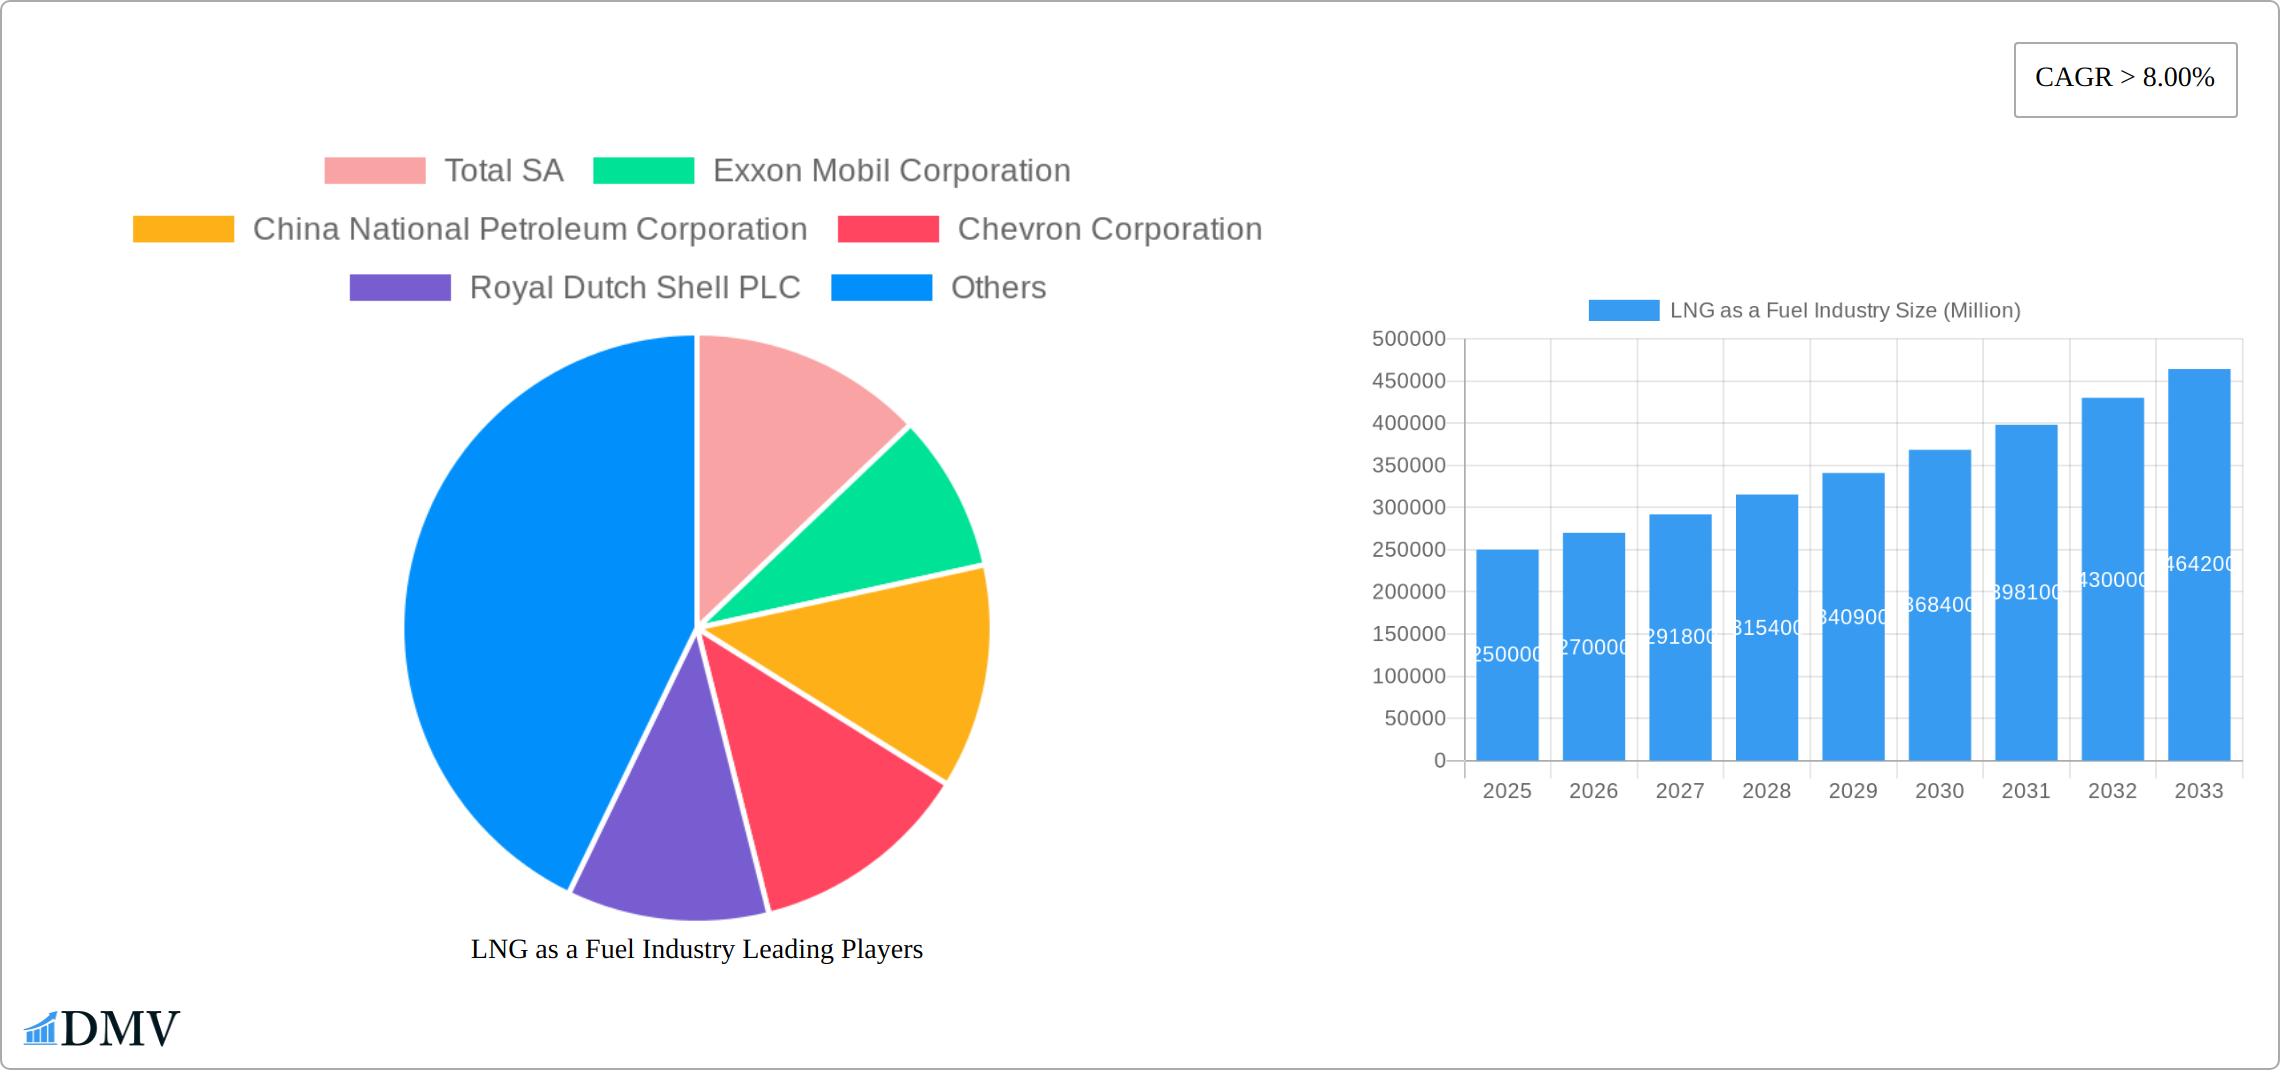
This section delves into the intricate structure of the LNG as a fuel market, examining market concentration, innovation, regulation, substitutes, end-users, and mergers & acquisitions (M&A). The analysis reveals a moderately concentrated market, with key players like Total SA, Exxon Mobil Corporation, China National Petroleum Corporation, Chevron Corporation, Royal Dutch Shell PLC, Eni SpA, BP PLC, and ConocoPhillips holding significant market share. However, the market exhibits a dynamic landscape influenced by technological advancements and regulatory changes.
- Market Share Distribution (2025): Total SA (XX%), ExxonMobil (XX%), CNPC (XX%), Chevron (XX%), Shell (XX%), Others (XX%). These figures represent estimated market share based on production and sales data.
- M&A Activity (2019-2024): A total of XX M&A deals were recorded, with a cumulative value of approximately $XX Million, signifying industry consolidation and strategic expansion. The deals mainly involved smaller companies being acquired by larger players to strengthen supply chains and expand geographical reach.
- Innovation Catalysts: The push for cleaner energy sources and the development of advanced liquefaction and regasification technologies are driving innovation.
- Regulatory Landscape: Stringent environmental regulations are shaping the industry, influencing investment decisions and pushing towards cleaner fuel solutions.
- Substitute Products: Competition from other fuels like natural gas and renewable energy sources influences the LNG market's growth trajectory.
- End-User Profiles: The major end-users include power generation, transportation (maritime and heavy-duty vehicles), and industrial applications.

LNG as a Fuel Industry Industry Evolution
The LNG as a fuel industry is experiencing significant growth, driven by factors like increasing global energy demand, environmental regulations favoring cleaner fuels, and technological advancements improving efficiency and cost-effectiveness. The market witnessed a Compound Annual Growth Rate (CAGR) of XX% during the historical period (2019-2024) and is projected to maintain a CAGR of XX% during the forecast period (2025-2033), reaching an estimated value of $XX Million by 2033. This growth is further fueled by the expansion of LNG bunkering infrastructure, facilitating the adoption of LNG as marine fuel, and the rising demand for LNG-powered electricity generation. Technological advancements, such as improved liquefaction technologies and the development of smaller, more efficient LNG carriers, are further supporting this growth. Shifting consumer demands, particularly towards cleaner energy solutions, also significantly influence market dynamics. The adoption rate of LNG as a transportation fuel, measured by the number of LNG-powered vessels and vehicles in operation, is increasing steadily, further supporting the overall market growth.
Leading Regions, Countries, or Segments in LNG as a Fuel Industry
Asia-Pacific is identified as the leading region in the LNG as a fuel industry, driven by robust economic growth, expanding industrialization, and supportive government policies promoting cleaner energy.
- Key Drivers in Asia-Pacific:
- Significant investments in LNG import terminals and infrastructure.
- Stringent environmental regulations promoting the adoption of cleaner fuels.
- Increasing demand from power generation and industrial sectors.
- Dominance Factors:
- The region's large and rapidly growing energy demand.
- Government incentives and subsidies supporting LNG adoption.
- Strategic partnerships between international LNG suppliers and regional players.
Europe also holds a significant market share, especially within the transportation sector due to its commitment to reduce greenhouse gas emissions. North America exhibits moderate growth, fueled by domestic LNG production and demand from the power generation sector. The transportation segment (primarily maritime) shows substantial growth globally, boosted by the expansion of LNG bunkering facilities and stricter emissions regulations within the shipping industry. As of 2019, major LNG bunkering facilities were concentrated in regions like Northwest Europe, Singapore, and Japan, indicating the concentration of this application segment geographically. The power generation segment consistently shows high demand, primarily in regions with robust electricity demands.
LNG as a Fuel Industry Product Innovations
Recent innovations focus on improving the efficiency and cost-effectiveness of LNG production, transportation, and utilization. Advancements in liquefaction technologies have reduced energy consumption and emissions, while the development of smaller-scale LNG plants allows for localized production and reduced transportation costs. Moreover, the development of advanced cryogenic storage and handling systems improves safety and reduces boil-off losses. These innovations provide significant advantages in terms of cost savings and environmental impact, driving wider adoption.
Propelling Factors for LNG as a Fuel Industry Growth
Several factors fuel the growth of the LNG as a fuel industry. Stringent environmental regulations worldwide are pushing industries to adopt cleaner fuels, thus increasing demand for LNG. The availability of relatively abundant natural gas resources and improvements in LNG liquefaction and transportation technology also significantly reduce costs and increase accessibility. Moreover, government incentives and policies supporting LNG infrastructure development and utilization contribute to the industry's growth.
Obstacles in the LNG as a Fuel Industry Market
Despite the promising growth outlook, several challenges hinder the LNG as a fuel industry's expansion. The high initial investment costs associated with LNG infrastructure development can be a significant barrier, especially for smaller players. Fluctuations in natural gas prices and geopolitical uncertainties affect the cost competitiveness of LNG. Furthermore, ensuring a robust and secure supply chain is crucial to mitigate disruptions, which can impact overall market stability. Competition from other fuel sources and concerns over methane leakage during production, transportation, and consumption represent additional challenges.
Future Opportunities in LNG as a Fuel Industry
Future opportunities lie in expanding the applications of LNG beyond traditional sectors. The development of LNG-powered vehicles, particularly heavy-duty trucks and ships, presents significant growth potential. Advances in small-scale LNG production and distribution technologies could unlock new markets in remote areas or developing countries. The integration of LNG into broader energy transition strategies, particularly as a bridge fuel towards a low-carbon future, also presents substantial opportunities.
Major Players in the LNG as a Fuel Industry Ecosystem
- TotalEnergies SE
- ExxonMobil Corporation
- China National Petroleum Corporation
- Chevron Corporation
- Royal Dutch Shell PLC
- Eni SpA
- BP PLC
- ConocoPhillips
Key Developments in LNG as a Fuel Industry Industry
- Jan 2023: X Company announced a major investment in a new LNG import terminal in Y country.
- Mar 2022: Z Company launched a new line of LNG-powered heavy-duty trucks.
- June 2021: A merger between two major LNG producers resulted in significant market consolidation. (Further details would be included in the full report).
Strategic LNG as a Fuel Industry Market Forecast
The LNG as a fuel industry is poised for continued growth, driven by the increasing demand for cleaner energy, supportive government policies, and technological advancements. The market will experience significant expansion in emerging economies, particularly in Asia-Pacific. The adoption of LNG in transportation and industrial applications will further accelerate market growth. The anticipated expansion of LNG bunkering infrastructure and advancements in LNG-powered vehicle technology will significantly shape market dynamics. Overall, the forecast indicates a highly promising future for the LNG as a fuel industry, with substantial growth opportunities across various segments and regions.
LNG as a Fuel Industry Segmentation
-
1. Application
-
1.1. Transportation
- 1.1.1. Market Overview
- 1.1.2. LNG as a Bunkering Fuel Demand Forecast, till 2025
- 1.1.3. Number o
- 1.1.4. Major LN
-
1.2. Power Generation
- 1.2.1. Key LNG
-
1.1. Transportation
LNG as a Fuel Industry Segmentation By Geography
- 1. North America
- 2. Europe
- 3. Asia Pacific
- 4. South America
- 5. Middle East and Africa

LNG as a Fuel Industry REPORT HIGHLIGHTS
| Aspects | Details |
|---|---|
| Study Period | 2019-2033 |
| Base Year | 2024 |
| Estimated Year | 2025 |
| Forecast Period | 2025-2033 |
| Historical Period | 2019-2024 |
| Growth Rate | CAGR of > 8.00% from 2019-2033 |
| Segmentation |
|
Table of Contents
- 1. Introduction
- 1.1. Research Scope
- 1.2. Market Segmentation
- 1.3. Research Methodology
- 1.4. Definitions and Assumptions
- 2. Executive Summary
- 2.1. Introduction
- 3. Market Dynamics
- 3.1. Introduction
- 3.2. Market Drivers
- 3.2.1. 4.; Increasing Demand from Industrial Applications4.; Growing Infrastructure Across the World
- 3.3. Market Restrains
- 3.3.1. 4.; A Rise In Concerns Related To Carbon Emissions And A Shift Towards Electric Vehicles And Renewable Sources Of Energy
- 3.4. Market Trends
- 3.4.1. Transportation Application to Dominate the Market
- 4. Market Factor Analysis
- 4.1. Porters Five Forces
- 4.2. Supply/Value Chain
- 4.3. PESTEL analysis
- 4.4. Market Entropy
- 4.5. Patent/Trademark Analysis
- 5. Global LNG as a Fuel Industry Analysis, Insights and Forecast, 2019-2031
- 5.1. Market Analysis, Insights and Forecast - by Application
- 5.1.1. Transportation
- 5.1.1.1. Market Overview
- 5.1.1.2. LNG as a Bunkering Fuel Demand Forecast, till 2025
- 5.1.1.3. Number o
- 5.1.1.4. Major LN
- 5.1.2. Power Generation
- 5.1.2.1. Key LNG
- 5.1.1. Transportation
- 5.2. Market Analysis, Insights and Forecast - by Region
- 5.2.1. North America
- 5.2.2. Europe
- 5.2.3. Asia Pacific
- 5.2.4. South America
- 5.2.5. Middle East and Africa
- 5.1. Market Analysis, Insights and Forecast - by Application
- 6. North America LNG as a Fuel Industry Analysis, Insights and Forecast, 2019-2031
- 6.1. Market Analysis, Insights and Forecast - by Application
- 6.1.1. Transportation
- 6.1.1.1. Market Overview
- 6.1.1.2. LNG as a Bunkering Fuel Demand Forecast, till 2025
- 6.1.1.3. Number o
- 6.1.1.4. Major LN
- 6.1.2. Power Generation
- 6.1.2.1. Key LNG
- 6.1.1. Transportation
- 6.1. Market Analysis, Insights and Forecast - by Application
- 7. Europe LNG as a Fuel Industry Analysis, Insights and Forecast, 2019-2031
- 7.1. Market Analysis, Insights and Forecast - by Application
- 7.1.1. Transportation
- 7.1.1.1. Market Overview
- 7.1.1.2. LNG as a Bunkering Fuel Demand Forecast, till 2025
- 7.1.1.3. Number o
- 7.1.1.4. Major LN
- 7.1.2. Power Generation
- 7.1.2.1. Key LNG
- 7.1.1. Transportation
- 7.1. Market Analysis, Insights and Forecast - by Application
- 8. Asia Pacific LNG as a Fuel Industry Analysis, Insights and Forecast, 2019-2031
- 8.1. Market Analysis, Insights and Forecast - by Application
- 8.1.1. Transportation
- 8.1.1.1. Market Overview
- 8.1.1.2. LNG as a Bunkering Fuel Demand Forecast, till 2025
- 8.1.1.3. Number o
- 8.1.1.4. Major LN
- 8.1.2. Power Generation
- 8.1.2.1. Key LNG
- 8.1.1. Transportation
- 8.1. Market Analysis, Insights and Forecast - by Application
- 9. South America LNG as a Fuel Industry Analysis, Insights and Forecast, 2019-2031
- 9.1. Market Analysis, Insights and Forecast - by Application
- 9.1.1. Transportation
- 9.1.1.1. Market Overview
- 9.1.1.2. LNG as a Bunkering Fuel Demand Forecast, till 2025
- 9.1.1.3. Number o
- 9.1.1.4. Major LN
- 9.1.2. Power Generation
- 9.1.2.1. Key LNG
- 9.1.1. Transportation
- 9.1. Market Analysis, Insights and Forecast - by Application
- 10. Middle East and Africa LNG as a Fuel Industry Analysis, Insights and Forecast, 2019-2031
- 10.1. Market Analysis, Insights and Forecast - by Application
- 10.1.1. Transportation
- 10.1.1.1. Market Overview
- 10.1.1.2. LNG as a Bunkering Fuel Demand Forecast, till 2025
- 10.1.1.3. Number o
- 10.1.1.4. Major LN
- 10.1.2. Power Generation
- 10.1.2.1. Key LNG
- 10.1.1. Transportation
- 10.1. Market Analysis, Insights and Forecast - by Application
- 11. North America LNG as a Fuel Industry Analysis, Insights and Forecast, 2019-2031
- 11.1. Market Analysis, Insights and Forecast - By Country/Sub-region
- 11.1.1 United States
- 11.1.2 Canada
- 11.1.3 Mexico
- 12. Europe LNG as a Fuel Industry Analysis, Insights and Forecast, 2019-2031
- 12.1. Market Analysis, Insights and Forecast - By Country/Sub-region
- 12.1.1 Germany
- 12.1.2 United Kingdom
- 12.1.3 France
- 12.1.4 Spain
- 12.1.5 Italy
- 12.1.6 Spain
- 12.1.7 Belgium
- 12.1.8 Netherland
- 12.1.9 Nordics
- 12.1.10 Rest of Europe
- 13. Asia Pacific LNG as a Fuel Industry Analysis, Insights and Forecast, 2019-2031
- 13.1. Market Analysis, Insights and Forecast - By Country/Sub-region
- 13.1.1 China
- 13.1.2 Japan
- 13.1.3 India
- 13.1.4 South Korea
- 13.1.5 Southeast Asia
- 13.1.6 Australia
- 13.1.7 Indonesia
- 13.1.8 Phillipes
- 13.1.9 Singapore
- 13.1.10 Thailandc
- 13.1.11 Rest of Asia Pacific
- 14. South America LNG as a Fuel Industry Analysis, Insights and Forecast, 2019-2031
- 14.1. Market Analysis, Insights and Forecast - By Country/Sub-region
- 14.1.1 Brazil
- 14.1.2 Argentina
- 14.1.3 Peru
- 14.1.4 Chile
- 14.1.5 Colombia
- 14.1.6 Ecuador
- 14.1.7 Venezuela
- 14.1.8 Rest of South America
- 15. North America LNG as a Fuel Industry Analysis, Insights and Forecast, 2019-2031
- 15.1. Market Analysis, Insights and Forecast - By Country/Sub-region
- 15.1.1 United States
- 15.1.2 Canada
- 15.1.3 Mexico
- 16. MEA LNG as a Fuel Industry Analysis, Insights and Forecast, 2019-2031
- 16.1. Market Analysis, Insights and Forecast - By Country/Sub-region
- 16.1.1 United Arab Emirates
- 16.1.2 Saudi Arabia
- 16.1.3 South Africa
- 16.1.4 Rest of Middle East and Africa
- 17. Competitive Analysis
- 17.1. Global Market Share Analysis 2024
- 17.2. Company Profiles
- 17.2.1 Total SA
- 17.2.1.1. Overview
- 17.2.1.2. Products
- 17.2.1.3. SWOT Analysis
- 17.2.1.4. Recent Developments
- 17.2.1.5. Financials (Based on Availability)
- 17.2.2 Exxon Mobil Corporation
- 17.2.2.1. Overview
- 17.2.2.2. Products
- 17.2.2.3. SWOT Analysis
- 17.2.2.4. Recent Developments
- 17.2.2.5. Financials (Based on Availability)
- 17.2.3 China National Petroleum Corporation
- 17.2.3.1. Overview
- 17.2.3.2. Products
- 17.2.3.3. SWOT Analysis
- 17.2.3.4. Recent Developments
- 17.2.3.5. Financials (Based on Availability)
- 17.2.4 Chevron Corporation
- 17.2.4.1. Overview
- 17.2.4.2. Products
- 17.2.4.3. SWOT Analysis
- 17.2.4.4. Recent Developments
- 17.2.4.5. Financials (Based on Availability)
- 17.2.5 Royal Dutch Shell PLC
- 17.2.5.1. Overview
- 17.2.5.2. Products
- 17.2.5.3. SWOT Analysis
- 17.2.5.4. Recent Developments
- 17.2.5.5. Financials (Based on Availability)
- 17.2.6 Eni SpA*List Not Exhaustive
- 17.2.6.1. Overview
- 17.2.6.2. Products
- 17.2.6.3. SWOT Analysis
- 17.2.6.4. Recent Developments
- 17.2.6.5. Financials (Based on Availability)
- 17.2.7 BP PLC
- 17.2.7.1. Overview
- 17.2.7.2. Products
- 17.2.7.3. SWOT Analysis
- 17.2.7.4. Recent Developments
- 17.2.7.5. Financials (Based on Availability)
- 17.2.8 Conoco Philips
- 17.2.8.1. Overview
- 17.2.8.2. Products
- 17.2.8.3. SWOT Analysis
- 17.2.8.4. Recent Developments
- 17.2.8.5. Financials (Based on Availability)
- 17.2.1 Total SA
List of Figures
- Figure 1: Global LNG as a Fuel Industry Revenue Breakdown (Million, %) by Region 2024 & 2032
- Figure 2: Global LNG as a Fuel Industry Volume Breakdown (metric tonnes, %) by Region 2024 & 2032
- Figure 3: North America LNG as a Fuel Industry Revenue (Million), by Country 2024 & 2032
- Figure 4: North America LNG as a Fuel Industry Volume (metric tonnes), by Country 2024 & 2032
- Figure 5: North America LNG as a Fuel Industry Revenue Share (%), by Country 2024 & 2032
- Figure 6: North America LNG as a Fuel Industry Volume Share (%), by Country 2024 & 2032
- Figure 7: Europe LNG as a Fuel Industry Revenue (Million), by Country 2024 & 2032
- Figure 8: Europe LNG as a Fuel Industry Volume (metric tonnes), by Country 2024 & 2032
- Figure 9: Europe LNG as a Fuel Industry Revenue Share (%), by Country 2024 & 2032
- Figure 10: Europe LNG as a Fuel Industry Volume Share (%), by Country 2024 & 2032
- Figure 11: Asia Pacific LNG as a Fuel Industry Revenue (Million), by Country 2024 & 2032
- Figure 12: Asia Pacific LNG as a Fuel Industry Volume (metric tonnes), by Country 2024 & 2032
- Figure 13: Asia Pacific LNG as a Fuel Industry Revenue Share (%), by Country 2024 & 2032
- Figure 14: Asia Pacific LNG as a Fuel Industry Volume Share (%), by Country 2024 & 2032
- Figure 15: South America LNG as a Fuel Industry Revenue (Million), by Country 2024 & 2032
- Figure 16: South America LNG as a Fuel Industry Volume (metric tonnes), by Country 2024 & 2032
- Figure 17: South America LNG as a Fuel Industry Revenue Share (%), by Country 2024 & 2032
- Figure 18: South America LNG as a Fuel Industry Volume Share (%), by Country 2024 & 2032
- Figure 19: North America LNG as a Fuel Industry Revenue (Million), by Country 2024 & 2032
- Figure 20: North America LNG as a Fuel Industry Volume (metric tonnes), by Country 2024 & 2032
- Figure 21: North America LNG as a Fuel Industry Revenue Share (%), by Country 2024 & 2032
- Figure 22: North America LNG as a Fuel Industry Volume Share (%), by Country 2024 & 2032
- Figure 23: MEA LNG as a Fuel Industry Revenue (Million), by Country 2024 & 2032
- Figure 24: MEA LNG as a Fuel Industry Volume (metric tonnes), by Country 2024 & 2032
- Figure 25: MEA LNG as a Fuel Industry Revenue Share (%), by Country 2024 & 2032
- Figure 26: MEA LNG as a Fuel Industry Volume Share (%), by Country 2024 & 2032
- Figure 27: North America LNG as a Fuel Industry Revenue (Million), by Application 2024 & 2032
- Figure 28: North America LNG as a Fuel Industry Volume (metric tonnes), by Application 2024 & 2032
- Figure 29: North America LNG as a Fuel Industry Revenue Share (%), by Application 2024 & 2032
- Figure 30: North America LNG as a Fuel Industry Volume Share (%), by Application 2024 & 2032
- Figure 31: North America LNG as a Fuel Industry Revenue (Million), by Country 2024 & 2032
- Figure 32: North America LNG as a Fuel Industry Volume (metric tonnes), by Country 2024 & 2032
- Figure 33: North America LNG as a Fuel Industry Revenue Share (%), by Country 2024 & 2032
- Figure 34: North America LNG as a Fuel Industry Volume Share (%), by Country 2024 & 2032
- Figure 35: Europe LNG as a Fuel Industry Revenue (Million), by Application 2024 & 2032
- Figure 36: Europe LNG as a Fuel Industry Volume (metric tonnes), by Application 2024 & 2032
- Figure 37: Europe LNG as a Fuel Industry Revenue Share (%), by Application 2024 & 2032
- Figure 38: Europe LNG as a Fuel Industry Volume Share (%), by Application 2024 & 2032
- Figure 39: Europe LNG as a Fuel Industry Revenue (Million), by Country 2024 & 2032
- Figure 40: Europe LNG as a Fuel Industry Volume (metric tonnes), by Country 2024 & 2032
- Figure 41: Europe LNG as a Fuel Industry Revenue Share (%), by Country 2024 & 2032
- Figure 42: Europe LNG as a Fuel Industry Volume Share (%), by Country 2024 & 2032
- Figure 43: Asia Pacific LNG as a Fuel Industry Revenue (Million), by Application 2024 & 2032
- Figure 44: Asia Pacific LNG as a Fuel Industry Volume (metric tonnes), by Application 2024 & 2032
- Figure 45: Asia Pacific LNG as a Fuel Industry Revenue Share (%), by Application 2024 & 2032
- Figure 46: Asia Pacific LNG as a Fuel Industry Volume Share (%), by Application 2024 & 2032
- Figure 47: Asia Pacific LNG as a Fuel Industry Revenue (Million), by Country 2024 & 2032
- Figure 48: Asia Pacific LNG as a Fuel Industry Volume (metric tonnes), by Country 2024 & 2032
- Figure 49: Asia Pacific LNG as a Fuel Industry Revenue Share (%), by Country 2024 & 2032
- Figure 50: Asia Pacific LNG as a Fuel Industry Volume Share (%), by Country 2024 & 2032
- Figure 51: South America LNG as a Fuel Industry Revenue (Million), by Application 2024 & 2032
- Figure 52: South America LNG as a Fuel Industry Volume (metric tonnes), by Application 2024 & 2032
- Figure 53: South America LNG as a Fuel Industry Revenue Share (%), by Application 2024 & 2032
- Figure 54: South America LNG as a Fuel Industry Volume Share (%), by Application 2024 & 2032
- Figure 55: South America LNG as a Fuel Industry Revenue (Million), by Country 2024 & 2032
- Figure 56: South America LNG as a Fuel Industry Volume (metric tonnes), by Country 2024 & 2032
- Figure 57: South America LNG as a Fuel Industry Revenue Share (%), by Country 2024 & 2032
- Figure 58: South America LNG as a Fuel Industry Volume Share (%), by Country 2024 & 2032
- Figure 59: Middle East and Africa LNG as a Fuel Industry Revenue (Million), by Application 2024 & 2032
- Figure 60: Middle East and Africa LNG as a Fuel Industry Volume (metric tonnes), by Application 2024 & 2032
- Figure 61: Middle East and Africa LNG as a Fuel Industry Revenue Share (%), by Application 2024 & 2032
- Figure 62: Middle East and Africa LNG as a Fuel Industry Volume Share (%), by Application 2024 & 2032
- Figure 63: Middle East and Africa LNG as a Fuel Industry Revenue (Million), by Country 2024 & 2032
- Figure 64: Middle East and Africa LNG as a Fuel Industry Volume (metric tonnes), by Country 2024 & 2032
- Figure 65: Middle East and Africa LNG as a Fuel Industry Revenue Share (%), by Country 2024 & 2032
- Figure 66: Middle East and Africa LNG as a Fuel Industry Volume Share (%), by Country 2024 & 2032
List of Tables
- Table 1: Global LNG as a Fuel Industry Revenue Million Forecast, by Region 2019 & 2032
- Table 2: Global LNG as a Fuel Industry Volume metric tonnes Forecast, by Region 2019 & 2032
- Table 3: Global LNG as a Fuel Industry Revenue Million Forecast, by Application 2019 & 2032
- Table 4: Global LNG as a Fuel Industry Volume metric tonnes Forecast, by Application 2019 & 2032
- Table 5: Global LNG as a Fuel Industry Revenue Million Forecast, by Region 2019 & 2032
- Table 6: Global LNG as a Fuel Industry Volume metric tonnes Forecast, by Region 2019 & 2032
- Table 7: Global LNG as a Fuel Industry Revenue Million Forecast, by Country 2019 & 2032
- Table 8: Global LNG as a Fuel Industry Volume metric tonnes Forecast, by Country 2019 & 2032
- Table 9: United States LNG as a Fuel Industry Revenue (Million) Forecast, by Application 2019 & 2032
- Table 10: United States LNG as a Fuel Industry Volume (metric tonnes) Forecast, by Application 2019 & 2032
- Table 11: Canada LNG as a Fuel Industry Revenue (Million) Forecast, by Application 2019 & 2032
- Table 12: Canada LNG as a Fuel Industry Volume (metric tonnes) Forecast, by Application 2019 & 2032
- Table 13: Mexico LNG as a Fuel Industry Revenue (Million) Forecast, by Application 2019 & 2032
- Table 14: Mexico LNG as a Fuel Industry Volume (metric tonnes) Forecast, by Application 2019 & 2032
- Table 15: Global LNG as a Fuel Industry Revenue Million Forecast, by Country 2019 & 2032
- Table 16: Global LNG as a Fuel Industry Volume metric tonnes Forecast, by Country 2019 & 2032
- Table 17: Germany LNG as a Fuel Industry Revenue (Million) Forecast, by Application 2019 & 2032
- Table 18: Germany LNG as a Fuel Industry Volume (metric tonnes) Forecast, by Application 2019 & 2032
- Table 19: United Kingdom LNG as a Fuel Industry Revenue (Million) Forecast, by Application 2019 & 2032
- Table 20: United Kingdom LNG as a Fuel Industry Volume (metric tonnes) Forecast, by Application 2019 & 2032
- Table 21: France LNG as a Fuel Industry Revenue (Million) Forecast, by Application 2019 & 2032
- Table 22: France LNG as a Fuel Industry Volume (metric tonnes) Forecast, by Application 2019 & 2032
- Table 23: Spain LNG as a Fuel Industry Revenue (Million) Forecast, by Application 2019 & 2032
- Table 24: Spain LNG as a Fuel Industry Volume (metric tonnes) Forecast, by Application 2019 & 2032
- Table 25: Italy LNG as a Fuel Industry Revenue (Million) Forecast, by Application 2019 & 2032
- Table 26: Italy LNG as a Fuel Industry Volume (metric tonnes) Forecast, by Application 2019 & 2032
- Table 27: Spain LNG as a Fuel Industry Revenue (Million) Forecast, by Application 2019 & 2032
- Table 28: Spain LNG as a Fuel Industry Volume (metric tonnes) Forecast, by Application 2019 & 2032
- Table 29: Belgium LNG as a Fuel Industry Revenue (Million) Forecast, by Application 2019 & 2032
- Table 30: Belgium LNG as a Fuel Industry Volume (metric tonnes) Forecast, by Application 2019 & 2032
- Table 31: Netherland LNG as a Fuel Industry Revenue (Million) Forecast, by Application 2019 & 2032
- Table 32: Netherland LNG as a Fuel Industry Volume (metric tonnes) Forecast, by Application 2019 & 2032
- Table 33: Nordics LNG as a Fuel Industry Revenue (Million) Forecast, by Application 2019 & 2032
- Table 34: Nordics LNG as a Fuel Industry Volume (metric tonnes) Forecast, by Application 2019 & 2032
- Table 35: Rest of Europe LNG as a Fuel Industry Revenue (Million) Forecast, by Application 2019 & 2032
- Table 36: Rest of Europe LNG as a Fuel Industry Volume (metric tonnes) Forecast, by Application 2019 & 2032
- Table 37: Global LNG as a Fuel Industry Revenue Million Forecast, by Country 2019 & 2032
- Table 38: Global LNG as a Fuel Industry Volume metric tonnes Forecast, by Country 2019 & 2032
- Table 39: China LNG as a Fuel Industry Revenue (Million) Forecast, by Application 2019 & 2032
- Table 40: China LNG as a Fuel Industry Volume (metric tonnes) Forecast, by Application 2019 & 2032
- Table 41: Japan LNG as a Fuel Industry Revenue (Million) Forecast, by Application 2019 & 2032
- Table 42: Japan LNG as a Fuel Industry Volume (metric tonnes) Forecast, by Application 2019 & 2032
- Table 43: India LNG as a Fuel Industry Revenue (Million) Forecast, by Application 2019 & 2032
- Table 44: India LNG as a Fuel Industry Volume (metric tonnes) Forecast, by Application 2019 & 2032
- Table 45: South Korea LNG as a Fuel Industry Revenue (Million) Forecast, by Application 2019 & 2032
- Table 46: South Korea LNG as a Fuel Industry Volume (metric tonnes) Forecast, by Application 2019 & 2032
- Table 47: Southeast Asia LNG as a Fuel Industry Revenue (Million) Forecast, by Application 2019 & 2032
- Table 48: Southeast Asia LNG as a Fuel Industry Volume (metric tonnes) Forecast, by Application 2019 & 2032
- Table 49: Australia LNG as a Fuel Industry Revenue (Million) Forecast, by Application 2019 & 2032
- Table 50: Australia LNG as a Fuel Industry Volume (metric tonnes) Forecast, by Application 2019 & 2032
- Table 51: Indonesia LNG as a Fuel Industry Revenue (Million) Forecast, by Application 2019 & 2032
- Table 52: Indonesia LNG as a Fuel Industry Volume (metric tonnes) Forecast, by Application 2019 & 2032
- Table 53: Phillipes LNG as a Fuel Industry Revenue (Million) Forecast, by Application 2019 & 2032
- Table 54: Phillipes LNG as a Fuel Industry Volume (metric tonnes) Forecast, by Application 2019 & 2032
- Table 55: Singapore LNG as a Fuel Industry Revenue (Million) Forecast, by Application 2019 & 2032
- Table 56: Singapore LNG as a Fuel Industry Volume (metric tonnes) Forecast, by Application 2019 & 2032
- Table 57: Thailandc LNG as a Fuel Industry Revenue (Million) Forecast, by Application 2019 & 2032
- Table 58: Thailandc LNG as a Fuel Industry Volume (metric tonnes) Forecast, by Application 2019 & 2032
- Table 59: Rest of Asia Pacific LNG as a Fuel Industry Revenue (Million) Forecast, by Application 2019 & 2032
- Table 60: Rest of Asia Pacific LNG as a Fuel Industry Volume (metric tonnes) Forecast, by Application 2019 & 2032
- Table 61: Global LNG as a Fuel Industry Revenue Million Forecast, by Country 2019 & 2032
- Table 62: Global LNG as a Fuel Industry Volume metric tonnes Forecast, by Country 2019 & 2032
- Table 63: Brazil LNG as a Fuel Industry Revenue (Million) Forecast, by Application 2019 & 2032
- Table 64: Brazil LNG as a Fuel Industry Volume (metric tonnes) Forecast, by Application 2019 & 2032
- Table 65: Argentina LNG as a Fuel Industry Revenue (Million) Forecast, by Application 2019 & 2032
- Table 66: Argentina LNG as a Fuel Industry Volume (metric tonnes) Forecast, by Application 2019 & 2032
- Table 67: Peru LNG as a Fuel Industry Revenue (Million) Forecast, by Application 2019 & 2032
- Table 68: Peru LNG as a Fuel Industry Volume (metric tonnes) Forecast, by Application 2019 & 2032
- Table 69: Chile LNG as a Fuel Industry Revenue (Million) Forecast, by Application 2019 & 2032
- Table 70: Chile LNG as a Fuel Industry Volume (metric tonnes) Forecast, by Application 2019 & 2032
- Table 71: Colombia LNG as a Fuel Industry Revenue (Million) Forecast, by Application 2019 & 2032
- Table 72: Colombia LNG as a Fuel Industry Volume (metric tonnes) Forecast, by Application 2019 & 2032
- Table 73: Ecuador LNG as a Fuel Industry Revenue (Million) Forecast, by Application 2019 & 2032
- Table 74: Ecuador LNG as a Fuel Industry Volume (metric tonnes) Forecast, by Application 2019 & 2032
- Table 75: Venezuela LNG as a Fuel Industry Revenue (Million) Forecast, by Application 2019 & 2032
- Table 76: Venezuela LNG as a Fuel Industry Volume (metric tonnes) Forecast, by Application 2019 & 2032
- Table 77: Rest of South America LNG as a Fuel Industry Revenue (Million) Forecast, by Application 2019 & 2032
- Table 78: Rest of South America LNG as a Fuel Industry Volume (metric tonnes) Forecast, by Application 2019 & 2032
- Table 79: Global LNG as a Fuel Industry Revenue Million Forecast, by Country 2019 & 2032
- Table 80: Global LNG as a Fuel Industry Volume metric tonnes Forecast, by Country 2019 & 2032
- Table 81: United States LNG as a Fuel Industry Revenue (Million) Forecast, by Application 2019 & 2032
- Table 82: United States LNG as a Fuel Industry Volume (metric tonnes) Forecast, by Application 2019 & 2032
- Table 83: Canada LNG as a Fuel Industry Revenue (Million) Forecast, by Application 2019 & 2032
- Table 84: Canada LNG as a Fuel Industry Volume (metric tonnes) Forecast, by Application 2019 & 2032
- Table 85: Mexico LNG as a Fuel Industry Revenue (Million) Forecast, by Application 2019 & 2032
- Table 86: Mexico LNG as a Fuel Industry Volume (metric tonnes) Forecast, by Application 2019 & 2032
- Table 87: Global LNG as a Fuel Industry Revenue Million Forecast, by Country 2019 & 2032
- Table 88: Global LNG as a Fuel Industry Volume metric tonnes Forecast, by Country 2019 & 2032
- Table 89: United Arab Emirates LNG as a Fuel Industry Revenue (Million) Forecast, by Application 2019 & 2032
- Table 90: United Arab Emirates LNG as a Fuel Industry Volume (metric tonnes) Forecast, by Application 2019 & 2032
- Table 91: Saudi Arabia LNG as a Fuel Industry Revenue (Million) Forecast, by Application 2019 & 2032
- Table 92: Saudi Arabia LNG as a Fuel Industry Volume (metric tonnes) Forecast, by Application 2019 & 2032
- Table 93: South Africa LNG as a Fuel Industry Revenue (Million) Forecast, by Application 2019 & 2032
- Table 94: South Africa LNG as a Fuel Industry Volume (metric tonnes) Forecast, by Application 2019 & 2032
- Table 95: Rest of Middle East and Africa LNG as a Fuel Industry Revenue (Million) Forecast, by Application 2019 & 2032
- Table 96: Rest of Middle East and Africa LNG as a Fuel Industry Volume (metric tonnes) Forecast, by Application 2019 & 2032
- Table 97: Global LNG as a Fuel Industry Revenue Million Forecast, by Application 2019 & 2032
- Table 98: Global LNG as a Fuel Industry Volume metric tonnes Forecast, by Application 2019 & 2032
- Table 99: Global LNG as a Fuel Industry Revenue Million Forecast, by Country 2019 & 2032
- Table 100: Global LNG as a Fuel Industry Volume metric tonnes Forecast, by Country 2019 & 2032
- Table 101: Global LNG as a Fuel Industry Revenue Million Forecast, by Application 2019 & 2032
- Table 102: Global LNG as a Fuel Industry Volume metric tonnes Forecast, by Application 2019 & 2032
- Table 103: Global LNG as a Fuel Industry Revenue Million Forecast, by Country 2019 & 2032
- Table 104: Global LNG as a Fuel Industry Volume metric tonnes Forecast, by Country 2019 & 2032
- Table 105: Global LNG as a Fuel Industry Revenue Million Forecast, by Application 2019 & 2032
- Table 106: Global LNG as a Fuel Industry Volume metric tonnes Forecast, by Application 2019 & 2032
- Table 107: Global LNG as a Fuel Industry Revenue Million Forecast, by Country 2019 & 2032
- Table 108: Global LNG as a Fuel Industry Volume metric tonnes Forecast, by Country 2019 & 2032
- Table 109: Global LNG as a Fuel Industry Revenue Million Forecast, by Application 2019 & 2032
- Table 110: Global LNG as a Fuel Industry Volume metric tonnes Forecast, by Application 2019 & 2032
- Table 111: Global LNG as a Fuel Industry Revenue Million Forecast, by Country 2019 & 2032
- Table 112: Global LNG as a Fuel Industry Volume metric tonnes Forecast, by Country 2019 & 2032
- Table 113: Global LNG as a Fuel Industry Revenue Million Forecast, by Application 2019 & 2032
- Table 114: Global LNG as a Fuel Industry Volume metric tonnes Forecast, by Application 2019 & 2032
- Table 115: Global LNG as a Fuel Industry Revenue Million Forecast, by Country 2019 & 2032
- Table 116: Global LNG as a Fuel Industry Volume metric tonnes Forecast, by Country 2019 & 2032
Frequently Asked Questions
1. What is the projected Compound Annual Growth Rate (CAGR) of the LNG as a Fuel Industry?
The projected CAGR is approximately > 8.00%.
2. Which companies are prominent players in the LNG as a Fuel Industry?
Key companies in the market include Total SA, Exxon Mobil Corporation, China National Petroleum Corporation, Chevron Corporation, Royal Dutch Shell PLC, Eni SpA*List Not Exhaustive, BP PLC, Conoco Philips.
3. What are the main segments of the LNG as a Fuel Industry?
The market segments include Application.
4. Can you provide details about the market size?
The market size is estimated to be USD XX Million as of 2022.
5. What are some drivers contributing to market growth?
4.; Increasing Demand from Industrial Applications4.; Growing Infrastructure Across the World.
6. What are the notable trends driving market growth?
Transportation Application to Dominate the Market.
7. Are there any restraints impacting market growth?
4.; A Rise In Concerns Related To Carbon Emissions And A Shift Towards Electric Vehicles And Renewable Sources Of Energy.
8. Can you provide examples of recent developments in the market?
N/A
9. What pricing options are available for accessing the report?
Pricing options include single-user, multi-user, and enterprise licenses priced at USD 4750, USD 5250, and USD 8750 respectively.
10. Is the market size provided in terms of value or volume?
The market size is provided in terms of value, measured in Million and volume, measured in metric tonnes.
11. Are there any specific market keywords associated with the report?
Yes, the market keyword associated with the report is "LNG as a Fuel Industry," which aids in identifying and referencing the specific market segment covered.
12. How do I determine which pricing option suits my needs best?
The pricing options vary based on user requirements and access needs. Individual users may opt for single-user licenses, while businesses requiring broader access may choose multi-user or enterprise licenses for cost-effective access to the report.
13. Are there any additional resources or data provided in the LNG as a Fuel Industry report?
While the report offers comprehensive insights, it's advisable to review the specific contents or supplementary materials provided to ascertain if additional resources or data are available.
14. How can I stay updated on further developments or reports in the LNG as a Fuel Industry?
To stay informed about further developments, trends, and reports in the LNG as a Fuel Industry, consider subscribing to industry newsletters, following relevant companies and organizations, or regularly checking reputable industry news sources and publications.
Methodology
Step 1 - Identification of Relevant Samples Size from Population Database


Step 2 - Approaches for Defining Global Market Size (Value, Volume* & Price*)

Note*: In applicable scenarios
Step 3 - Data Sources
Primary Research
- Web Analytics
- Survey Reports
- Research Institute
- Latest Research Reports
- Opinion Leaders
Secondary Research
- Annual Reports
- White Paper
- Latest Press Release
- Industry Association
- Paid Database
- Investor Presentations

Step 4 - Data Triangulation
Involves using different sources of information in order to increase the validity of a study
These sources are likely to be stakeholders in a program - participants, other researchers, program staff, other community members, and so on.
Then we put all data in single framework & apply various statistical tools to find out the dynamic on the market.
During the analysis stage, feedback from the stakeholder groups would be compared to determine areas of agreement as well as areas of divergence
