

Key Insights
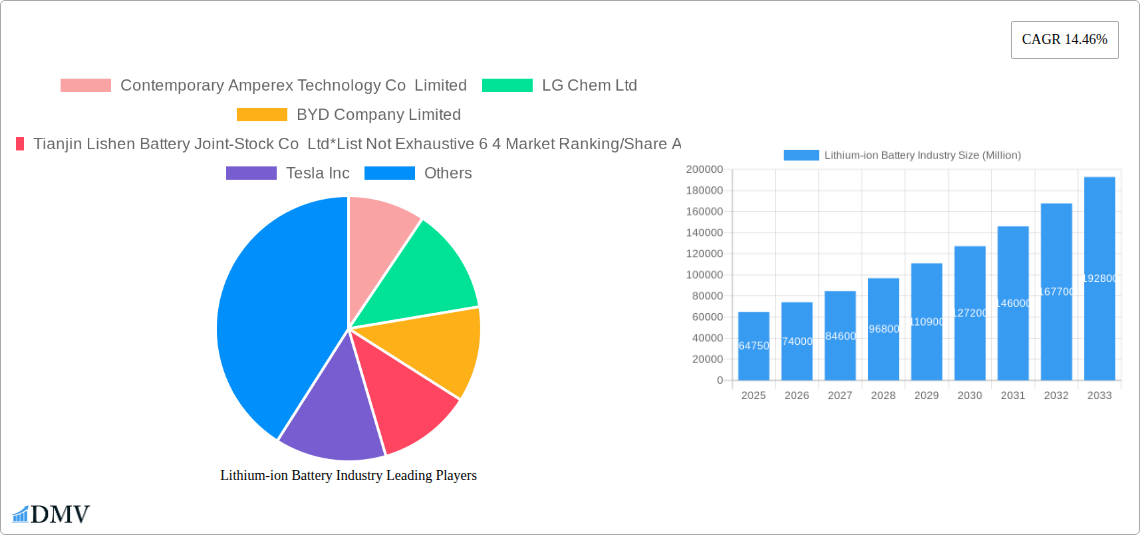
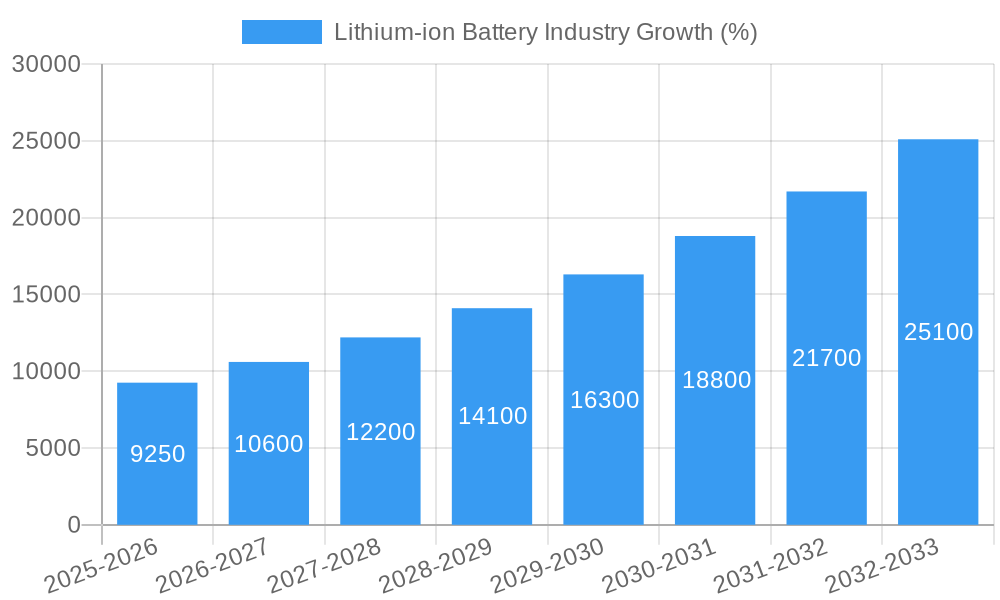
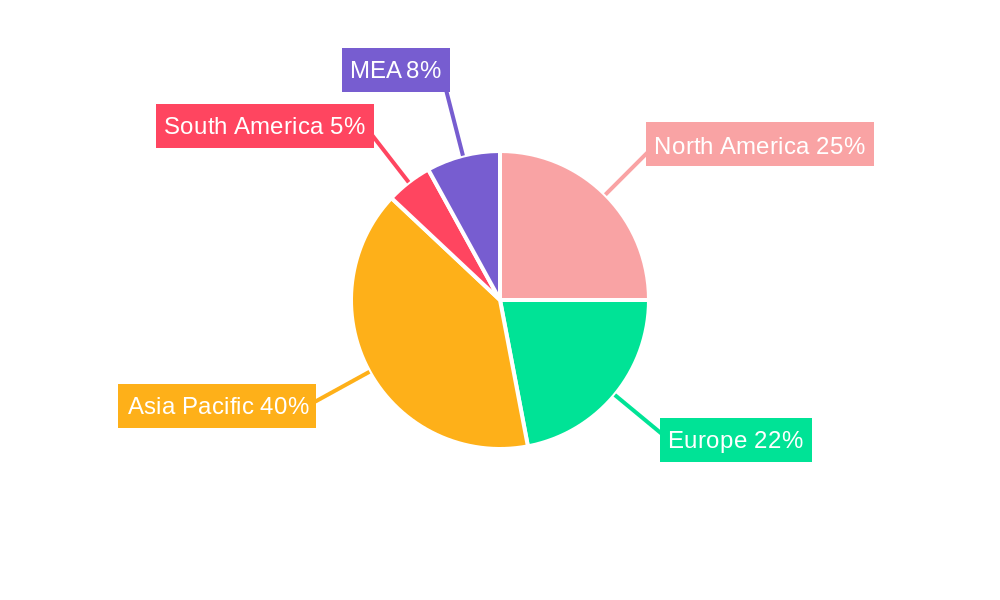
The lithium-ion battery industry is experiencing robust growth, projected to reach a market size of $64.75 billion in 2025 and maintain a Compound Annual Growth Rate (CAGR) of 14.46% from 2025 to 2033. This expansion is driven by the increasing demand for electric vehicles (EVs), renewable energy storage solutions, and portable electronics. The automotive sector is a major driver, fueled by the global shift towards electric mobility and stringent emission regulations. The rise of stationary energy storage, including UPS systems and integration with renewable energy sources like solar and wind power, significantly contributes to market growth. Furthermore, the expanding applications in power tools and medical devices are creating additional market opportunities. Key players like Contemporary Amperex Technology Co Limited (CATL), LG Chem, BYD, and Tesla are leading the innovation and market share competition, investing heavily in research and development to improve battery performance, lifespan, and safety. Geographical distribution shows strong growth across regions, with North America, Europe, and Asia-Pacific emerging as dominant markets. However, challenges remain, including the supply chain vulnerabilities associated with raw material sourcing and the environmental impact of battery production and disposal, requiring continued innovation in sustainable manufacturing processes and recycling technologies.
The forecast period (2025-2033) anticipates a continued surge in demand driven by technological advancements leading to higher energy density, faster charging times, and improved safety features. Government incentives and policies promoting electric mobility and renewable energy adoption globally are expected to further accelerate market expansion. Competitive dynamics will likely intensify with existing players consolidating their position and new entrants emerging, pushing towards innovation and cost reduction to maintain market share. The diversification of applications into emerging sectors, such as grid-scale energy storage and advanced robotics, also presents substantial growth potential for the lithium-ion battery industry. The industry's future trajectory hinges on its ability to address the challenges of sustainability, supply chain resilience, and technological breakthroughs to meet the growing global energy storage needs.
Lithium-ion Battery Industry Market Report: 2019-2033
This comprehensive report provides a detailed analysis of the global lithium-ion battery industry, offering invaluable insights for stakeholders across the value chain. Covering the period 2019-2033, with a base year of 2025, this study forecasts significant market expansion, driven by technological advancements and burgeoning demand across diverse sectors. The report analyzes market dynamics, competitive landscapes, and emerging trends, equipping businesses with crucial data for strategic decision-making. The market is projected to reach xx Million by 2033, representing substantial growth opportunities.
Lithium-ion Battery Industry Market Composition & Trends
This section delves into the intricate structure of the lithium-ion battery market, evaluating market concentration, innovation, regulations, substitutes, end-users, and mergers & acquisitions (M&A). The industry exhibits a moderately concentrated structure, with key players like Contemporary Amperex Technology Co Limited (CATL), LG Chem Ltd, BYD Company Limited, and Tianjin Lishen Battery Joint-Stock Co Ltd holding significant market share. However, the landscape is dynamic, with ongoing M&A activity reshaping the competitive landscape. Deal values in the past five years have totaled an estimated xx Million, reflecting aggressive expansion strategies.
- Market Share Distribution: CATL holds an estimated xx% market share, followed by LG Chem Ltd with xx%, BYD Company Limited with xx%, and Tianjin Lishen Battery Joint-Stock Co Ltd with xx%. The remaining market share is distributed among numerous smaller players.
- Innovation Catalysts: Advancements in battery chemistry, particularly solid-state batteries, are driving significant innovation. The push for higher energy density, faster charging times, and improved safety profiles fuels R&D investment.
- Regulatory Landscape: Government regulations promoting electric vehicles (EVs) and renewable energy storage are key drivers, while environmental concerns about battery disposal and material sourcing are shaping policy.
- Substitute Products: While lithium-ion batteries currently dominate, alternative technologies like flow batteries and solid-oxide fuel cells are emerging, posing potential long-term competitive threats.
- End-User Profiles: Key end-users include the automotive, electronics, and stationary energy storage sectors, each with unique requirements and growth trajectories.
- M&A Activity: The last five years have witnessed a surge in M&A activity, with larger players acquiring smaller companies to expand their technological capabilities and market reach.
Lithium-ion Battery Industry Industry Evolution
The lithium-ion battery industry has undergone a period of rapid evolution. Market growth has been phenomenal, driven primarily by the explosive growth of the electric vehicle (EV) market and the increasing adoption of renewable energy sources. Technological advancements, particularly in battery chemistry and manufacturing processes, have led to significant improvements in energy density, lifespan, and cost-effectiveness. Consumer demand for smaller, lighter, and more powerful batteries for portable electronics continues to be a significant factor. The market witnessed a compound annual growth rate (CAGR) of xx% during the historical period (2019-2024) and is projected to maintain a CAGR of xx% during the forecast period (2025-2033). This growth is fuelled by increasing demand for electric vehicles, along with the deployment of grid-scale energy storage systems powered by renewable energy sources. The adoption rate of lithium-ion batteries in the EV sector has increased from xx% in 2019 to xx% in 2024, showcasing a strong upward trend.
Leading Regions, Countries, or Segments in Lithium-ion Battery Industry
The Asia-Pacific region, particularly China, currently dominates the lithium-ion battery market. This dominance stems from a confluence of factors:
Key Drivers:
- Massive Investments: Significant government investment in EV infrastructure and renewable energy projects.
- Robust Manufacturing Base: A well-established and cost-competitive manufacturing ecosystem.
- Supportive Regulatory Environment: Policies encouraging the adoption of EVs and energy storage solutions.
- Technological Advancements: Significant R&D efforts resulting in innovative battery technologies.
Dominance Factors: China's leading position is attributable to its large-scale production capacity, substantial government support for the industry, and a strong domestic demand driven by the booming EV market. This dominance is further amplified by the presence of key players like CATL and BYD Company Limited. The automotive segment represents the largest application segment, currently accounting for approximately xx% of total market demand. This is followed by the electronic devices segment at xx% and stationary energy storage at xx%.
Lithium-ion Battery Industry Product Innovations
Recent innovations focus on enhancing energy density, improving safety, and reducing costs. Solid-state batteries are a prime example, promising higher energy density and improved safety compared to conventional lithium-ion batteries. Next-generation battery chemistries are also under development, targeting even higher energy densities and faster charging capabilities. These innovations are driven by the increasing demand for longer-range EVs and more efficient energy storage solutions for renewable energy integration.
Propelling Factors for Lithium-ion Battery Industry Growth
Several factors are propelling the growth of the lithium-ion battery industry:
- Technological Advancements: Continuous advancements in battery chemistry, materials science, and manufacturing processes are leading to improved performance, longer lifespan, and reduced costs.
- Government Policies: Government incentives and regulations supporting electric vehicles and renewable energy are driving demand.
- Rising Demand for EVs: The rapid growth of the electric vehicle market is a major driver of battery demand.
- Increased Renewable Energy Adoption: The expanding use of renewable energy sources necessitates efficient energy storage solutions.
Obstacles in the Lithium-ion Battery Industry Market
Despite its strong growth trajectory, the lithium-ion battery industry faces several challenges:
- Supply Chain Disruptions: The reliance on specific raw materials, such as lithium and cobalt, creates vulnerabilities in the supply chain. Price volatility and geopolitical instability can disrupt production.
- Regulatory Hurdles: Stringent environmental regulations related to battery production and disposal create compliance costs.
- Competition: Intense competition among manufacturers puts pressure on profit margins.
Future Opportunities in Lithium-ion Battery Industry
Several opportunities exist for growth in the lithium-ion battery industry:
- New Markets: Emerging markets in developing countries present significant growth potential.
- Technological Advancements: Continued innovation in battery technology will open up new applications.
- Second-Life Applications: Finding sustainable ways to reuse or recycle batteries at the end of their life cycle will create new revenue streams.
Major Players in the Lithium-ion Battery Industry Ecosystem
- Contemporary Amperex Technology Co Limited
- LG Chem Ltd
- BYD Company Limited
- Tianjin Lishen Battery Joint-Stock Co Ltd
- Tesla Inc
- Samsung SDI
- Panasonic Corporation
- Sony Corporation
Key Developments in Lithium-ion Battery Industry Industry
- January 2024: Amara Raja Batteries Ltd announced plans to operate a gigafactory in India by the end of 2025, with a capacity of up to 16 GWh for lithium cells and 5 GWh for battery packs. This signifies a significant investment in the Indian battery market and will likely increase domestic production capacity.
- August 2023: Reliance Industries Limited announced plans to establish a lithium-ion battery gigafactory in India by 2026, aiming to produce battery chemicals, cells, packs, and containerized energy storage solutions. This project represents a large-scale commitment to developing the Indian battery supply chain and will have a major impact on the country's energy landscape.
Strategic Lithium-ion Battery Industry Market Forecast
The lithium-ion battery industry is poised for continued robust growth, driven by the increasing adoption of electric vehicles, renewable energy storage, and portable electronics. The market is expected to experience substantial expansion over the forecast period, with significant opportunities for innovation and market expansion. New technologies, such as solid-state batteries, will further enhance performance and drive market growth. The increasing focus on sustainability and circular economy models will also play a vital role in shaping future industry trends.
Lithium-ion Battery Industry Segmentation
-
1. Application
- 1.1. Electronic Devices
- 1.2. Automobile
- 1.3. Stationa
- 1.4. Other Ap
Lithium-ion Battery Industry Segmentation By Geography
-
1. North America
- 1.1. United States
- 1.2. Canada
- 1.3. Rest of the North America
-
2. Europe
- 2.1. Spain
- 2.2. Nordic
- 2.3. United Kingdom
- 2.4. Russia
- 2.5. Turkey
- 2.6. Germany
- 2.7. Italy
- 2.8. Rest of the Europe
-
3. Asia Pacific
- 3.1. China
- 3.2. India
- 3.3. Japan
- 3.4. Malaysia
- 3.5. Thailand
- 3.6. Indonesia
- 3.7. Vietnam
- 3.8. Rest of Asia Pacific
-
4. South America
- 4.1. Brazil
- 4.2. Argentina
- 4.3. Colmbia
- 4.4. Rest of South America
-
5. Middle East and Africa
- 5.1. United Arab Emirates
- 5.2. Saudi Arabia
- 5.3. South Africa
- 5.4. Nigeria
- 5.5. Qatar
- 5.6. Egypt
- 5.7. Rest of the Middle East and Africa
Lithium-ion Battery Industry REPORT HIGHLIGHTS
| Aspects | Details |
|---|---|
| Study Period | 2019-2033 |
| Base Year | 2024 |
| Estimated Year | 2025 |
| Forecast Period | 2025-2033 |
| Historical Period | 2019-2024 |
| Growth Rate | CAGR of 14.46% from 2019-2033 |
| Segmentation |
|
Table of Contents
- 1. Introduction
- 1.1. Research Scope
- 1.2. Market Segmentation
- 1.3. Research Methodology
- 1.4. Definitions and Assumptions
- 2. Executive Summary
- 2.1. Introduction
- 3. Market Dynamics
- 3.1. Introduction
- 3.2. Market Drivers
- 3.2.1. 4.; Supportive Government Initiatives And Policies To Adopt Renewable Energy4.; Declining Cost Of Lithium-ion Batteries
- 3.3. Market Restrains
- 3.3.1. 4.; Demand-Supply Mismatch of Raw Materials
- 3.4. Market Trends
- 3.4.1. The Automobile Segment Expected to Dominate the Market
- 4. Market Factor Analysis
- 4.1. Porters Five Forces
- 4.2. Supply/Value Chain
- 4.3. PESTEL analysis
- 4.4. Market Entropy
- 4.5. Patent/Trademark Analysis
- 5. Global Lithium-ion Battery Industry Analysis, Insights and Forecast, 2019-2031
- 5.1. Market Analysis, Insights and Forecast - by Application
- 5.1.1. Electronic Devices
- 5.1.2. Automobile
- 5.1.3. Stationa
- 5.1.4. Other Ap
- 5.2. Market Analysis, Insights and Forecast - by Region
- 5.2.1. North America
- 5.2.2. Europe
- 5.2.3. Asia Pacific
- 5.2.4. South America
- 5.2.5. Middle East and Africa
- 5.1. Market Analysis, Insights and Forecast - by Application
- 6. North America Lithium-ion Battery Industry Analysis, Insights and Forecast, 2019-2031
- 6.1. Market Analysis, Insights and Forecast - by Application
- 6.1.1. Electronic Devices
- 6.1.2. Automobile
- 6.1.3. Stationa
- 6.1.4. Other Ap
- 6.1. Market Analysis, Insights and Forecast - by Application
- 7. Europe Lithium-ion Battery Industry Analysis, Insights and Forecast, 2019-2031
- 7.1. Market Analysis, Insights and Forecast - by Application
- 7.1.1. Electronic Devices
- 7.1.2. Automobile
- 7.1.3. Stationa
- 7.1.4. Other Ap
- 7.1. Market Analysis, Insights and Forecast - by Application
- 8. Asia Pacific Lithium-ion Battery Industry Analysis, Insights and Forecast, 2019-2031
- 8.1. Market Analysis, Insights and Forecast - by Application
- 8.1.1. Electronic Devices
- 8.1.2. Automobile
- 8.1.3. Stationa
- 8.1.4. Other Ap
- 8.1. Market Analysis, Insights and Forecast - by Application
- 9. South America Lithium-ion Battery Industry Analysis, Insights and Forecast, 2019-2031
- 9.1. Market Analysis, Insights and Forecast - by Application
- 9.1.1. Electronic Devices
- 9.1.2. Automobile
- 9.1.3. Stationa
- 9.1.4. Other Ap
- 9.1. Market Analysis, Insights and Forecast - by Application
- 10. Middle East and Africa Lithium-ion Battery Industry Analysis, Insights and Forecast, 2019-2031
- 10.1. Market Analysis, Insights and Forecast - by Application
- 10.1.1. Electronic Devices
- 10.1.2. Automobile
- 10.1.3. Stationa
- 10.1.4. Other Ap
- 10.1. Market Analysis, Insights and Forecast - by Application
- 11. North America Lithium-ion Battery Industry Analysis, Insights and Forecast, 2019-2031
- 11.1. Market Analysis, Insights and Forecast - By Country/Sub-region
- 11.1.1 United States
- 11.1.2 Canada
- 11.1.3 Mexico
- 12. Europe Lithium-ion Battery Industry Analysis, Insights and Forecast, 2019-2031
- 12.1. Market Analysis, Insights and Forecast - By Country/Sub-region
- 12.1.1 Germany
- 12.1.2 United Kingdom
- 12.1.3 France
- 12.1.4 Spain
- 12.1.5 Italy
- 12.1.6 Spain
- 12.1.7 Belgium
- 12.1.8 Netherland
- 12.1.9 Nordics
- 12.1.10 Rest of Europe
- 13. Asia Pacific Lithium-ion Battery Industry Analysis, Insights and Forecast, 2019-2031
- 13.1. Market Analysis, Insights and Forecast - By Country/Sub-region
- 13.1.1 China
- 13.1.2 Japan
- 13.1.3 India
- 13.1.4 South Korea
- 13.1.5 Southeast Asia
- 13.1.6 Australia
- 13.1.7 Indonesia
- 13.1.8 Phillipes
- 13.1.9 Singapore
- 13.1.10 Thailandc
- 13.1.11 Rest of Asia Pacific
- 14. South America Lithium-ion Battery Industry Analysis, Insights and Forecast, 2019-2031
- 14.1. Market Analysis, Insights and Forecast - By Country/Sub-region
- 14.1.1 Brazil
- 14.1.2 Argentina
- 14.1.3 Peru
- 14.1.4 Chile
- 14.1.5 Colombia
- 14.1.6 Ecuador
- 14.1.7 Venezuela
- 14.1.8 Rest of South America
- 15. North America Lithium-ion Battery Industry Analysis, Insights and Forecast, 2019-2031
- 15.1. Market Analysis, Insights and Forecast - By Country/Sub-region
- 15.1.1 United States
- 15.1.2 Canada
- 15.1.3 Mexico
- 16. MEA Lithium-ion Battery Industry Analysis, Insights and Forecast, 2019-2031
- 16.1. Market Analysis, Insights and Forecast - By Country/Sub-region
- 16.1.1 United Arab Emirates
- 16.1.2 Saudi Arabia
- 16.1.3 South Africa
- 16.1.4 Rest of Middle East and Africa
- 17. Competitive Analysis
- 17.1. Global Market Share Analysis 2024
- 17.2. Company Profiles
- 17.2.1 Contemporary Amperex Technology Co Limited
- 17.2.1.1. Overview
- 17.2.1.2. Products
- 17.2.1.3. SWOT Analysis
- 17.2.1.4. Recent Developments
- 17.2.1.5. Financials (Based on Availability)
- 17.2.2 LG Chem Ltd
- 17.2.2.1. Overview
- 17.2.2.2. Products
- 17.2.2.3. SWOT Analysis
- 17.2.2.4. Recent Developments
- 17.2.2.5. Financials (Based on Availability)
- 17.2.3 BYD Company Limited
- 17.2.3.1. Overview
- 17.2.3.2. Products
- 17.2.3.3. SWOT Analysis
- 17.2.3.4. Recent Developments
- 17.2.3.5. Financials (Based on Availability)
- 17.2.4 Tianjin Lishen Battery Joint-Stock Co Ltd*List Not Exhaustive 6 4 Market Ranking/Share Analysi
- 17.2.4.1. Overview
- 17.2.4.2. Products
- 17.2.4.3. SWOT Analysis
- 17.2.4.4. Recent Developments
- 17.2.4.5. Financials (Based on Availability)
- 17.2.5 Tesla Inc
- 17.2.5.1. Overview
- 17.2.5.2. Products
- 17.2.5.3. SWOT Analysis
- 17.2.5.4. Recent Developments
- 17.2.5.5. Financials (Based on Availability)
- 17.2.6 Samsung SDI
- 17.2.6.1. Overview
- 17.2.6.2. Products
- 17.2.6.3. SWOT Analysis
- 17.2.6.4. Recent Developments
- 17.2.6.5. Financials (Based on Availability)
- 17.2.7 Panasonic Corporation
- 17.2.7.1. Overview
- 17.2.7.2. Products
- 17.2.7.3. SWOT Analysis
- 17.2.7.4. Recent Developments
- 17.2.7.5. Financials (Based on Availability)
- 17.2.8 Sony Corporation
- 17.2.8.1. Overview
- 17.2.8.2. Products
- 17.2.8.3. SWOT Analysis
- 17.2.8.4. Recent Developments
- 17.2.8.5. Financials (Based on Availability)
- 17.2.1 Contemporary Amperex Technology Co Limited
List of Figures
- Figure 1: Global Lithium-ion Battery Industry Revenue Breakdown (Million, %) by Region 2024 & 2032
- Figure 2: Global Lithium-ion Battery Industry Volume Breakdown (K Units, %) by Region 2024 & 2032
- Figure 3: North America Lithium-ion Battery Industry Revenue (Million), by Country 2024 & 2032
- Figure 4: North America Lithium-ion Battery Industry Volume (K Units), by Country 2024 & 2032
- Figure 5: North America Lithium-ion Battery Industry Revenue Share (%), by Country 2024 & 2032
- Figure 6: North America Lithium-ion Battery Industry Volume Share (%), by Country 2024 & 2032
- Figure 7: Europe Lithium-ion Battery Industry Revenue (Million), by Country 2024 & 2032
- Figure 8: Europe Lithium-ion Battery Industry Volume (K Units), by Country 2024 & 2032
- Figure 9: Europe Lithium-ion Battery Industry Revenue Share (%), by Country 2024 & 2032
- Figure 10: Europe Lithium-ion Battery Industry Volume Share (%), by Country 2024 & 2032
- Figure 11: Asia Pacific Lithium-ion Battery Industry Revenue (Million), by Country 2024 & 2032
- Figure 12: Asia Pacific Lithium-ion Battery Industry Volume (K Units), by Country 2024 & 2032
- Figure 13: Asia Pacific Lithium-ion Battery Industry Revenue Share (%), by Country 2024 & 2032
- Figure 14: Asia Pacific Lithium-ion Battery Industry Volume Share (%), by Country 2024 & 2032
- Figure 15: South America Lithium-ion Battery Industry Revenue (Million), by Country 2024 & 2032
- Figure 16: South America Lithium-ion Battery Industry Volume (K Units), by Country 2024 & 2032
- Figure 17: South America Lithium-ion Battery Industry Revenue Share (%), by Country 2024 & 2032
- Figure 18: South America Lithium-ion Battery Industry Volume Share (%), by Country 2024 & 2032
- Figure 19: North America Lithium-ion Battery Industry Revenue (Million), by Country 2024 & 2032
- Figure 20: North America Lithium-ion Battery Industry Volume (K Units), by Country 2024 & 2032
- Figure 21: North America Lithium-ion Battery Industry Revenue Share (%), by Country 2024 & 2032
- Figure 22: North America Lithium-ion Battery Industry Volume Share (%), by Country 2024 & 2032
- Figure 23: MEA Lithium-ion Battery Industry Revenue (Million), by Country 2024 & 2032
- Figure 24: MEA Lithium-ion Battery Industry Volume (K Units), by Country 2024 & 2032
- Figure 25: MEA Lithium-ion Battery Industry Revenue Share (%), by Country 2024 & 2032
- Figure 26: MEA Lithium-ion Battery Industry Volume Share (%), by Country 2024 & 2032
- Figure 27: North America Lithium-ion Battery Industry Revenue (Million), by Application 2024 & 2032
- Figure 28: North America Lithium-ion Battery Industry Volume (K Units), by Application 2024 & 2032
- Figure 29: North America Lithium-ion Battery Industry Revenue Share (%), by Application 2024 & 2032
- Figure 30: North America Lithium-ion Battery Industry Volume Share (%), by Application 2024 & 2032
- Figure 31: North America Lithium-ion Battery Industry Revenue (Million), by Country 2024 & 2032
- Figure 32: North America Lithium-ion Battery Industry Volume (K Units), by Country 2024 & 2032
- Figure 33: North America Lithium-ion Battery Industry Revenue Share (%), by Country 2024 & 2032
- Figure 34: North America Lithium-ion Battery Industry Volume Share (%), by Country 2024 & 2032
- Figure 35: Europe Lithium-ion Battery Industry Revenue (Million), by Application 2024 & 2032
- Figure 36: Europe Lithium-ion Battery Industry Volume (K Units), by Application 2024 & 2032
- Figure 37: Europe Lithium-ion Battery Industry Revenue Share (%), by Application 2024 & 2032
- Figure 38: Europe Lithium-ion Battery Industry Volume Share (%), by Application 2024 & 2032
- Figure 39: Europe Lithium-ion Battery Industry Revenue (Million), by Country 2024 & 2032
- Figure 40: Europe Lithium-ion Battery Industry Volume (K Units), by Country 2024 & 2032
- Figure 41: Europe Lithium-ion Battery Industry Revenue Share (%), by Country 2024 & 2032
- Figure 42: Europe Lithium-ion Battery Industry Volume Share (%), by Country 2024 & 2032
- Figure 43: Asia Pacific Lithium-ion Battery Industry Revenue (Million), by Application 2024 & 2032
- Figure 44: Asia Pacific Lithium-ion Battery Industry Volume (K Units), by Application 2024 & 2032
- Figure 45: Asia Pacific Lithium-ion Battery Industry Revenue Share (%), by Application 2024 & 2032
- Figure 46: Asia Pacific Lithium-ion Battery Industry Volume Share (%), by Application 2024 & 2032
- Figure 47: Asia Pacific Lithium-ion Battery Industry Revenue (Million), by Country 2024 & 2032
- Figure 48: Asia Pacific Lithium-ion Battery Industry Volume (K Units), by Country 2024 & 2032
- Figure 49: Asia Pacific Lithium-ion Battery Industry Revenue Share (%), by Country 2024 & 2032
- Figure 50: Asia Pacific Lithium-ion Battery Industry Volume Share (%), by Country 2024 & 2032
- Figure 51: South America Lithium-ion Battery Industry Revenue (Million), by Application 2024 & 2032
- Figure 52: South America Lithium-ion Battery Industry Volume (K Units), by Application 2024 & 2032
- Figure 53: South America Lithium-ion Battery Industry Revenue Share (%), by Application 2024 & 2032
- Figure 54: South America Lithium-ion Battery Industry Volume Share (%), by Application 2024 & 2032
- Figure 55: South America Lithium-ion Battery Industry Revenue (Million), by Country 2024 & 2032
- Figure 56: South America Lithium-ion Battery Industry Volume (K Units), by Country 2024 & 2032
- Figure 57: South America Lithium-ion Battery Industry Revenue Share (%), by Country 2024 & 2032
- Figure 58: South America Lithium-ion Battery Industry Volume Share (%), by Country 2024 & 2032
- Figure 59: Middle East and Africa Lithium-ion Battery Industry Revenue (Million), by Application 2024 & 2032
- Figure 60: Middle East and Africa Lithium-ion Battery Industry Volume (K Units), by Application 2024 & 2032
- Figure 61: Middle East and Africa Lithium-ion Battery Industry Revenue Share (%), by Application 2024 & 2032
- Figure 62: Middle East and Africa Lithium-ion Battery Industry Volume Share (%), by Application 2024 & 2032
- Figure 63: Middle East and Africa Lithium-ion Battery Industry Revenue (Million), by Country 2024 & 2032
- Figure 64: Middle East and Africa Lithium-ion Battery Industry Volume (K Units), by Country 2024 & 2032
- Figure 65: Middle East and Africa Lithium-ion Battery Industry Revenue Share (%), by Country 2024 & 2032
- Figure 66: Middle East and Africa Lithium-ion Battery Industry Volume Share (%), by Country 2024 & 2032
List of Tables
- Table 1: Global Lithium-ion Battery Industry Revenue Million Forecast, by Region 2019 & 2032
- Table 2: Global Lithium-ion Battery Industry Volume K Units Forecast, by Region 2019 & 2032
- Table 3: Global Lithium-ion Battery Industry Revenue Million Forecast, by Application 2019 & 2032
- Table 4: Global Lithium-ion Battery Industry Volume K Units Forecast, by Application 2019 & 2032
- Table 5: Global Lithium-ion Battery Industry Revenue Million Forecast, by Region 2019 & 2032
- Table 6: Global Lithium-ion Battery Industry Volume K Units Forecast, by Region 2019 & 2032
- Table 7: Global Lithium-ion Battery Industry Revenue Million Forecast, by Country 2019 & 2032
- Table 8: Global Lithium-ion Battery Industry Volume K Units Forecast, by Country 2019 & 2032
- Table 9: United States Lithium-ion Battery Industry Revenue (Million) Forecast, by Application 2019 & 2032
- Table 10: United States Lithium-ion Battery Industry Volume (K Units) Forecast, by Application 2019 & 2032
- Table 11: Canada Lithium-ion Battery Industry Revenue (Million) Forecast, by Application 2019 & 2032
- Table 12: Canada Lithium-ion Battery Industry Volume (K Units) Forecast, by Application 2019 & 2032
- Table 13: Mexico Lithium-ion Battery Industry Revenue (Million) Forecast, by Application 2019 & 2032
- Table 14: Mexico Lithium-ion Battery Industry Volume (K Units) Forecast, by Application 2019 & 2032
- Table 15: Global Lithium-ion Battery Industry Revenue Million Forecast, by Country 2019 & 2032
- Table 16: Global Lithium-ion Battery Industry Volume K Units Forecast, by Country 2019 & 2032
- Table 17: Germany Lithium-ion Battery Industry Revenue (Million) Forecast, by Application 2019 & 2032
- Table 18: Germany Lithium-ion Battery Industry Volume (K Units) Forecast, by Application 2019 & 2032
- Table 19: United Kingdom Lithium-ion Battery Industry Revenue (Million) Forecast, by Application 2019 & 2032
- Table 20: United Kingdom Lithium-ion Battery Industry Volume (K Units) Forecast, by Application 2019 & 2032
- Table 21: France Lithium-ion Battery Industry Revenue (Million) Forecast, by Application 2019 & 2032
- Table 22: France Lithium-ion Battery Industry Volume (K Units) Forecast, by Application 2019 & 2032
- Table 23: Spain Lithium-ion Battery Industry Revenue (Million) Forecast, by Application 2019 & 2032
- Table 24: Spain Lithium-ion Battery Industry Volume (K Units) Forecast, by Application 2019 & 2032
- Table 25: Italy Lithium-ion Battery Industry Revenue (Million) Forecast, by Application 2019 & 2032
- Table 26: Italy Lithium-ion Battery Industry Volume (K Units) Forecast, by Application 2019 & 2032
- Table 27: Spain Lithium-ion Battery Industry Revenue (Million) Forecast, by Application 2019 & 2032
- Table 28: Spain Lithium-ion Battery Industry Volume (K Units) Forecast, by Application 2019 & 2032
- Table 29: Belgium Lithium-ion Battery Industry Revenue (Million) Forecast, by Application 2019 & 2032
- Table 30: Belgium Lithium-ion Battery Industry Volume (K Units) Forecast, by Application 2019 & 2032
- Table 31: Netherland Lithium-ion Battery Industry Revenue (Million) Forecast, by Application 2019 & 2032
- Table 32: Netherland Lithium-ion Battery Industry Volume (K Units) Forecast, by Application 2019 & 2032
- Table 33: Nordics Lithium-ion Battery Industry Revenue (Million) Forecast, by Application 2019 & 2032
- Table 34: Nordics Lithium-ion Battery Industry Volume (K Units) Forecast, by Application 2019 & 2032
- Table 35: Rest of Europe Lithium-ion Battery Industry Revenue (Million) Forecast, by Application 2019 & 2032
- Table 36: Rest of Europe Lithium-ion Battery Industry Volume (K Units) Forecast, by Application 2019 & 2032
- Table 37: Global Lithium-ion Battery Industry Revenue Million Forecast, by Country 2019 & 2032
- Table 38: Global Lithium-ion Battery Industry Volume K Units Forecast, by Country 2019 & 2032
- Table 39: China Lithium-ion Battery Industry Revenue (Million) Forecast, by Application 2019 & 2032
- Table 40: China Lithium-ion Battery Industry Volume (K Units) Forecast, by Application 2019 & 2032
- Table 41: Japan Lithium-ion Battery Industry Revenue (Million) Forecast, by Application 2019 & 2032
- Table 42: Japan Lithium-ion Battery Industry Volume (K Units) Forecast, by Application 2019 & 2032
- Table 43: India Lithium-ion Battery Industry Revenue (Million) Forecast, by Application 2019 & 2032
- Table 44: India Lithium-ion Battery Industry Volume (K Units) Forecast, by Application 2019 & 2032
- Table 45: South Korea Lithium-ion Battery Industry Revenue (Million) Forecast, by Application 2019 & 2032
- Table 46: South Korea Lithium-ion Battery Industry Volume (K Units) Forecast, by Application 2019 & 2032
- Table 47: Southeast Asia Lithium-ion Battery Industry Revenue (Million) Forecast, by Application 2019 & 2032
- Table 48: Southeast Asia Lithium-ion Battery Industry Volume (K Units) Forecast, by Application 2019 & 2032
- Table 49: Australia Lithium-ion Battery Industry Revenue (Million) Forecast, by Application 2019 & 2032
- Table 50: Australia Lithium-ion Battery Industry Volume (K Units) Forecast, by Application 2019 & 2032
- Table 51: Indonesia Lithium-ion Battery Industry Revenue (Million) Forecast, by Application 2019 & 2032
- Table 52: Indonesia Lithium-ion Battery Industry Volume (K Units) Forecast, by Application 2019 & 2032
- Table 53: Phillipes Lithium-ion Battery Industry Revenue (Million) Forecast, by Application 2019 & 2032
- Table 54: Phillipes Lithium-ion Battery Industry Volume (K Units) Forecast, by Application 2019 & 2032
- Table 55: Singapore Lithium-ion Battery Industry Revenue (Million) Forecast, by Application 2019 & 2032
- Table 56: Singapore Lithium-ion Battery Industry Volume (K Units) Forecast, by Application 2019 & 2032
- Table 57: Thailandc Lithium-ion Battery Industry Revenue (Million) Forecast, by Application 2019 & 2032
- Table 58: Thailandc Lithium-ion Battery Industry Volume (K Units) Forecast, by Application 2019 & 2032
- Table 59: Rest of Asia Pacific Lithium-ion Battery Industry Revenue (Million) Forecast, by Application 2019 & 2032
- Table 60: Rest of Asia Pacific Lithium-ion Battery Industry Volume (K Units) Forecast, by Application 2019 & 2032
- Table 61: Global Lithium-ion Battery Industry Revenue Million Forecast, by Country 2019 & 2032
- Table 62: Global Lithium-ion Battery Industry Volume K Units Forecast, by Country 2019 & 2032
- Table 63: Brazil Lithium-ion Battery Industry Revenue (Million) Forecast, by Application 2019 & 2032
- Table 64: Brazil Lithium-ion Battery Industry Volume (K Units) Forecast, by Application 2019 & 2032
- Table 65: Argentina Lithium-ion Battery Industry Revenue (Million) Forecast, by Application 2019 & 2032
- Table 66: Argentina Lithium-ion Battery Industry Volume (K Units) Forecast, by Application 2019 & 2032
- Table 67: Peru Lithium-ion Battery Industry Revenue (Million) Forecast, by Application 2019 & 2032
- Table 68: Peru Lithium-ion Battery Industry Volume (K Units) Forecast, by Application 2019 & 2032
- Table 69: Chile Lithium-ion Battery Industry Revenue (Million) Forecast, by Application 2019 & 2032
- Table 70: Chile Lithium-ion Battery Industry Volume (K Units) Forecast, by Application 2019 & 2032
- Table 71: Colombia Lithium-ion Battery Industry Revenue (Million) Forecast, by Application 2019 & 2032
- Table 72: Colombia Lithium-ion Battery Industry Volume (K Units) Forecast, by Application 2019 & 2032
- Table 73: Ecuador Lithium-ion Battery Industry Revenue (Million) Forecast, by Application 2019 & 2032
- Table 74: Ecuador Lithium-ion Battery Industry Volume (K Units) Forecast, by Application 2019 & 2032
- Table 75: Venezuela Lithium-ion Battery Industry Revenue (Million) Forecast, by Application 2019 & 2032
- Table 76: Venezuela Lithium-ion Battery Industry Volume (K Units) Forecast, by Application 2019 & 2032
- Table 77: Rest of South America Lithium-ion Battery Industry Revenue (Million) Forecast, by Application 2019 & 2032
- Table 78: Rest of South America Lithium-ion Battery Industry Volume (K Units) Forecast, by Application 2019 & 2032
- Table 79: Global Lithium-ion Battery Industry Revenue Million Forecast, by Country 2019 & 2032
- Table 80: Global Lithium-ion Battery Industry Volume K Units Forecast, by Country 2019 & 2032
- Table 81: United States Lithium-ion Battery Industry Revenue (Million) Forecast, by Application 2019 & 2032
- Table 82: United States Lithium-ion Battery Industry Volume (K Units) Forecast, by Application 2019 & 2032
- Table 83: Canada Lithium-ion Battery Industry Revenue (Million) Forecast, by Application 2019 & 2032
- Table 84: Canada Lithium-ion Battery Industry Volume (K Units) Forecast, by Application 2019 & 2032
- Table 85: Mexico Lithium-ion Battery Industry Revenue (Million) Forecast, by Application 2019 & 2032
- Table 86: Mexico Lithium-ion Battery Industry Volume (K Units) Forecast, by Application 2019 & 2032
- Table 87: Global Lithium-ion Battery Industry Revenue Million Forecast, by Country 2019 & 2032
- Table 88: Global Lithium-ion Battery Industry Volume K Units Forecast, by Country 2019 & 2032
- Table 89: United Arab Emirates Lithium-ion Battery Industry Revenue (Million) Forecast, by Application 2019 & 2032
- Table 90: United Arab Emirates Lithium-ion Battery Industry Volume (K Units) Forecast, by Application 2019 & 2032
- Table 91: Saudi Arabia Lithium-ion Battery Industry Revenue (Million) Forecast, by Application 2019 & 2032
- Table 92: Saudi Arabia Lithium-ion Battery Industry Volume (K Units) Forecast, by Application 2019 & 2032
- Table 93: South Africa Lithium-ion Battery Industry Revenue (Million) Forecast, by Application 2019 & 2032
- Table 94: South Africa Lithium-ion Battery Industry Volume (K Units) Forecast, by Application 2019 & 2032
- Table 95: Rest of Middle East and Africa Lithium-ion Battery Industry Revenue (Million) Forecast, by Application 2019 & 2032
- Table 96: Rest of Middle East and Africa Lithium-ion Battery Industry Volume (K Units) Forecast, by Application 2019 & 2032
- Table 97: Global Lithium-ion Battery Industry Revenue Million Forecast, by Application 2019 & 2032
- Table 98: Global Lithium-ion Battery Industry Volume K Units Forecast, by Application 2019 & 2032
- Table 99: Global Lithium-ion Battery Industry Revenue Million Forecast, by Country 2019 & 2032
- Table 100: Global Lithium-ion Battery Industry Volume K Units Forecast, by Country 2019 & 2032
- Table 101: United States Lithium-ion Battery Industry Revenue (Million) Forecast, by Application 2019 & 2032
- Table 102: United States Lithium-ion Battery Industry Volume (K Units) Forecast, by Application 2019 & 2032
- Table 103: Canada Lithium-ion Battery Industry Revenue (Million) Forecast, by Application 2019 & 2032
- Table 104: Canada Lithium-ion Battery Industry Volume (K Units) Forecast, by Application 2019 & 2032
- Table 105: Rest of the North America Lithium-ion Battery Industry Revenue (Million) Forecast, by Application 2019 & 2032
- Table 106: Rest of the North America Lithium-ion Battery Industry Volume (K Units) Forecast, by Application 2019 & 2032
- Table 107: Global Lithium-ion Battery Industry Revenue Million Forecast, by Application 2019 & 2032
- Table 108: Global Lithium-ion Battery Industry Volume K Units Forecast, by Application 2019 & 2032
- Table 109: Global Lithium-ion Battery Industry Revenue Million Forecast, by Country 2019 & 2032
- Table 110: Global Lithium-ion Battery Industry Volume K Units Forecast, by Country 2019 & 2032
- Table 111: Spain Lithium-ion Battery Industry Revenue (Million) Forecast, by Application 2019 & 2032
- Table 112: Spain Lithium-ion Battery Industry Volume (K Units) Forecast, by Application 2019 & 2032
- Table 113: Nordic Lithium-ion Battery Industry Revenue (Million) Forecast, by Application 2019 & 2032
- Table 114: Nordic Lithium-ion Battery Industry Volume (K Units) Forecast, by Application 2019 & 2032
- Table 115: United Kingdom Lithium-ion Battery Industry Revenue (Million) Forecast, by Application 2019 & 2032
- Table 116: United Kingdom Lithium-ion Battery Industry Volume (K Units) Forecast, by Application 2019 & 2032
- Table 117: Russia Lithium-ion Battery Industry Revenue (Million) Forecast, by Application 2019 & 2032
- Table 118: Russia Lithium-ion Battery Industry Volume (K Units) Forecast, by Application 2019 & 2032
- Table 119: Turkey Lithium-ion Battery Industry Revenue (Million) Forecast, by Application 2019 & 2032
- Table 120: Turkey Lithium-ion Battery Industry Volume (K Units) Forecast, by Application 2019 & 2032
- Table 121: Germany Lithium-ion Battery Industry Revenue (Million) Forecast, by Application 2019 & 2032
- Table 122: Germany Lithium-ion Battery Industry Volume (K Units) Forecast, by Application 2019 & 2032
- Table 123: Italy Lithium-ion Battery Industry Revenue (Million) Forecast, by Application 2019 & 2032
- Table 124: Italy Lithium-ion Battery Industry Volume (K Units) Forecast, by Application 2019 & 2032
- Table 125: Rest of the Europe Lithium-ion Battery Industry Revenue (Million) Forecast, by Application 2019 & 2032
- Table 126: Rest of the Europe Lithium-ion Battery Industry Volume (K Units) Forecast, by Application 2019 & 2032
- Table 127: Global Lithium-ion Battery Industry Revenue Million Forecast, by Application 2019 & 2032
- Table 128: Global Lithium-ion Battery Industry Volume K Units Forecast, by Application 2019 & 2032
- Table 129: Global Lithium-ion Battery Industry Revenue Million Forecast, by Country 2019 & 2032
- Table 130: Global Lithium-ion Battery Industry Volume K Units Forecast, by Country 2019 & 2032
- Table 131: China Lithium-ion Battery Industry Revenue (Million) Forecast, by Application 2019 & 2032
- Table 132: China Lithium-ion Battery Industry Volume (K Units) Forecast, by Application 2019 & 2032
- Table 133: India Lithium-ion Battery Industry Revenue (Million) Forecast, by Application 2019 & 2032
- Table 134: India Lithium-ion Battery Industry Volume (K Units) Forecast, by Application 2019 & 2032
- Table 135: Japan Lithium-ion Battery Industry Revenue (Million) Forecast, by Application 2019 & 2032
- Table 136: Japan Lithium-ion Battery Industry Volume (K Units) Forecast, by Application 2019 & 2032
- Table 137: Malaysia Lithium-ion Battery Industry Revenue (Million) Forecast, by Application 2019 & 2032
- Table 138: Malaysia Lithium-ion Battery Industry Volume (K Units) Forecast, by Application 2019 & 2032
- Table 139: Thailand Lithium-ion Battery Industry Revenue (Million) Forecast, by Application 2019 & 2032
- Table 140: Thailand Lithium-ion Battery Industry Volume (K Units) Forecast, by Application 2019 & 2032
- Table 141: Indonesia Lithium-ion Battery Industry Revenue (Million) Forecast, by Application 2019 & 2032
- Table 142: Indonesia Lithium-ion Battery Industry Volume (K Units) Forecast, by Application 2019 & 2032
- Table 143: Vietnam Lithium-ion Battery Industry Revenue (Million) Forecast, by Application 2019 & 2032
- Table 144: Vietnam Lithium-ion Battery Industry Volume (K Units) Forecast, by Application 2019 & 2032
- Table 145: Rest of Asia Pacific Lithium-ion Battery Industry Revenue (Million) Forecast, by Application 2019 & 2032
- Table 146: Rest of Asia Pacific Lithium-ion Battery Industry Volume (K Units) Forecast, by Application 2019 & 2032
- Table 147: Global Lithium-ion Battery Industry Revenue Million Forecast, by Application 2019 & 2032
- Table 148: Global Lithium-ion Battery Industry Volume K Units Forecast, by Application 2019 & 2032
- Table 149: Global Lithium-ion Battery Industry Revenue Million Forecast, by Country 2019 & 2032
- Table 150: Global Lithium-ion Battery Industry Volume K Units Forecast, by Country 2019 & 2032
- Table 151: Brazil Lithium-ion Battery Industry Revenue (Million) Forecast, by Application 2019 & 2032
- Table 152: Brazil Lithium-ion Battery Industry Volume (K Units) Forecast, by Application 2019 & 2032
- Table 153: Argentina Lithium-ion Battery Industry Revenue (Million) Forecast, by Application 2019 & 2032
- Table 154: Argentina Lithium-ion Battery Industry Volume (K Units) Forecast, by Application 2019 & 2032
- Table 155: Colmbia Lithium-ion Battery Industry Revenue (Million) Forecast, by Application 2019 & 2032
- Table 156: Colmbia Lithium-ion Battery Industry Volume (K Units) Forecast, by Application 2019 & 2032
- Table 157: Rest of South America Lithium-ion Battery Industry Revenue (Million) Forecast, by Application 2019 & 2032
- Table 158: Rest of South America Lithium-ion Battery Industry Volume (K Units) Forecast, by Application 2019 & 2032
- Table 159: Global Lithium-ion Battery Industry Revenue Million Forecast, by Application 2019 & 2032
- Table 160: Global Lithium-ion Battery Industry Volume K Units Forecast, by Application 2019 & 2032
- Table 161: Global Lithium-ion Battery Industry Revenue Million Forecast, by Country 2019 & 2032
- Table 162: Global Lithium-ion Battery Industry Volume K Units Forecast, by Country 2019 & 2032
- Table 163: United Arab Emirates Lithium-ion Battery Industry Revenue (Million) Forecast, by Application 2019 & 2032
- Table 164: United Arab Emirates Lithium-ion Battery Industry Volume (K Units) Forecast, by Application 2019 & 2032
- Table 165: Saudi Arabia Lithium-ion Battery Industry Revenue (Million) Forecast, by Application 2019 & 2032
- Table 166: Saudi Arabia Lithium-ion Battery Industry Volume (K Units) Forecast, by Application 2019 & 2032
- Table 167: South Africa Lithium-ion Battery Industry Revenue (Million) Forecast, by Application 2019 & 2032
- Table 168: South Africa Lithium-ion Battery Industry Volume (K Units) Forecast, by Application 2019 & 2032
- Table 169: Nigeria Lithium-ion Battery Industry Revenue (Million) Forecast, by Application 2019 & 2032
- Table 170: Nigeria Lithium-ion Battery Industry Volume (K Units) Forecast, by Application 2019 & 2032
- Table 171: Qatar Lithium-ion Battery Industry Revenue (Million) Forecast, by Application 2019 & 2032
- Table 172: Qatar Lithium-ion Battery Industry Volume (K Units) Forecast, by Application 2019 & 2032
- Table 173: Egypt Lithium-ion Battery Industry Revenue (Million) Forecast, by Application 2019 & 2032
- Table 174: Egypt Lithium-ion Battery Industry Volume (K Units) Forecast, by Application 2019 & 2032
- Table 175: Rest of the Middle East and Africa Lithium-ion Battery Industry Revenue (Million) Forecast, by Application 2019 & 2032
- Table 176: Rest of the Middle East and Africa Lithium-ion Battery Industry Volume (K Units) Forecast, by Application 2019 & 2032
Frequently Asked Questions
1. What is the projected Compound Annual Growth Rate (CAGR) of the Lithium-ion Battery Industry?
The projected CAGR is approximately 14.46%.
2. Which companies are prominent players in the Lithium-ion Battery Industry?
Key companies in the market include Contemporary Amperex Technology Co Limited, LG Chem Ltd, BYD Company Limited, Tianjin Lishen Battery Joint-Stock Co Ltd*List Not Exhaustive 6 4 Market Ranking/Share Analysi, Tesla Inc, Samsung SDI, Panasonic Corporation, Sony Corporation.
3. What are the main segments of the Lithium-ion Battery Industry?
The market segments include Application.
4. Can you provide details about the market size?
The market size is estimated to be USD 64.75 Million as of 2022.
5. What are some drivers contributing to market growth?
4.; Supportive Government Initiatives And Policies To Adopt Renewable Energy4.; Declining Cost Of Lithium-ion Batteries.
6. What are the notable trends driving market growth?
The Automobile Segment Expected to Dominate the Market.
7. Are there any restraints impacting market growth?
4.; Demand-Supply Mismatch of Raw Materials.
8. Can you provide examples of recent developments in the market?
January 2024: Automotive battery maker Amara Raja Batteries Ltd announced its plans to operate a gigafactory before the end of 2025. The company laid the foundation for one of its first gigafactories in the Mahbubnagar district in Telangana, India. The plant is expected to produce lithium cells and battery packs with a capacity of up to 16 GWh and 5 GWh, respectively.
9. What pricing options are available for accessing the report?
Pricing options include single-user, multi-user, and enterprise licenses priced at USD 4750, USD 5250, and USD 8750 respectively.
10. Is the market size provided in terms of value or volume?
The market size is provided in terms of value, measured in Million and volume, measured in K Units.
11. Are there any specific market keywords associated with the report?
Yes, the market keyword associated with the report is "Lithium-ion Battery Industry," which aids in identifying and referencing the specific market segment covered.
12. How do I determine which pricing option suits my needs best?
The pricing options vary based on user requirements and access needs. Individual users may opt for single-user licenses, while businesses requiring broader access may choose multi-user or enterprise licenses for cost-effective access to the report.
13. Are there any additional resources or data provided in the Lithium-ion Battery Industry report?
While the report offers comprehensive insights, it's advisable to review the specific contents or supplementary materials provided to ascertain if additional resources or data are available.
14. How can I stay updated on further developments or reports in the Lithium-ion Battery Industry?
To stay informed about further developments, trends, and reports in the Lithium-ion Battery Industry, consider subscribing to industry newsletters, following relevant companies and organizations, or regularly checking reputable industry news sources and publications.
Methodology
Step 1 - Identification of Relevant Samples Size from Population Database


Step 2 - Approaches for Defining Global Market Size (Value, Volume* & Price*)

Note*: In applicable scenarios
Step 3 - Data Sources
Primary Research
- Web Analytics
- Survey Reports
- Research Institute
- Latest Research Reports
- Opinion Leaders
Secondary Research
- Annual Reports
- White Paper
- Latest Press Release
- Industry Association
- Paid Database
- Investor Presentations

Step 4 - Data Triangulation
Involves using different sources of information in order to increase the validity of a study
These sources are likely to be stakeholders in a program - participants, other researchers, program staff, other community members, and so on.
Then we put all data in single framework & apply various statistical tools to find out the dynamic on the market.
During the analysis stage, feedback from the stakeholder groups would be compared to determine areas of agreement as well as areas of divergence
