

Key Insights
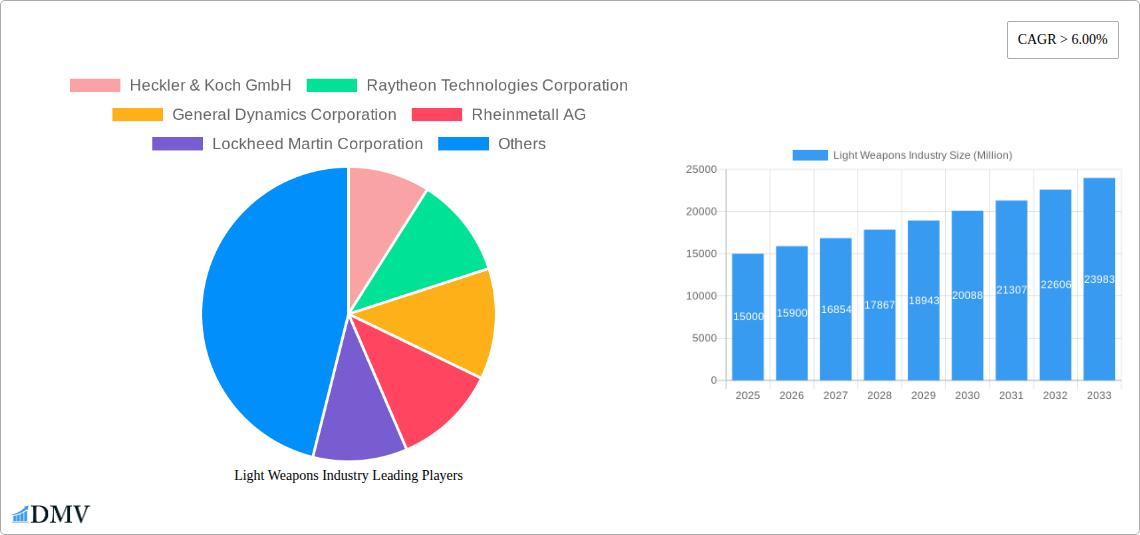
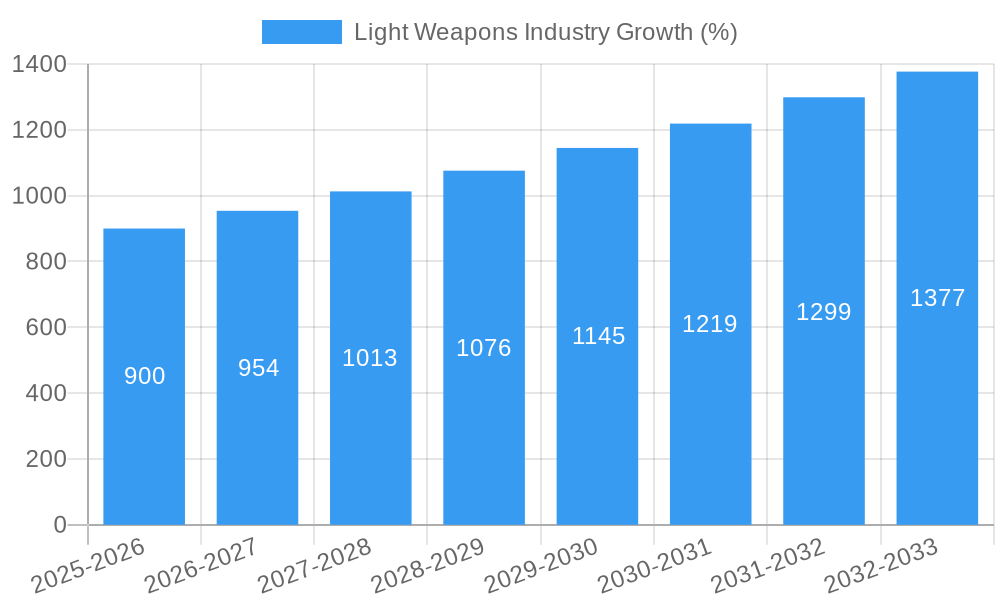
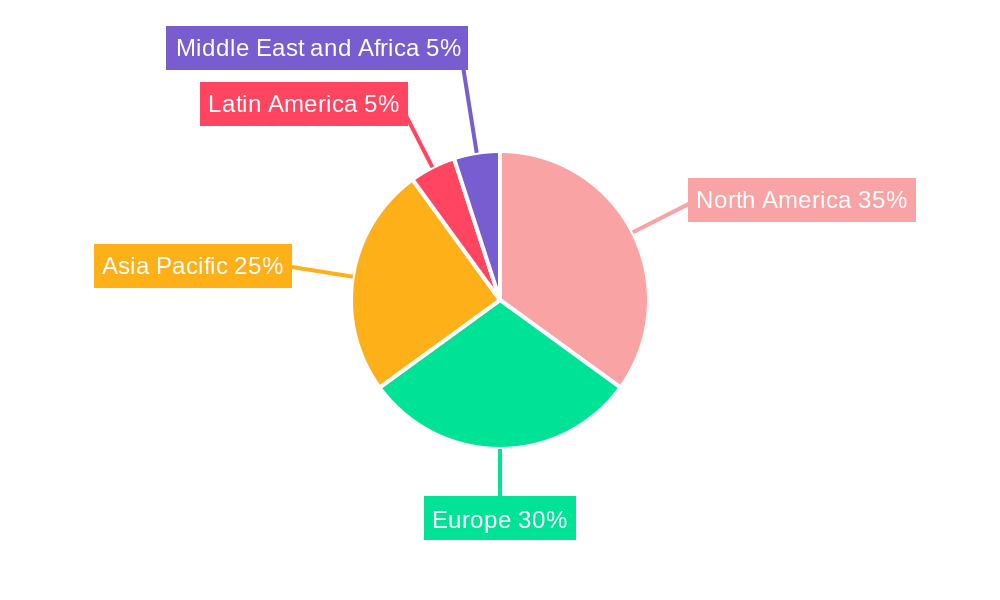
The global light weapons market, encompassing heavy machine guns (HMGs), grenades, mortars, MANPATS, MANPADS, and other types, is experiencing robust growth, projected to maintain a Compound Annual Growth Rate (CAGR) exceeding 6% from 2025 to 2033. This expansion is driven by escalating geopolitical instability, rising defense budgets in key regions, and the ongoing modernization of armed forces worldwide. Technological advancements, particularly in guided munitions and precision-strike capabilities, are significantly influencing market dynamics. The demand for lighter, more accurate, and easier-to-operate weapons is shaping product development, with manufacturers focusing on enhancing lethality while minimizing collateral damage. Furthermore, the increasing adoption of unmanned aerial vehicles (UAVs) and other autonomous systems presents both opportunities and challenges for the light weapons industry, as these platforms necessitate adaptable weapon integration. The market is segmented by weapon type, technology (guided vs. unguided), and line-of-sight capabilities, allowing for a granular analysis of specific niche markets. Regional variations exist, with North America and Europe currently dominating market share, however, the Asia-Pacific region is poised for substantial growth due to increasing military spending and regional conflicts.
The competitive landscape is characterized by a mix of established defense contractors and emerging players. Key players like Heckler & Koch, Raytheon, General Dynamics, Rheinmetall, and Lockheed Martin hold significant market share, leveraging their technological expertise and established supply chains. However, the market also witnesses the emergence of regional players catering to specific defense needs, potentially disrupting the established order. The regulatory environment and international arms control agreements significantly impact market growth and development, influencing the export and import of light weapons. Future growth will depend on evolving geopolitical tensions, technological breakthroughs, and the continuous adaptation of weapon systems to meet the demands of modern warfare. Analyzing the technological segments (guided vs. unguided) alongside regional market penetration offers a comprehensive overview, pinpointing areas ripe for innovation and strategic investment. This understanding is critical for both manufacturers and stakeholders involved in the global light weapons industry.
Light Weapons Industry Market Report: 2019-2033
This comprehensive report provides a detailed analysis of the Light Weapons Industry, offering invaluable insights for stakeholders seeking to understand market dynamics, technological advancements, and future growth opportunities. The study period covers 2019-2033, with a base year of 2025 and a forecast period spanning 2025-2033. The report examines various segments including Heavy Machine Guns (HMGs), Grenades and Grenade Launchers, Mortars, MANPATS, MANPADS, and other types, categorized by technology (Guided, Semi-automatic, Unguided) and command to line of sight. The report values are expressed in Millions of USD.
Light Weapons Industry Market Composition & Trends
This section analyzes the competitive landscape, innovation drivers, regulatory frameworks, and market dynamics within the light weapons industry. The global market shows a high degree of concentration among major players, with leading companies holding significant market share. Mergers and acquisitions (M&A) activities have played a crucial role in shaping the industry landscape, with deal values reaching into the hundreds of millions of USD in recent years. Innovation is spurred by a continuous need for improved accuracy, range, and lethality, alongside evolving threats and battlefield conditions. Regulatory landscapes vary significantly across geographies, influencing production, trade, and end-use. Substitute products and technological advancements are constantly reshaping the competitive dynamics. End-users primarily consist of government and military forces, with the level of procurement driven by geopolitical factors and defense budgets.
- Market Share Distribution (2025 Estimate): Top 5 players hold approximately xx% of the global market. This concentration is expected to remain largely stable throughout the forecast period.
- M&A Activity (2019-2024): A total of xx M&A deals were recorded, with an estimated total value exceeding USD xx million.
- Key Innovation Catalysts: Advancements in materials science, precision guidance systems, and miniaturization technologies.
- Regulatory Landscape: Stringent export controls and end-use restrictions pose significant barriers to entry and market access.
Light Weapons Industry Industry Evolution
The light weapons industry has witnessed significant growth over the past decade, driven by increasing global defense spending, evolving warfare tactics, and technological advancements. The market experienced a compound annual growth rate (CAGR) of xx% during the historical period (2019-2024) and is projected to grow at a CAGR of xx% during the forecast period (2025-2033). This growth is primarily attributed to the increasing demand for advanced weapon systems with enhanced accuracy, range, and lethality. The adoption of guided munitions is rapidly increasing, while the demand for semi-automatic weapons remains significant across various military applications. Consumer demand reflects a shift toward lighter, more ergonomic, and adaptable designs that improve the operational effectiveness of troops in diverse terrains. The emergence of unmanned aerial vehicles (UAVs) and other new technologies is also transforming warfare, leading to greater integration with light weapons.
Leading Regions, Countries, or Segments in Light Weapons Industry
The North American region currently dominates the light weapons market, driven by strong government spending and technological advancements. Europe and Asia-Pacific also represent significant markets, with regional variations in specific segment dominance.
- Dominant Segment (by Type): MANPADS and MANPATS currently exhibit the highest growth trajectory.
- Dominant Segment (by Technology): Guided weapons show the strongest growth potential, driven by increasing accuracy and effectiveness.
- Key Drivers (North America): High defense budgets, technological leadership, and a strong domestic manufacturing base.
- Key Drivers (Europe): Significant defense spending within NATO countries and a robust export market.
- Key Drivers (Asia-Pacific): Rapid military modernization programs and increasing geopolitical instability.
Light Weapons Industry Product Innovations
Recent innovations focus on improving accuracy, range, and lethality while reducing weight and enhancing user-friendliness. This includes the integration of advanced guidance systems, improved materials for enhanced durability and resistance, and the development of smart munitions with increased precision. These advancements significantly enhance the effectiveness and survivability of troops in combat situations. Unique selling propositions are centered around the enhanced effectiveness, reduced collateral damage, and overall improved performance compared to older generations of weapons.
Propelling Factors for Light Weapons Industry Growth
The light weapons industry is experiencing strong growth due to several factors: increased global defense spending in response to geopolitical instability; technological advancements in weapon design, materials, and guidance systems; and the demand for more accurate, effective weapons, coupled with a focus on minimizing collateral damage. Government regulations regarding weapons technology and international trade can significantly affect the pace of industry growth. Moreover, increasing urbanization and asymmetric warfare scenarios demand more adaptable and effective light weapons systems.
Obstacles in the Light Weapons Industry Market
The light weapons industry faces significant obstacles, including stringent regulations governing manufacturing, trade, and end-use of weapons. Supply chain disruptions can impact production and delivery schedules, leading to increased costs and delays. Intense competition among major players creates pressure on pricing and margins. Furthermore, geopolitical instability and regional conflicts can create uncertainty in market demand and investment. The estimated impact of these challenges on annual revenue is roughly USD xx million.
Future Opportunities in Light Weapons Industry
Future opportunities lie in developing lighter, more accurate, and effective weapons systems, integrated with advanced guidance and control systems. The increasing integration of technologies such as artificial intelligence and machine learning in weapons systems offers a significant growth path. New market entrants in emerging economies also offer potential growth avenues.
Major Players in the Light Weapons Industry Ecosystem
- Heckler & Koch GmbH
- Raytheon Technologies Corporation
- General Dynamics Corporation
- Rheinmetall AG
- Lockheed Martin Corporation
- Rostec
- Israel Aerospace Industries Ltd
- MBDA Inc
- Thales Group
- Denel SOC Ltd
- Rafael Advanced Defense Systems Ltd
- BAE Systems PLC
- FN Herstal SA
- Saab AB
Key Developments in Light Weapons Industry Industry
- July 2021: USD 321 million contract awarded to Raytheon Technologies for Stinger missiles.
- May 2021: Spanish Army awards USD 25 million+ contract to Instalaza for C90 grenade launchers.
- January 2022: Finland approves procurement of new rifle systems from Sako.
- February 2022: Indian Army signs USD 413.50 million contract with Bharat Dynamics Limited for Konkurs-M missiles.
Strategic Light Weapons Industry Market Forecast
The light weapons industry is poised for continued growth, driven by ongoing technological advancements, increasing defense budgets, and escalating geopolitical uncertainties. The market is expected to witness strong growth throughout the forecast period, with significant opportunities in the development and adoption of next-generation weapons systems. The market's future growth is projected to remain dynamic, influenced by ongoing technological innovation, defense modernization efforts, and global political landscapes.
Light Weapons Industry Segmentation
-
1. Type
- 1.1. Heavy Machine Guns (HMGs)
- 1.2. Grenades and Grenade Launchers
- 1.3. Mortars
- 1.4. Man-portable Anti-tank Systems (MANPATS)
- 1.5. Man-portable Air Defense Systems (MANPADS)
- 1.6. Other Types
-
2. Technology
-
2.1. Guided
- 2.1.1. Laser Guided
- 2.1.2. Infrared Guided
- 2.1.3. Satellite Guided
- 2.1.4. Semi-automatic Command to Line of Sight
- 2.2. Unguided
-
2.1. Guided
Light Weapons Industry Segmentation By Geography
-
1. North America
- 1.1. United States
- 1.2. Canada
-
2. Europe
- 2.1. United Kingdom
- 2.2. France
- 2.3. Germany
- 2.4. Russia
- 2.5. Rest of Europe
-
3. Asia Pacific
- 3.1. China
- 3.2. India
- 3.3. Japan
- 3.4. South Korea
- 3.5. Rest of Asia Pacific
-
4. Latin America
- 4.1. Brazil
- 4.2. Rest of Latin America
-
5. Middle East and Africa
- 5.1. Saudi Arabia
- 5.2. United Arab Emirates
- 5.3. Israel
- 5.4. Rest of Middle East and Africa
Light Weapons Industry REPORT HIGHLIGHTS
| Aspects | Details |
|---|---|
| Study Period | 2019-2033 |
| Base Year | 2024 |
| Estimated Year | 2025 |
| Forecast Period | 2025-2033 |
| Historical Period | 2019-2024 |
| Growth Rate | CAGR of > 6.00% from 2019-2033 |
| Segmentation |
|
Table of Contents
- 1. Introduction
- 1.1. Research Scope
- 1.2. Market Segmentation
- 1.3. Research Methodology
- 1.4. Definitions and Assumptions
- 2. Executive Summary
- 2.1. Introduction
- 3. Market Dynamics
- 3.1. Introduction
- 3.2. Market Drivers
- 3.3. Market Restrains
- 3.4. Market Trends
- 3.4.1. Evolving Battlefield Engagement Scenarios Driving the Demand for New Generation Weapon Systems
- 4. Market Factor Analysis
- 4.1. Porters Five Forces
- 4.2. Supply/Value Chain
- 4.3. PESTEL analysis
- 4.4. Market Entropy
- 4.5. Patent/Trademark Analysis
- 5. Global Light Weapons Industry Analysis, Insights and Forecast, 2019-2031
- 5.1. Market Analysis, Insights and Forecast - by Type
- 5.1.1. Heavy Machine Guns (HMGs)
- 5.1.2. Grenades and Grenade Launchers
- 5.1.3. Mortars
- 5.1.4. Man-portable Anti-tank Systems (MANPATS)
- 5.1.5. Man-portable Air Defense Systems (MANPADS)
- 5.1.6. Other Types
- 5.2. Market Analysis, Insights and Forecast - by Technology
- 5.2.1. Guided
- 5.2.1.1. Laser Guided
- 5.2.1.2. Infrared Guided
- 5.2.1.3. Satellite Guided
- 5.2.1.4. Semi-automatic Command to Line of Sight
- 5.2.2. Unguided
- 5.2.1. Guided
- 5.3. Market Analysis, Insights and Forecast - by Region
- 5.3.1. North America
- 5.3.2. Europe
- 5.3.3. Asia Pacific
- 5.3.4. Latin America
- 5.3.5. Middle East and Africa
- 5.1. Market Analysis, Insights and Forecast - by Type
- 6. North America Light Weapons Industry Analysis, Insights and Forecast, 2019-2031
- 6.1. Market Analysis, Insights and Forecast - by Type
- 6.1.1. Heavy Machine Guns (HMGs)
- 6.1.2. Grenades and Grenade Launchers
- 6.1.3. Mortars
- 6.1.4. Man-portable Anti-tank Systems (MANPATS)
- 6.1.5. Man-portable Air Defense Systems (MANPADS)
- 6.1.6. Other Types
- 6.2. Market Analysis, Insights and Forecast - by Technology
- 6.2.1. Guided
- 6.2.1.1. Laser Guided
- 6.2.1.2. Infrared Guided
- 6.2.1.3. Satellite Guided
- 6.2.1.4. Semi-automatic Command to Line of Sight
- 6.2.2. Unguided
- 6.2.1. Guided
- 6.1. Market Analysis, Insights and Forecast - by Type
- 7. Europe Light Weapons Industry Analysis, Insights and Forecast, 2019-2031
- 7.1. Market Analysis, Insights and Forecast - by Type
- 7.1.1. Heavy Machine Guns (HMGs)
- 7.1.2. Grenades and Grenade Launchers
- 7.1.3. Mortars
- 7.1.4. Man-portable Anti-tank Systems (MANPATS)
- 7.1.5. Man-portable Air Defense Systems (MANPADS)
- 7.1.6. Other Types
- 7.2. Market Analysis, Insights and Forecast - by Technology
- 7.2.1. Guided
- 7.2.1.1. Laser Guided
- 7.2.1.2. Infrared Guided
- 7.2.1.3. Satellite Guided
- 7.2.1.4. Semi-automatic Command to Line of Sight
- 7.2.2. Unguided
- 7.2.1. Guided
- 7.1. Market Analysis, Insights and Forecast - by Type
- 8. Asia Pacific Light Weapons Industry Analysis, Insights and Forecast, 2019-2031
- 8.1. Market Analysis, Insights and Forecast - by Type
- 8.1.1. Heavy Machine Guns (HMGs)
- 8.1.2. Grenades and Grenade Launchers
- 8.1.3. Mortars
- 8.1.4. Man-portable Anti-tank Systems (MANPATS)
- 8.1.5. Man-portable Air Defense Systems (MANPADS)
- 8.1.6. Other Types
- 8.2. Market Analysis, Insights and Forecast - by Technology
- 8.2.1. Guided
- 8.2.1.1. Laser Guided
- 8.2.1.2. Infrared Guided
- 8.2.1.3. Satellite Guided
- 8.2.1.4. Semi-automatic Command to Line of Sight
- 8.2.2. Unguided
- 8.2.1. Guided
- 8.1. Market Analysis, Insights and Forecast - by Type
- 9. Latin America Light Weapons Industry Analysis, Insights and Forecast, 2019-2031
- 9.1. Market Analysis, Insights and Forecast - by Type
- 9.1.1. Heavy Machine Guns (HMGs)
- 9.1.2. Grenades and Grenade Launchers
- 9.1.3. Mortars
- 9.1.4. Man-portable Anti-tank Systems (MANPATS)
- 9.1.5. Man-portable Air Defense Systems (MANPADS)
- 9.1.6. Other Types
- 9.2. Market Analysis, Insights and Forecast - by Technology
- 9.2.1. Guided
- 9.2.1.1. Laser Guided
- 9.2.1.2. Infrared Guided
- 9.2.1.3. Satellite Guided
- 9.2.1.4. Semi-automatic Command to Line of Sight
- 9.2.2. Unguided
- 9.2.1. Guided
- 9.1. Market Analysis, Insights and Forecast - by Type
- 10. Middle East and Africa Light Weapons Industry Analysis, Insights and Forecast, 2019-2031
- 10.1. Market Analysis, Insights and Forecast - by Type
- 10.1.1. Heavy Machine Guns (HMGs)
- 10.1.2. Grenades and Grenade Launchers
- 10.1.3. Mortars
- 10.1.4. Man-portable Anti-tank Systems (MANPATS)
- 10.1.5. Man-portable Air Defense Systems (MANPADS)
- 10.1.6. Other Types
- 10.2. Market Analysis, Insights and Forecast - by Technology
- 10.2.1. Guided
- 10.2.1.1. Laser Guided
- 10.2.1.2. Infrared Guided
- 10.2.1.3. Satellite Guided
- 10.2.1.4. Semi-automatic Command to Line of Sight
- 10.2.2. Unguided
- 10.2.1. Guided
- 10.1. Market Analysis, Insights and Forecast - by Type
- 11. North America Light Weapons Industry Analysis, Insights and Forecast, 2019-2031
- 11.1. Market Analysis, Insights and Forecast - By Country/Sub-region
- 11.1.1 United States
- 11.1.2 Canada
- 12. Europe Light Weapons Industry Analysis, Insights and Forecast, 2019-2031
- 12.1. Market Analysis, Insights and Forecast - By Country/Sub-region
- 12.1.1 United Kingdom
- 12.1.2 France
- 12.1.3 Germany
- 12.1.4 Russia
- 12.1.5 Rest of Europe
- 13. Asia Pacific Light Weapons Industry Analysis, Insights and Forecast, 2019-2031
- 13.1. Market Analysis, Insights and Forecast - By Country/Sub-region
- 13.1.1 China
- 13.1.2 India
- 13.1.3 Japan
- 13.1.4 South Korea
- 13.1.5 Rest of Asia Pacific
- 14. Latin America Light Weapons Industry Analysis, Insights and Forecast, 2019-2031
- 14.1. Market Analysis, Insights and Forecast - By Country/Sub-region
- 14.1.1 Brazil
- 14.1.2 Rest of Latin America
- 15. Middle East and Africa Light Weapons Industry Analysis, Insights and Forecast, 2019-2031
- 15.1. Market Analysis, Insights and Forecast - By Country/Sub-region
- 15.1.1 Saudi Arabia
- 15.1.2 United Arab Emirates
- 15.1.3 Israel
- 15.1.4 Rest of Middle East and Africa
- 16. Competitive Analysis
- 16.1. Global Market Share Analysis 2024
- 16.2. Company Profiles
- 16.2.1 Heckler & Koch GmbH
- 16.2.1.1. Overview
- 16.2.1.2. Products
- 16.2.1.3. SWOT Analysis
- 16.2.1.4. Recent Developments
- 16.2.1.5. Financials (Based on Availability)
- 16.2.2 Raytheon Technologies Corporation
- 16.2.2.1. Overview
- 16.2.2.2. Products
- 16.2.2.3. SWOT Analysis
- 16.2.2.4. Recent Developments
- 16.2.2.5. Financials (Based on Availability)
- 16.2.3 General Dynamics Corporation
- 16.2.3.1. Overview
- 16.2.3.2. Products
- 16.2.3.3. SWOT Analysis
- 16.2.3.4. Recent Developments
- 16.2.3.5. Financials (Based on Availability)
- 16.2.4 Rheinmetall AG
- 16.2.4.1. Overview
- 16.2.4.2. Products
- 16.2.4.3. SWOT Analysis
- 16.2.4.4. Recent Developments
- 16.2.4.5. Financials (Based on Availability)
- 16.2.5 Lockheed Martin Corporation
- 16.2.5.1. Overview
- 16.2.5.2. Products
- 16.2.5.3. SWOT Analysis
- 16.2.5.4. Recent Developments
- 16.2.5.5. Financials (Based on Availability)
- 16.2.6 Rostec
- 16.2.6.1. Overview
- 16.2.6.2. Products
- 16.2.6.3. SWOT Analysis
- 16.2.6.4. Recent Developments
- 16.2.6.5. Financials (Based on Availability)
- 16.2.7 Israel Aerospace Industries Lt
- 16.2.7.1. Overview
- 16.2.7.2. Products
- 16.2.7.3. SWOT Analysis
- 16.2.7.4. Recent Developments
- 16.2.7.5. Financials (Based on Availability)
- 16.2.8 MBDA Inc
- 16.2.8.1. Overview
- 16.2.8.2. Products
- 16.2.8.3. SWOT Analysis
- 16.2.8.4. Recent Developments
- 16.2.8.5. Financials (Based on Availability)
- 16.2.9 Thales Group
- 16.2.9.1. Overview
- 16.2.9.2. Products
- 16.2.9.3. SWOT Analysis
- 16.2.9.4. Recent Developments
- 16.2.9.5. Financials (Based on Availability)
- 16.2.10 Denel SOC Ltd
- 16.2.10.1. Overview
- 16.2.10.2. Products
- 16.2.10.3. SWOT Analysis
- 16.2.10.4. Recent Developments
- 16.2.10.5. Financials (Based on Availability)
- 16.2.11 Rafael Advanced Defense Systems Ltd
- 16.2.11.1. Overview
- 16.2.11.2. Products
- 16.2.11.3. SWOT Analysis
- 16.2.11.4. Recent Developments
- 16.2.11.5. Financials (Based on Availability)
- 16.2.12 BAE Systems PLC
- 16.2.12.1. Overview
- 16.2.12.2. Products
- 16.2.12.3. SWOT Analysis
- 16.2.12.4. Recent Developments
- 16.2.12.5. Financials (Based on Availability)
- 16.2.13 FN Herstal SA
- 16.2.13.1. Overview
- 16.2.13.2. Products
- 16.2.13.3. SWOT Analysis
- 16.2.13.4. Recent Developments
- 16.2.13.5. Financials (Based on Availability)
- 16.2.14 Saab AB
- 16.2.14.1. Overview
- 16.2.14.2. Products
- 16.2.14.3. SWOT Analysis
- 16.2.14.4. Recent Developments
- 16.2.14.5. Financials (Based on Availability)
- 16.2.1 Heckler & Koch GmbH
List of Figures
- Figure 1: Global Light Weapons Industry Revenue Breakdown (Million, %) by Region 2024 & 2032
- Figure 2: North America Light Weapons Industry Revenue (Million), by Country 2024 & 2032
- Figure 3: North America Light Weapons Industry Revenue Share (%), by Country 2024 & 2032
- Figure 4: Europe Light Weapons Industry Revenue (Million), by Country 2024 & 2032
- Figure 5: Europe Light Weapons Industry Revenue Share (%), by Country 2024 & 2032
- Figure 6: Asia Pacific Light Weapons Industry Revenue (Million), by Country 2024 & 2032
- Figure 7: Asia Pacific Light Weapons Industry Revenue Share (%), by Country 2024 & 2032
- Figure 8: Latin America Light Weapons Industry Revenue (Million), by Country 2024 & 2032
- Figure 9: Latin America Light Weapons Industry Revenue Share (%), by Country 2024 & 2032
- Figure 10: Middle East and Africa Light Weapons Industry Revenue (Million), by Country 2024 & 2032
- Figure 11: Middle East and Africa Light Weapons Industry Revenue Share (%), by Country 2024 & 2032
- Figure 12: North America Light Weapons Industry Revenue (Million), by Type 2024 & 2032
- Figure 13: North America Light Weapons Industry Revenue Share (%), by Type 2024 & 2032
- Figure 14: North America Light Weapons Industry Revenue (Million), by Technology 2024 & 2032
- Figure 15: North America Light Weapons Industry Revenue Share (%), by Technology 2024 & 2032
- Figure 16: North America Light Weapons Industry Revenue (Million), by Country 2024 & 2032
- Figure 17: North America Light Weapons Industry Revenue Share (%), by Country 2024 & 2032
- Figure 18: Europe Light Weapons Industry Revenue (Million), by Type 2024 & 2032
- Figure 19: Europe Light Weapons Industry Revenue Share (%), by Type 2024 & 2032
- Figure 20: Europe Light Weapons Industry Revenue (Million), by Technology 2024 & 2032
- Figure 21: Europe Light Weapons Industry Revenue Share (%), by Technology 2024 & 2032
- Figure 22: Europe Light Weapons Industry Revenue (Million), by Country 2024 & 2032
- Figure 23: Europe Light Weapons Industry Revenue Share (%), by Country 2024 & 2032
- Figure 24: Asia Pacific Light Weapons Industry Revenue (Million), by Type 2024 & 2032
- Figure 25: Asia Pacific Light Weapons Industry Revenue Share (%), by Type 2024 & 2032
- Figure 26: Asia Pacific Light Weapons Industry Revenue (Million), by Technology 2024 & 2032
- Figure 27: Asia Pacific Light Weapons Industry Revenue Share (%), by Technology 2024 & 2032
- Figure 28: Asia Pacific Light Weapons Industry Revenue (Million), by Country 2024 & 2032
- Figure 29: Asia Pacific Light Weapons Industry Revenue Share (%), by Country 2024 & 2032
- Figure 30: Latin America Light Weapons Industry Revenue (Million), by Type 2024 & 2032
- Figure 31: Latin America Light Weapons Industry Revenue Share (%), by Type 2024 & 2032
- Figure 32: Latin America Light Weapons Industry Revenue (Million), by Technology 2024 & 2032
- Figure 33: Latin America Light Weapons Industry Revenue Share (%), by Technology 2024 & 2032
- Figure 34: Latin America Light Weapons Industry Revenue (Million), by Country 2024 & 2032
- Figure 35: Latin America Light Weapons Industry Revenue Share (%), by Country 2024 & 2032
- Figure 36: Middle East and Africa Light Weapons Industry Revenue (Million), by Type 2024 & 2032
- Figure 37: Middle East and Africa Light Weapons Industry Revenue Share (%), by Type 2024 & 2032
- Figure 38: Middle East and Africa Light Weapons Industry Revenue (Million), by Technology 2024 & 2032
- Figure 39: Middle East and Africa Light Weapons Industry Revenue Share (%), by Technology 2024 & 2032
- Figure 40: Middle East and Africa Light Weapons Industry Revenue (Million), by Country 2024 & 2032
- Figure 41: Middle East and Africa Light Weapons Industry Revenue Share (%), by Country 2024 & 2032
List of Tables
- Table 1: Global Light Weapons Industry Revenue Million Forecast, by Region 2019 & 2032
- Table 2: Global Light Weapons Industry Revenue Million Forecast, by Type 2019 & 2032
- Table 3: Global Light Weapons Industry Revenue Million Forecast, by Technology 2019 & 2032
- Table 4: Global Light Weapons Industry Revenue Million Forecast, by Region 2019 & 2032
- Table 5: Global Light Weapons Industry Revenue Million Forecast, by Country 2019 & 2032
- Table 6: United States Light Weapons Industry Revenue (Million) Forecast, by Application 2019 & 2032
- Table 7: Canada Light Weapons Industry Revenue (Million) Forecast, by Application 2019 & 2032
- Table 8: Global Light Weapons Industry Revenue Million Forecast, by Country 2019 & 2032
- Table 9: United Kingdom Light Weapons Industry Revenue (Million) Forecast, by Application 2019 & 2032
- Table 10: France Light Weapons Industry Revenue (Million) Forecast, by Application 2019 & 2032
- Table 11: Germany Light Weapons Industry Revenue (Million) Forecast, by Application 2019 & 2032
- Table 12: Russia Light Weapons Industry Revenue (Million) Forecast, by Application 2019 & 2032
- Table 13: Rest of Europe Light Weapons Industry Revenue (Million) Forecast, by Application 2019 & 2032
- Table 14: Global Light Weapons Industry Revenue Million Forecast, by Country 2019 & 2032
- Table 15: China Light Weapons Industry Revenue (Million) Forecast, by Application 2019 & 2032
- Table 16: India Light Weapons Industry Revenue (Million) Forecast, by Application 2019 & 2032
- Table 17: Japan Light Weapons Industry Revenue (Million) Forecast, by Application 2019 & 2032
- Table 18: South Korea Light Weapons Industry Revenue (Million) Forecast, by Application 2019 & 2032
- Table 19: Rest of Asia Pacific Light Weapons Industry Revenue (Million) Forecast, by Application 2019 & 2032
- Table 20: Global Light Weapons Industry Revenue Million Forecast, by Country 2019 & 2032
- Table 21: Brazil Light Weapons Industry Revenue (Million) Forecast, by Application 2019 & 2032
- Table 22: Rest of Latin America Light Weapons Industry Revenue (Million) Forecast, by Application 2019 & 2032
- Table 23: Global Light Weapons Industry Revenue Million Forecast, by Country 2019 & 2032
- Table 24: Saudi Arabia Light Weapons Industry Revenue (Million) Forecast, by Application 2019 & 2032
- Table 25: United Arab Emirates Light Weapons Industry Revenue (Million) Forecast, by Application 2019 & 2032
- Table 26: Israel Light Weapons Industry Revenue (Million) Forecast, by Application 2019 & 2032
- Table 27: Rest of Middle East and Africa Light Weapons Industry Revenue (Million) Forecast, by Application 2019 & 2032
- Table 28: Global Light Weapons Industry Revenue Million Forecast, by Type 2019 & 2032
- Table 29: Global Light Weapons Industry Revenue Million Forecast, by Technology 2019 & 2032
- Table 30: Global Light Weapons Industry Revenue Million Forecast, by Country 2019 & 2032
- Table 31: United States Light Weapons Industry Revenue (Million) Forecast, by Application 2019 & 2032
- Table 32: Canada Light Weapons Industry Revenue (Million) Forecast, by Application 2019 & 2032
- Table 33: Global Light Weapons Industry Revenue Million Forecast, by Type 2019 & 2032
- Table 34: Global Light Weapons Industry Revenue Million Forecast, by Technology 2019 & 2032
- Table 35: Global Light Weapons Industry Revenue Million Forecast, by Country 2019 & 2032
- Table 36: United Kingdom Light Weapons Industry Revenue (Million) Forecast, by Application 2019 & 2032
- Table 37: France Light Weapons Industry Revenue (Million) Forecast, by Application 2019 & 2032
- Table 38: Germany Light Weapons Industry Revenue (Million) Forecast, by Application 2019 & 2032
- Table 39: Russia Light Weapons Industry Revenue (Million) Forecast, by Application 2019 & 2032
- Table 40: Rest of Europe Light Weapons Industry Revenue (Million) Forecast, by Application 2019 & 2032
- Table 41: Global Light Weapons Industry Revenue Million Forecast, by Type 2019 & 2032
- Table 42: Global Light Weapons Industry Revenue Million Forecast, by Technology 2019 & 2032
- Table 43: Global Light Weapons Industry Revenue Million Forecast, by Country 2019 & 2032
- Table 44: China Light Weapons Industry Revenue (Million) Forecast, by Application 2019 & 2032
- Table 45: India Light Weapons Industry Revenue (Million) Forecast, by Application 2019 & 2032
- Table 46: Japan Light Weapons Industry Revenue (Million) Forecast, by Application 2019 & 2032
- Table 47: South Korea Light Weapons Industry Revenue (Million) Forecast, by Application 2019 & 2032
- Table 48: Rest of Asia Pacific Light Weapons Industry Revenue (Million) Forecast, by Application 2019 & 2032
- Table 49: Global Light Weapons Industry Revenue Million Forecast, by Type 2019 & 2032
- Table 50: Global Light Weapons Industry Revenue Million Forecast, by Technology 2019 & 2032
- Table 51: Global Light Weapons Industry Revenue Million Forecast, by Country 2019 & 2032
- Table 52: Brazil Light Weapons Industry Revenue (Million) Forecast, by Application 2019 & 2032
- Table 53: Rest of Latin America Light Weapons Industry Revenue (Million) Forecast, by Application 2019 & 2032
- Table 54: Global Light Weapons Industry Revenue Million Forecast, by Type 2019 & 2032
- Table 55: Global Light Weapons Industry Revenue Million Forecast, by Technology 2019 & 2032
- Table 56: Global Light Weapons Industry Revenue Million Forecast, by Country 2019 & 2032
- Table 57: Saudi Arabia Light Weapons Industry Revenue (Million) Forecast, by Application 2019 & 2032
- Table 58: United Arab Emirates Light Weapons Industry Revenue (Million) Forecast, by Application 2019 & 2032
- Table 59: Israel Light Weapons Industry Revenue (Million) Forecast, by Application 2019 & 2032
- Table 60: Rest of Middle East and Africa Light Weapons Industry Revenue (Million) Forecast, by Application 2019 & 2032
Frequently Asked Questions
1. What is the projected Compound Annual Growth Rate (CAGR) of the Light Weapons Industry?
The projected CAGR is approximately > 6.00%.
2. Which companies are prominent players in the Light Weapons Industry?
Key companies in the market include Heckler & Koch GmbH, Raytheon Technologies Corporation, General Dynamics Corporation, Rheinmetall AG, Lockheed Martin Corporation, Rostec, Israel Aerospace Industries Lt, MBDA Inc, Thales Group, Denel SOC Ltd, Rafael Advanced Defense Systems Ltd, BAE Systems PLC, FN Herstal SA, Saab AB.
3. What are the main segments of the Light Weapons Industry?
The market segments include Type, Technology.
4. Can you provide details about the market size?
The market size is estimated to be USD XX Million as of 2022.
5. What are some drivers contributing to market growth?
N/A
6. What are the notable trends driving market growth?
Evolving Battlefield Engagement Scenarios Driving the Demand for New Generation Weapon Systems.
7. Are there any restraints impacting market growth?
N/A
8. Can you provide examples of recent developments in the market?
In February 2022, the Indian Army signed a contract worth INR 3,131.82 crore (USD 413.50 million) with Bharat Dynamics Limited (BDL) to manufacture and supply Konkurs-M anti-tank guided missiles to destroy armored vehicles equipped with explosive reactive armors. The contract is expected to run over a period of three years.
9. What pricing options are available for accessing the report?
Pricing options include single-user, multi-user, and enterprise licenses priced at USD 4750, USD 5250, and USD 8750 respectively.
10. Is the market size provided in terms of value or volume?
The market size is provided in terms of value, measured in Million.
11. Are there any specific market keywords associated with the report?
Yes, the market keyword associated with the report is "Light Weapons Industry," which aids in identifying and referencing the specific market segment covered.
12. How do I determine which pricing option suits my needs best?
The pricing options vary based on user requirements and access needs. Individual users may opt for single-user licenses, while businesses requiring broader access may choose multi-user or enterprise licenses for cost-effective access to the report.
13. Are there any additional resources or data provided in the Light Weapons Industry report?
While the report offers comprehensive insights, it's advisable to review the specific contents or supplementary materials provided to ascertain if additional resources or data are available.
14. How can I stay updated on further developments or reports in the Light Weapons Industry?
To stay informed about further developments, trends, and reports in the Light Weapons Industry, consider subscribing to industry newsletters, following relevant companies and organizations, or regularly checking reputable industry news sources and publications.
Methodology
Step 1 - Identification of Relevant Samples Size from Population Database


Step 2 - Approaches for Defining Global Market Size (Value, Volume* & Price*)

Note*: In applicable scenarios
Step 3 - Data Sources
Primary Research
- Web Analytics
- Survey Reports
- Research Institute
- Latest Research Reports
- Opinion Leaders
Secondary Research
- Annual Reports
- White Paper
- Latest Press Release
- Industry Association
- Paid Database
- Investor Presentations

Step 4 - Data Triangulation
Involves using different sources of information in order to increase the validity of a study
These sources are likely to be stakeholders in a program - participants, other researchers, program staff, other community members, and so on.
Then we put all data in single framework & apply various statistical tools to find out the dynamic on the market.
During the analysis stage, feedback from the stakeholder groups would be compared to determine areas of agreement as well as areas of divergence
