

Key Insights
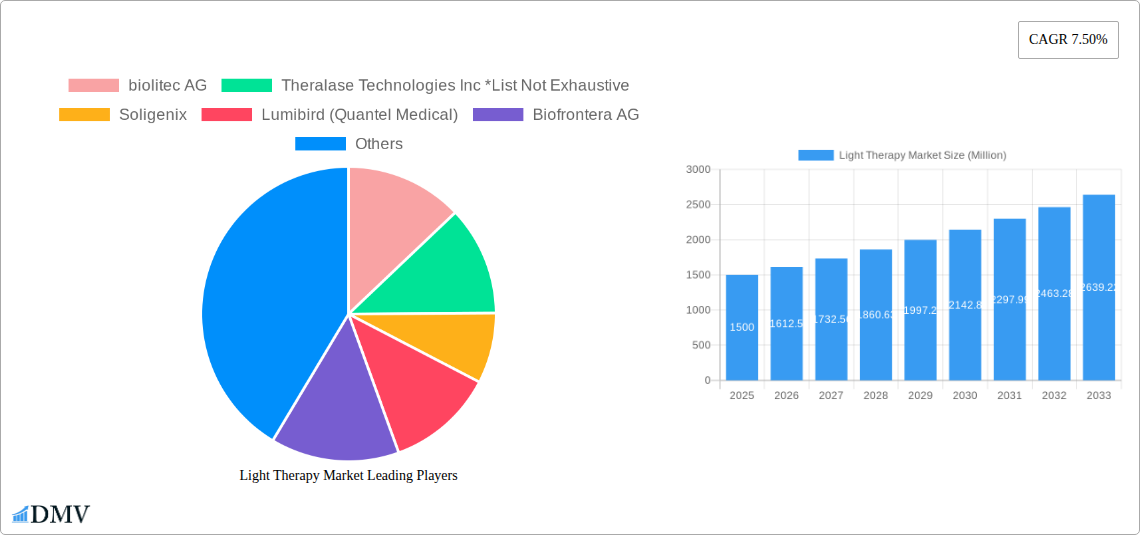
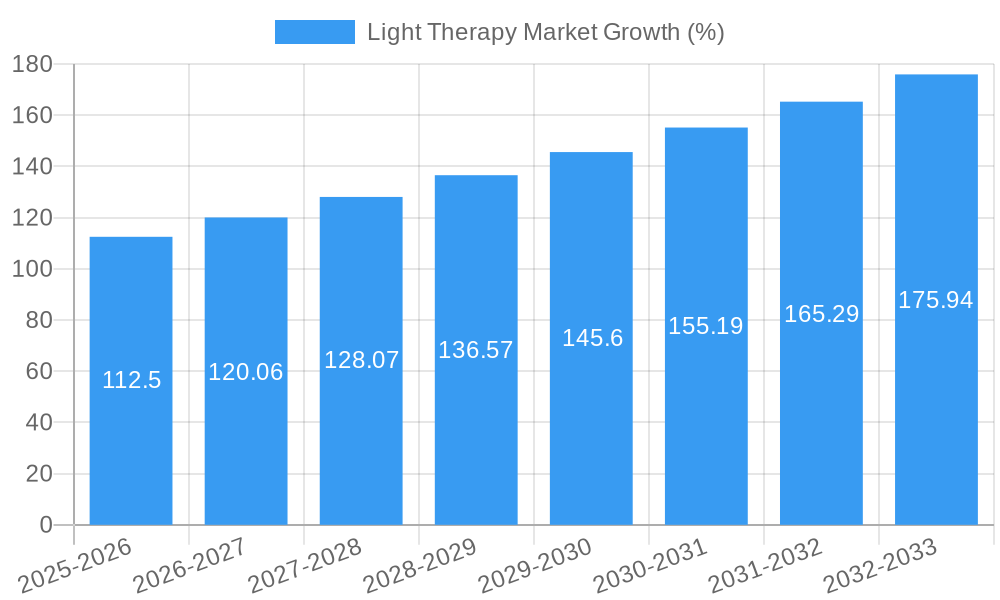
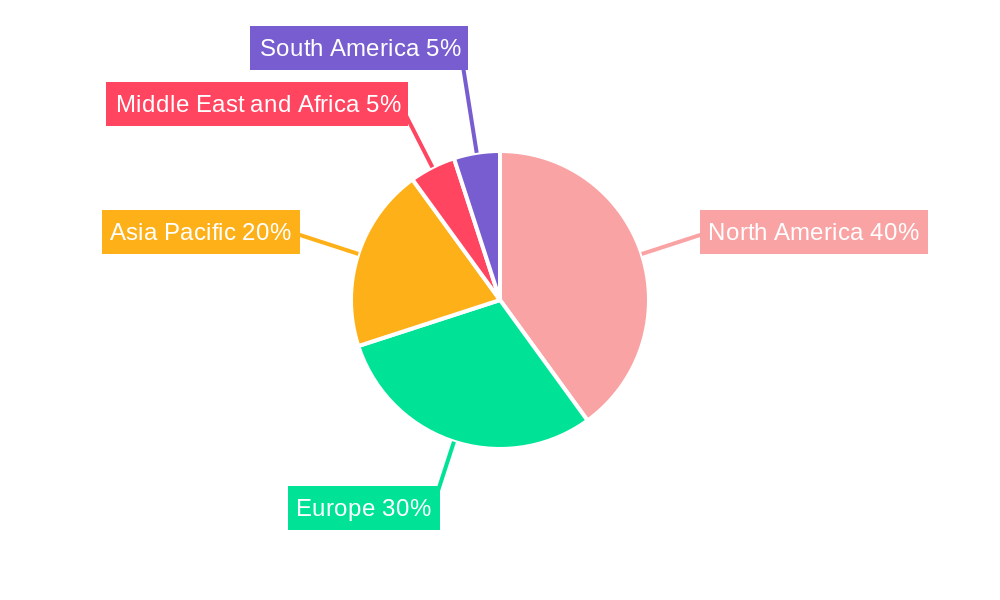
The global light therapy market is experiencing robust growth, projected to reach a significant size by 2033, driven by a 7.5% compound annual growth rate (CAGR). This expansion is fueled by several key factors. The increasing prevalence of skin conditions like acne, psoriasis, and actinic keratosis is significantly boosting demand for effective non-invasive treatments. Moreover, the rising awareness among consumers and healthcare professionals about the efficacy and safety of light therapy, compared to traditional methods, is driving market adoption. Technological advancements in photodynamic therapy (PDT) devices, offering enhanced precision and treatment outcomes, are further propelling market growth. Hospitals and cosmetic dermatology clinics are the primary end-users, representing a substantial portion of the market share. The market is segmented by product (photosensitizer drugs and photodynamic therapy devices) and application (cancer treatment, dermatological conditions like acne and psoriasis). Geographic regions like North America and Europe currently dominate the market due to advanced healthcare infrastructure and high disposable income, but the Asia-Pacific region is expected to witness considerable growth in the coming years, fueled by rising healthcare expenditure and growing awareness of light therapy. Competition within the market is moderate, with key players like Biolitec AG, Theralase Technologies Inc., and Soligenix innovating and expanding their product portfolios to cater to diverse market needs. While regulatory hurdles and potential side effects might pose some constraints, the overall market outlook remains positive, indicating a strong trajectory for growth in the foreseeable future.
The market's success hinges on continued innovation in device technology, leading to more efficient and user-friendly systems. Furthermore, ongoing research into the applications of light therapy across a wider range of conditions, including specific cancers and inflammatory diseases, will be crucial for future expansion. The increasing emphasis on minimally invasive procedures and the growing preference for outpatient treatments further support the market's positive prospects. Collaboration between manufacturers and healthcare providers to educate patients and expand access to light therapy will also play a critical role in sustaining the market's growth trajectory. Finally, strategic partnerships and mergers & acquisitions are likely to further shape the competitive landscape and drive innovation within the light therapy market.
Light Therapy Market: A Comprehensive Report (2019-2033)
This insightful report provides a detailed analysis of the Light Therapy Market, projecting a market valuation of xx Million by 2033. The study period spans 2019-2033, with 2025 serving as the base and estimated year. This comprehensive analysis delves into market trends, competitive landscapes, technological advancements, and future growth prospects, providing crucial insights for stakeholders across the industry. Key players like biolitec AG, Theralase Technologies Inc., Soligenix, Lumibird (Quantel Medical), Biofrontera AG, Galderma S.A., Modulight Inc., Sun Pharmaceutical Industries Limited, and Bausch Health Companies Inc. are profiled, offering a granular understanding of the market dynamics.
Light Therapy Market Composition & Trends
This section evaluates the market's competitive landscape, encompassing market share distribution, M&A activities, and regulatory influences impacting the growth of the Light Therapy Market. The report dissects the market concentration, identifying key players and their respective market shares. It also analyzes innovation catalysts, such as advancements in photosensitizer drugs and photodynamic therapy devices, shaping market evolution. The regulatory landscape, including FDA approvals and international standards, is meticulously examined. Furthermore, the report considers substitute products and their impact on market competition, offering a comprehensive overview of the end-user profile, including hospitals, cosmetic and dermatology clinics, and other relevant stakeholders. Finally, a thorough analysis of M&A activities, including deal values and their implications for market consolidation, is included.
- Market Concentration: Highly fragmented with top 5 players holding approximately xx% market share in 2025.
- M&A Activity: xx number of deals recorded between 2019-2024, with a total value of approximately xx Million.
- Regulatory Landscape: Stringent regulatory approvals in key markets influence market entry and product development.
- Substitute Products: Alternative treatment options exert competitive pressure, impacting market growth.
Light Therapy Market Industry Evolution
This in-depth analysis charts the trajectory of the Light Therapy Market from 2019 to 2033, examining technological advancements and evolving consumer demands. The report details market growth trajectories, showcasing CAGR figures for the historical period (2019-2024) and the forecast period (2025-2033). It highlights the pivotal role of technological advancements, such as improved photosensitizers and enhanced light delivery systems, in driving market expansion. Furthermore, it explores shifting consumer preferences, including growing awareness of minimally invasive treatments and rising demand for personalized therapies. Specific data points, like adoption rates of new technologies and consumer preference shifts are included. The increasing prevalence of skin cancers and other dermatological conditions fuels the growth in demand for effective light therapy solutions. The integration of artificial intelligence and machine learning for personalized treatment protocols further propels market growth.
Leading Regions, Countries, or Segments in Light Therapy Market
This section identifies the leading regions, countries, and segments within the Light Therapy Market. It analyzes market dominance factors through in-depth paragraphs, while using bullet points to highlight key drivers for growth across different categories:
By Product: The Photosensitizer Drugs segment is projected to dominate the market due to its increasing use in various applications, particularly in cancer treatment. The “Others” category, encompassing photodynamic therapy devices, is also experiencing significant growth, driven by technological advancements.
By Application: The Cancer segment holds the largest market share due to the high prevalence of various types of cancer and its suitability for photodynamic therapy. The Actinic Keratosis segment shows significant growth potential due to rising incidence rates and increasing awareness. Acne and Psoriasis applications are also witnessing substantial growth.
By End-User: Hospitals represent the leading end-user segment owing to their extensive infrastructure and medical expertise. Cosmetic and Dermatology Clinics contribute a significant portion, driven by rising consumer demand for aesthetic treatments.
Key Drivers:
- High Prevalence of Target Diseases
- Technological Advancements in Device Design
- Increasing Healthcare Spending
- Favorable Regulatory Environment (e.g., FDA approvals)
- Growing Awareness and Acceptance of Minimally Invasive Procedures
Light Therapy Market Product Innovations
Recent advancements in light therapy encompass novel photosensitizers with improved efficacy and reduced side effects, along with more sophisticated light delivery systems offering precise targeting and enhanced treatment outcomes. These innovations translate into improved treatment outcomes, reduced side effects, and enhanced patient experience. The development of portable and user-friendly devices is expanding accessibility and convenience. Unique selling propositions include improved target specificity, faster treatment times, and minimized invasiveness.
Propelling Factors for Light Therapy Market Growth
Several factors contribute to the growth of the Light Therapy Market. Technological advancements, such as the development of more effective photosensitizers and refined light sources, are key drivers. The rising prevalence of skin cancers and other dermatological conditions significantly boosts demand. Favorable regulatory environments, such as FDA approvals, facilitate market penetration. Economic factors, including increased healthcare spending, further fuel market expansion.
Obstacles in the Light Therapy Market
Challenges include high treatment costs, potential side effects (though minimized by new technology), and stringent regulatory approvals that can delay product launches. Supply chain disruptions and intense competition from established players and emerging startups present additional obstacles.
Future Opportunities in Light Therapy Market
Emerging opportunities include exploring new applications of light therapy in treating various diseases. Advancements in personalized medicine and the development of AI-driven treatment protocols offer further growth potential. Expansion into new markets, especially in developing countries, presents significant untapped opportunities.
Major Players in the Light Therapy Market Ecosystem
- biolitec AG
- Theralase Technologies Inc
- Soligenix
- Lumibird (Quantel Medical)
- Biofrontera AG
- Galderma S.A.
- Modulight Inc
- Sun Pharmaceutical Industries Limited
- Bausch Health Companies Inc
Key Developments in Light Therapy Market Industry
- August 2022: Asieris Pharmaceuticals completed enrollment in its multinational Phase III Clinical Trial of Cevira (APRICITY), a novel non-surgical treatment for cervical high-grade squamous intraepithelial lesions (HSIL).
- March 2022: Biofrontera Inc.'s BF-RhodoLED XL illumination device was listed in the FDA's Orange Book.
Strategic Light Therapy Market Forecast
The Light Therapy Market is poised for robust growth, driven by technological innovations, increasing disease prevalence, and rising healthcare spending. Expanding applications in various medical and aesthetic fields, coupled with favorable regulatory landscapes, will further stimulate market expansion. The market is expected to witness significant growth during the forecast period (2025-2033), presenting substantial opportunities for industry participants.
Light Therapy Market Segmentation
-
1. Product
-
1.1. Photosensitizer Drugs
- 1.1.1. Aminolevulinic Acid
- 1.1.2. Porphyrin Derivatives
- 1.1.3. Chlorines
- 1.1.4. Others
-
1.2. Photodynamic Therapy Devices
- 1.2.1. Diode Lasers
- 1.2.2. Disposable Fiber Optic Light Delivery Devices
-
1.1. Photosensitizer Drugs
-
2. Applications
- 2.1. Cancer
- 2.2. Actinic Keratosis
- 2.3. Acne
- 2.4. Psoriasis
- 2.5. Others
-
3. End-User
- 3.1. Hospitals
- 3.2. Cosmetic and Dermatology Clinics
- 3.3. Others
Light Therapy Market Segmentation By Geography
-
1. North America
- 1.1. United States
- 1.2. Canada
- 1.3. Mexico
-
2. Europe
- 2.1. Germany
- 2.2. United Kingdom
- 2.3. France
- 2.4. Italy
- 2.5. Spain
- 2.6. Rest of Europe
-
3. Asia Pacific
- 3.1. China
- 3.2. Japan
- 3.3. India
- 3.4. Australia
- 3.5. South Korea
- 3.6. Rest of Asia Pacific
-
4. Middle East and Africa
- 4.1. GCC
- 4.2. South Africa
- 4.3. Rest of Middle East and Africa
-
5. South America
- 5.1. Brazil
- 5.2. Argentina
- 5.3. Rest of South America
Light Therapy Market REPORT HIGHLIGHTS
| Aspects | Details |
|---|---|
| Study Period | 2019-2033 |
| Base Year | 2024 |
| Estimated Year | 2025 |
| Forecast Period | 2025-2033 |
| Historical Period | 2019-2024 |
| Growth Rate | CAGR of 7.50% from 2019-2033 |
| Segmentation |
|
Table of Contents
- 1. Introduction
- 1.1. Research Scope
- 1.2. Market Segmentation
- 1.3. Research Methodology
- 1.4. Definitions and Assumptions
- 2. Executive Summary
- 2.1. Introduction
- 3. Market Dynamics
- 3.1. Introduction
- 3.2. Market Drivers
- 3.2.1. Growing Prevalence of Cancer Around the World; Advancements in Device Technologies
- 3.3. Market Restrains
- 3.3.1. High Cost of Photodynamic Therapy; Risk and Side Effects Associated With The Therapy
- 3.4. Market Trends
- 3.4.1. The Photosensitizer Drugs Segment is Expected to Hold a Major Market Share in the Photodynamic Therapy Market
- 4. Market Factor Analysis
- 4.1. Porters Five Forces
- 4.2. Supply/Value Chain
- 4.3. PESTEL analysis
- 4.4. Market Entropy
- 4.5. Patent/Trademark Analysis
- 5. Global Light Therapy Market Analysis, Insights and Forecast, 2019-2031
- 5.1. Market Analysis, Insights and Forecast - by Product
- 5.1.1. Photosensitizer Drugs
- 5.1.1.1. Aminolevulinic Acid
- 5.1.1.2. Porphyrin Derivatives
- 5.1.1.3. Chlorines
- 5.1.1.4. Others
- 5.1.2. Photodynamic Therapy Devices
- 5.1.2.1. Diode Lasers
- 5.1.2.2. Disposable Fiber Optic Light Delivery Devices
- 5.1.1. Photosensitizer Drugs
- 5.2. Market Analysis, Insights and Forecast - by Applications
- 5.2.1. Cancer
- 5.2.2. Actinic Keratosis
- 5.2.3. Acne
- 5.2.4. Psoriasis
- 5.2.5. Others
- 5.3. Market Analysis, Insights and Forecast - by End-User
- 5.3.1. Hospitals
- 5.3.2. Cosmetic and Dermatology Clinics
- 5.3.3. Others
- 5.4. Market Analysis, Insights and Forecast - by Region
- 5.4.1. North America
- 5.4.2. Europe
- 5.4.3. Asia Pacific
- 5.4.4. Middle East and Africa
- 5.4.5. South America
- 5.1. Market Analysis, Insights and Forecast - by Product
- 6. North America Light Therapy Market Analysis, Insights and Forecast, 2019-2031
- 6.1. Market Analysis, Insights and Forecast - by Product
- 6.1.1. Photosensitizer Drugs
- 6.1.1.1. Aminolevulinic Acid
- 6.1.1.2. Porphyrin Derivatives
- 6.1.1.3. Chlorines
- 6.1.1.4. Others
- 6.1.2. Photodynamic Therapy Devices
- 6.1.2.1. Diode Lasers
- 6.1.2.2. Disposable Fiber Optic Light Delivery Devices
- 6.1.1. Photosensitizer Drugs
- 6.2. Market Analysis, Insights and Forecast - by Applications
- 6.2.1. Cancer
- 6.2.2. Actinic Keratosis
- 6.2.3. Acne
- 6.2.4. Psoriasis
- 6.2.5. Others
- 6.3. Market Analysis, Insights and Forecast - by End-User
- 6.3.1. Hospitals
- 6.3.2. Cosmetic and Dermatology Clinics
- 6.3.3. Others
- 6.1. Market Analysis, Insights and Forecast - by Product
- 7. Europe Light Therapy Market Analysis, Insights and Forecast, 2019-2031
- 7.1. Market Analysis, Insights and Forecast - by Product
- 7.1.1. Photosensitizer Drugs
- 7.1.1.1. Aminolevulinic Acid
- 7.1.1.2. Porphyrin Derivatives
- 7.1.1.3. Chlorines
- 7.1.1.4. Others
- 7.1.2. Photodynamic Therapy Devices
- 7.1.2.1. Diode Lasers
- 7.1.2.2. Disposable Fiber Optic Light Delivery Devices
- 7.1.1. Photosensitizer Drugs
- 7.2. Market Analysis, Insights and Forecast - by Applications
- 7.2.1. Cancer
- 7.2.2. Actinic Keratosis
- 7.2.3. Acne
- 7.2.4. Psoriasis
- 7.2.5. Others
- 7.3. Market Analysis, Insights and Forecast - by End-User
- 7.3.1. Hospitals
- 7.3.2. Cosmetic and Dermatology Clinics
- 7.3.3. Others
- 7.1. Market Analysis, Insights and Forecast - by Product
- 8. Asia Pacific Light Therapy Market Analysis, Insights and Forecast, 2019-2031
- 8.1. Market Analysis, Insights and Forecast - by Product
- 8.1.1. Photosensitizer Drugs
- 8.1.1.1. Aminolevulinic Acid
- 8.1.1.2. Porphyrin Derivatives
- 8.1.1.3. Chlorines
- 8.1.1.4. Others
- 8.1.2. Photodynamic Therapy Devices
- 8.1.2.1. Diode Lasers
- 8.1.2.2. Disposable Fiber Optic Light Delivery Devices
- 8.1.1. Photosensitizer Drugs
- 8.2. Market Analysis, Insights and Forecast - by Applications
- 8.2.1. Cancer
- 8.2.2. Actinic Keratosis
- 8.2.3. Acne
- 8.2.4. Psoriasis
- 8.2.5. Others
- 8.3. Market Analysis, Insights and Forecast - by End-User
- 8.3.1. Hospitals
- 8.3.2. Cosmetic and Dermatology Clinics
- 8.3.3. Others
- 8.1. Market Analysis, Insights and Forecast - by Product
- 9. Middle East and Africa Light Therapy Market Analysis, Insights and Forecast, 2019-2031
- 9.1. Market Analysis, Insights and Forecast - by Product
- 9.1.1. Photosensitizer Drugs
- 9.1.1.1. Aminolevulinic Acid
- 9.1.1.2. Porphyrin Derivatives
- 9.1.1.3. Chlorines
- 9.1.1.4. Others
- 9.1.2. Photodynamic Therapy Devices
- 9.1.2.1. Diode Lasers
- 9.1.2.2. Disposable Fiber Optic Light Delivery Devices
- 9.1.1. Photosensitizer Drugs
- 9.2. Market Analysis, Insights and Forecast - by Applications
- 9.2.1. Cancer
- 9.2.2. Actinic Keratosis
- 9.2.3. Acne
- 9.2.4. Psoriasis
- 9.2.5. Others
- 9.3. Market Analysis, Insights and Forecast - by End-User
- 9.3.1. Hospitals
- 9.3.2. Cosmetic and Dermatology Clinics
- 9.3.3. Others
- 9.1. Market Analysis, Insights and Forecast - by Product
- 10. South America Light Therapy Market Analysis, Insights and Forecast, 2019-2031
- 10.1. Market Analysis, Insights and Forecast - by Product
- 10.1.1. Photosensitizer Drugs
- 10.1.1.1. Aminolevulinic Acid
- 10.1.1.2. Porphyrin Derivatives
- 10.1.1.3. Chlorines
- 10.1.1.4. Others
- 10.1.2. Photodynamic Therapy Devices
- 10.1.2.1. Diode Lasers
- 10.1.2.2. Disposable Fiber Optic Light Delivery Devices
- 10.1.1. Photosensitizer Drugs
- 10.2. Market Analysis, Insights and Forecast - by Applications
- 10.2.1. Cancer
- 10.2.2. Actinic Keratosis
- 10.2.3. Acne
- 10.2.4. Psoriasis
- 10.2.5. Others
- 10.3. Market Analysis, Insights and Forecast - by End-User
- 10.3.1. Hospitals
- 10.3.2. Cosmetic and Dermatology Clinics
- 10.3.3. Others
- 10.1. Market Analysis, Insights and Forecast - by Product
- 11. North America Light Therapy Market Analysis, Insights and Forecast, 2019-2031
- 11.1. Market Analysis, Insights and Forecast - By Country/Sub-region
- 11.1.1 United States
- 11.1.2 Canada
- 11.1.3 Mexico
- 12. Europe Light Therapy Market Analysis, Insights and Forecast, 2019-2031
- 12.1. Market Analysis, Insights and Forecast - By Country/Sub-region
- 12.1.1 Germany
- 12.1.2 United Kingdom
- 12.1.3 France
- 12.1.4 Italy
- 12.1.5 Spain
- 12.1.6 Rest of Europe
- 13. Asia Pacific Light Therapy Market Analysis, Insights and Forecast, 2019-2031
- 13.1. Market Analysis, Insights and Forecast - By Country/Sub-region
- 13.1.1 China
- 13.1.2 Japan
- 13.1.3 India
- 13.1.4 Australia
- 13.1.5 South Korea
- 13.1.6 Rest of Asia Pacific
- 14. Middle East and Africa Light Therapy Market Analysis, Insights and Forecast, 2019-2031
- 14.1. Market Analysis, Insights and Forecast - By Country/Sub-region
- 14.1.1 GCC
- 14.1.2 South Africa
- 14.1.3 Rest of Middle East and Africa
- 15. South America Light Therapy Market Analysis, Insights and Forecast, 2019-2031
- 15.1. Market Analysis, Insights and Forecast - By Country/Sub-region
- 15.1.1 Brazil
- 15.1.2 Argentina
- 15.1.3 Rest of South America
- 16. Competitive Analysis
- 16.1. Global Market Share Analysis 2024
- 16.2. Company Profiles
- 16.2.1 biolitec AG
- 16.2.1.1. Overview
- 16.2.1.2. Products
- 16.2.1.3. SWOT Analysis
- 16.2.1.4. Recent Developments
- 16.2.1.5. Financials (Based on Availability)
- 16.2.2 Theralase Technologies Inc *List Not Exhaustive
- 16.2.2.1. Overview
- 16.2.2.2. Products
- 16.2.2.3. SWOT Analysis
- 16.2.2.4. Recent Developments
- 16.2.2.5. Financials (Based on Availability)
- 16.2.3 Soligenix
- 16.2.3.1. Overview
- 16.2.3.2. Products
- 16.2.3.3. SWOT Analysis
- 16.2.3.4. Recent Developments
- 16.2.3.5. Financials (Based on Availability)
- 16.2.4 Lumibird (Quantel Medical)
- 16.2.4.1. Overview
- 16.2.4.2. Products
- 16.2.4.3. SWOT Analysis
- 16.2.4.4. Recent Developments
- 16.2.4.5. Financials (Based on Availability)
- 16.2.5 Biofrontera AG
- 16.2.5.1. Overview
- 16.2.5.2. Products
- 16.2.5.3. SWOT Analysis
- 16.2.5.4. Recent Developments
- 16.2.5.5. Financials (Based on Availability)
- 16.2.6 Galderma S A
- 16.2.6.1. Overview
- 16.2.6.2. Products
- 16.2.6.3. SWOT Analysis
- 16.2.6.4. Recent Developments
- 16.2.6.5. Financials (Based on Availability)
- 16.2.7 Modulight Inc
- 16.2.7.1. Overview
- 16.2.7.2. Products
- 16.2.7.3. SWOT Analysis
- 16.2.7.4. Recent Developments
- 16.2.7.5. Financials (Based on Availability)
- 16.2.8 Sun Pharmaceutical Industries Limited
- 16.2.8.1. Overview
- 16.2.8.2. Products
- 16.2.8.3. SWOT Analysis
- 16.2.8.4. Recent Developments
- 16.2.8.5. Financials (Based on Availability)
- 16.2.9 Bausch Health Companies Inc
- 16.2.9.1. Overview
- 16.2.9.2. Products
- 16.2.9.3. SWOT Analysis
- 16.2.9.4. Recent Developments
- 16.2.9.5. Financials (Based on Availability)
- 16.2.1 biolitec AG
List of Figures
- Figure 1: Global Light Therapy Market Revenue Breakdown (Million, %) by Region 2024 & 2032
- Figure 2: North America Light Therapy Market Revenue (Million), by Country 2024 & 2032
- Figure 3: North America Light Therapy Market Revenue Share (%), by Country 2024 & 2032
- Figure 4: Europe Light Therapy Market Revenue (Million), by Country 2024 & 2032
- Figure 5: Europe Light Therapy Market Revenue Share (%), by Country 2024 & 2032
- Figure 6: Asia Pacific Light Therapy Market Revenue (Million), by Country 2024 & 2032
- Figure 7: Asia Pacific Light Therapy Market Revenue Share (%), by Country 2024 & 2032
- Figure 8: Middle East and Africa Light Therapy Market Revenue (Million), by Country 2024 & 2032
- Figure 9: Middle East and Africa Light Therapy Market Revenue Share (%), by Country 2024 & 2032
- Figure 10: South America Light Therapy Market Revenue (Million), by Country 2024 & 2032
- Figure 11: South America Light Therapy Market Revenue Share (%), by Country 2024 & 2032
- Figure 12: North America Light Therapy Market Revenue (Million), by Product 2024 & 2032
- Figure 13: North America Light Therapy Market Revenue Share (%), by Product 2024 & 2032
- Figure 14: North America Light Therapy Market Revenue (Million), by Applications 2024 & 2032
- Figure 15: North America Light Therapy Market Revenue Share (%), by Applications 2024 & 2032
- Figure 16: North America Light Therapy Market Revenue (Million), by End-User 2024 & 2032
- Figure 17: North America Light Therapy Market Revenue Share (%), by End-User 2024 & 2032
- Figure 18: North America Light Therapy Market Revenue (Million), by Country 2024 & 2032
- Figure 19: North America Light Therapy Market Revenue Share (%), by Country 2024 & 2032
- Figure 20: Europe Light Therapy Market Revenue (Million), by Product 2024 & 2032
- Figure 21: Europe Light Therapy Market Revenue Share (%), by Product 2024 & 2032
- Figure 22: Europe Light Therapy Market Revenue (Million), by Applications 2024 & 2032
- Figure 23: Europe Light Therapy Market Revenue Share (%), by Applications 2024 & 2032
- Figure 24: Europe Light Therapy Market Revenue (Million), by End-User 2024 & 2032
- Figure 25: Europe Light Therapy Market Revenue Share (%), by End-User 2024 & 2032
- Figure 26: Europe Light Therapy Market Revenue (Million), by Country 2024 & 2032
- Figure 27: Europe Light Therapy Market Revenue Share (%), by Country 2024 & 2032
- Figure 28: Asia Pacific Light Therapy Market Revenue (Million), by Product 2024 & 2032
- Figure 29: Asia Pacific Light Therapy Market Revenue Share (%), by Product 2024 & 2032
- Figure 30: Asia Pacific Light Therapy Market Revenue (Million), by Applications 2024 & 2032
- Figure 31: Asia Pacific Light Therapy Market Revenue Share (%), by Applications 2024 & 2032
- Figure 32: Asia Pacific Light Therapy Market Revenue (Million), by End-User 2024 & 2032
- Figure 33: Asia Pacific Light Therapy Market Revenue Share (%), by End-User 2024 & 2032
- Figure 34: Asia Pacific Light Therapy Market Revenue (Million), by Country 2024 & 2032
- Figure 35: Asia Pacific Light Therapy Market Revenue Share (%), by Country 2024 & 2032
- Figure 36: Middle East and Africa Light Therapy Market Revenue (Million), by Product 2024 & 2032
- Figure 37: Middle East and Africa Light Therapy Market Revenue Share (%), by Product 2024 & 2032
- Figure 38: Middle East and Africa Light Therapy Market Revenue (Million), by Applications 2024 & 2032
- Figure 39: Middle East and Africa Light Therapy Market Revenue Share (%), by Applications 2024 & 2032
- Figure 40: Middle East and Africa Light Therapy Market Revenue (Million), by End-User 2024 & 2032
- Figure 41: Middle East and Africa Light Therapy Market Revenue Share (%), by End-User 2024 & 2032
- Figure 42: Middle East and Africa Light Therapy Market Revenue (Million), by Country 2024 & 2032
- Figure 43: Middle East and Africa Light Therapy Market Revenue Share (%), by Country 2024 & 2032
- Figure 44: South America Light Therapy Market Revenue (Million), by Product 2024 & 2032
- Figure 45: South America Light Therapy Market Revenue Share (%), by Product 2024 & 2032
- Figure 46: South America Light Therapy Market Revenue (Million), by Applications 2024 & 2032
- Figure 47: South America Light Therapy Market Revenue Share (%), by Applications 2024 & 2032
- Figure 48: South America Light Therapy Market Revenue (Million), by End-User 2024 & 2032
- Figure 49: South America Light Therapy Market Revenue Share (%), by End-User 2024 & 2032
- Figure 50: South America Light Therapy Market Revenue (Million), by Country 2024 & 2032
- Figure 51: South America Light Therapy Market Revenue Share (%), by Country 2024 & 2032
List of Tables
- Table 1: Global Light Therapy Market Revenue Million Forecast, by Region 2019 & 2032
- Table 2: Global Light Therapy Market Revenue Million Forecast, by Product 2019 & 2032
- Table 3: Global Light Therapy Market Revenue Million Forecast, by Applications 2019 & 2032
- Table 4: Global Light Therapy Market Revenue Million Forecast, by End-User 2019 & 2032
- Table 5: Global Light Therapy Market Revenue Million Forecast, by Region 2019 & 2032
- Table 6: Global Light Therapy Market Revenue Million Forecast, by Country 2019 & 2032
- Table 7: United States Light Therapy Market Revenue (Million) Forecast, by Application 2019 & 2032
- Table 8: Canada Light Therapy Market Revenue (Million) Forecast, by Application 2019 & 2032
- Table 9: Mexico Light Therapy Market Revenue (Million) Forecast, by Application 2019 & 2032
- Table 10: Global Light Therapy Market Revenue Million Forecast, by Country 2019 & 2032
- Table 11: Germany Light Therapy Market Revenue (Million) Forecast, by Application 2019 & 2032
- Table 12: United Kingdom Light Therapy Market Revenue (Million) Forecast, by Application 2019 & 2032
- Table 13: France Light Therapy Market Revenue (Million) Forecast, by Application 2019 & 2032
- Table 14: Italy Light Therapy Market Revenue (Million) Forecast, by Application 2019 & 2032
- Table 15: Spain Light Therapy Market Revenue (Million) Forecast, by Application 2019 & 2032
- Table 16: Rest of Europe Light Therapy Market Revenue (Million) Forecast, by Application 2019 & 2032
- Table 17: Global Light Therapy Market Revenue Million Forecast, by Country 2019 & 2032
- Table 18: China Light Therapy Market Revenue (Million) Forecast, by Application 2019 & 2032
- Table 19: Japan Light Therapy Market Revenue (Million) Forecast, by Application 2019 & 2032
- Table 20: India Light Therapy Market Revenue (Million) Forecast, by Application 2019 & 2032
- Table 21: Australia Light Therapy Market Revenue (Million) Forecast, by Application 2019 & 2032
- Table 22: South Korea Light Therapy Market Revenue (Million) Forecast, by Application 2019 & 2032
- Table 23: Rest of Asia Pacific Light Therapy Market Revenue (Million) Forecast, by Application 2019 & 2032
- Table 24: Global Light Therapy Market Revenue Million Forecast, by Country 2019 & 2032
- Table 25: GCC Light Therapy Market Revenue (Million) Forecast, by Application 2019 & 2032
- Table 26: South Africa Light Therapy Market Revenue (Million) Forecast, by Application 2019 & 2032
- Table 27: Rest of Middle East and Africa Light Therapy Market Revenue (Million) Forecast, by Application 2019 & 2032
- Table 28: Global Light Therapy Market Revenue Million Forecast, by Country 2019 & 2032
- Table 29: Brazil Light Therapy Market Revenue (Million) Forecast, by Application 2019 & 2032
- Table 30: Argentina Light Therapy Market Revenue (Million) Forecast, by Application 2019 & 2032
- Table 31: Rest of South America Light Therapy Market Revenue (Million) Forecast, by Application 2019 & 2032
- Table 32: Global Light Therapy Market Revenue Million Forecast, by Product 2019 & 2032
- Table 33: Global Light Therapy Market Revenue Million Forecast, by Applications 2019 & 2032
- Table 34: Global Light Therapy Market Revenue Million Forecast, by End-User 2019 & 2032
- Table 35: Global Light Therapy Market Revenue Million Forecast, by Country 2019 & 2032
- Table 36: United States Light Therapy Market Revenue (Million) Forecast, by Application 2019 & 2032
- Table 37: Canada Light Therapy Market Revenue (Million) Forecast, by Application 2019 & 2032
- Table 38: Mexico Light Therapy Market Revenue (Million) Forecast, by Application 2019 & 2032
- Table 39: Global Light Therapy Market Revenue Million Forecast, by Product 2019 & 2032
- Table 40: Global Light Therapy Market Revenue Million Forecast, by Applications 2019 & 2032
- Table 41: Global Light Therapy Market Revenue Million Forecast, by End-User 2019 & 2032
- Table 42: Global Light Therapy Market Revenue Million Forecast, by Country 2019 & 2032
- Table 43: Germany Light Therapy Market Revenue (Million) Forecast, by Application 2019 & 2032
- Table 44: United Kingdom Light Therapy Market Revenue (Million) Forecast, by Application 2019 & 2032
- Table 45: France Light Therapy Market Revenue (Million) Forecast, by Application 2019 & 2032
- Table 46: Italy Light Therapy Market Revenue (Million) Forecast, by Application 2019 & 2032
- Table 47: Spain Light Therapy Market Revenue (Million) Forecast, by Application 2019 & 2032
- Table 48: Rest of Europe Light Therapy Market Revenue (Million) Forecast, by Application 2019 & 2032
- Table 49: Global Light Therapy Market Revenue Million Forecast, by Product 2019 & 2032
- Table 50: Global Light Therapy Market Revenue Million Forecast, by Applications 2019 & 2032
- Table 51: Global Light Therapy Market Revenue Million Forecast, by End-User 2019 & 2032
- Table 52: Global Light Therapy Market Revenue Million Forecast, by Country 2019 & 2032
- Table 53: China Light Therapy Market Revenue (Million) Forecast, by Application 2019 & 2032
- Table 54: Japan Light Therapy Market Revenue (Million) Forecast, by Application 2019 & 2032
- Table 55: India Light Therapy Market Revenue (Million) Forecast, by Application 2019 & 2032
- Table 56: Australia Light Therapy Market Revenue (Million) Forecast, by Application 2019 & 2032
- Table 57: South Korea Light Therapy Market Revenue (Million) Forecast, by Application 2019 & 2032
- Table 58: Rest of Asia Pacific Light Therapy Market Revenue (Million) Forecast, by Application 2019 & 2032
- Table 59: Global Light Therapy Market Revenue Million Forecast, by Product 2019 & 2032
- Table 60: Global Light Therapy Market Revenue Million Forecast, by Applications 2019 & 2032
- Table 61: Global Light Therapy Market Revenue Million Forecast, by End-User 2019 & 2032
- Table 62: Global Light Therapy Market Revenue Million Forecast, by Country 2019 & 2032
- Table 63: GCC Light Therapy Market Revenue (Million) Forecast, by Application 2019 & 2032
- Table 64: South Africa Light Therapy Market Revenue (Million) Forecast, by Application 2019 & 2032
- Table 65: Rest of Middle East and Africa Light Therapy Market Revenue (Million) Forecast, by Application 2019 & 2032
- Table 66: Global Light Therapy Market Revenue Million Forecast, by Product 2019 & 2032
- Table 67: Global Light Therapy Market Revenue Million Forecast, by Applications 2019 & 2032
- Table 68: Global Light Therapy Market Revenue Million Forecast, by End-User 2019 & 2032
- Table 69: Global Light Therapy Market Revenue Million Forecast, by Country 2019 & 2032
- Table 70: Brazil Light Therapy Market Revenue (Million) Forecast, by Application 2019 & 2032
- Table 71: Argentina Light Therapy Market Revenue (Million) Forecast, by Application 2019 & 2032
- Table 72: Rest of South America Light Therapy Market Revenue (Million) Forecast, by Application 2019 & 2032
Frequently Asked Questions
1. What is the projected Compound Annual Growth Rate (CAGR) of the Light Therapy Market?
The projected CAGR is approximately 7.50%.
2. Which companies are prominent players in the Light Therapy Market?
Key companies in the market include biolitec AG, Theralase Technologies Inc *List Not Exhaustive, Soligenix, Lumibird (Quantel Medical), Biofrontera AG, Galderma S A, Modulight Inc, Sun Pharmaceutical Industries Limited, Bausch Health Companies Inc.
3. What are the main segments of the Light Therapy Market?
The market segments include Product, Applications, End-User.
4. Can you provide details about the market size?
The market size is estimated to be USD XX Million as of 2022.
5. What are some drivers contributing to market growth?
Growing Prevalence of Cancer Around the World; Advancements in Device Technologies.
6. What are the notable trends driving market growth?
The Photosensitizer Drugs Segment is Expected to Hold a Major Market Share in the Photodynamic Therapy Market.
7. Are there any restraints impacting market growth?
High Cost of Photodynamic Therapy; Risk and Side Effects Associated With The Therapy.
8. Can you provide examples of recent developments in the market?
In August 2022, Asieris Pharmaceuticals announced its multinational Phase III Clinical Trial of Cevira(APRICITY), novel non-surgical treatment of cervical high-grade squamous intraepithelial lesions (HSIL), has completed enrollment. Cevira is a breakthrough photodynamic drug-device combination product, based on the accumulation of a photosensitizer in the target cells
9. What pricing options are available for accessing the report?
Pricing options include single-user, multi-user, and enterprise licenses priced at USD 4750, USD 5250, and USD 8750 respectively.
10. Is the market size provided in terms of value or volume?
The market size is provided in terms of value, measured in Million.
11. Are there any specific market keywords associated with the report?
Yes, the market keyword associated with the report is "Light Therapy Market," which aids in identifying and referencing the specific market segment covered.
12. How do I determine which pricing option suits my needs best?
The pricing options vary based on user requirements and access needs. Individual users may opt for single-user licenses, while businesses requiring broader access may choose multi-user or enterprise licenses for cost-effective access to the report.
13. Are there any additional resources or data provided in the Light Therapy Market report?
While the report offers comprehensive insights, it's advisable to review the specific contents or supplementary materials provided to ascertain if additional resources or data are available.
14. How can I stay updated on further developments or reports in the Light Therapy Market?
To stay informed about further developments, trends, and reports in the Light Therapy Market, consider subscribing to industry newsletters, following relevant companies and organizations, or regularly checking reputable industry news sources and publications.
Methodology
Step 1 - Identification of Relevant Samples Size from Population Database


Step 2 - Approaches for Defining Global Market Size (Value, Volume* & Price*)

Note*: In applicable scenarios
Step 3 - Data Sources
Primary Research
- Web Analytics
- Survey Reports
- Research Institute
- Latest Research Reports
- Opinion Leaders
Secondary Research
- Annual Reports
- White Paper
- Latest Press Release
- Industry Association
- Paid Database
- Investor Presentations

Step 4 - Data Triangulation
Involves using different sources of information in order to increase the validity of a study
These sources are likely to be stakeholders in a program - participants, other researchers, program staff, other community members, and so on.
Then we put all data in single framework & apply various statistical tools to find out the dynamic on the market.
During the analysis stage, feedback from the stakeholder groups would be compared to determine areas of agreement as well as areas of divergence
