

Key Insights
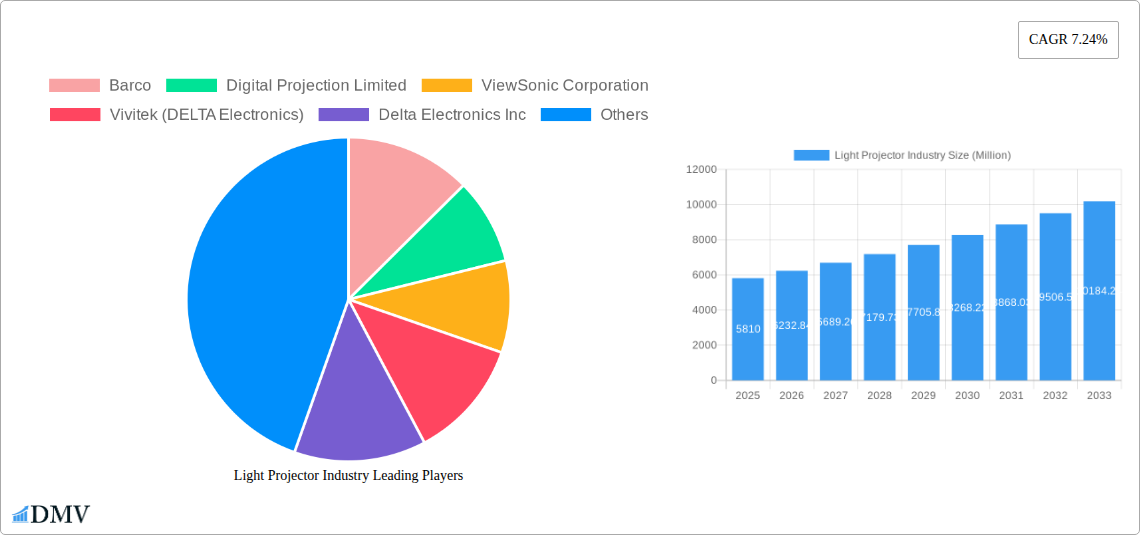
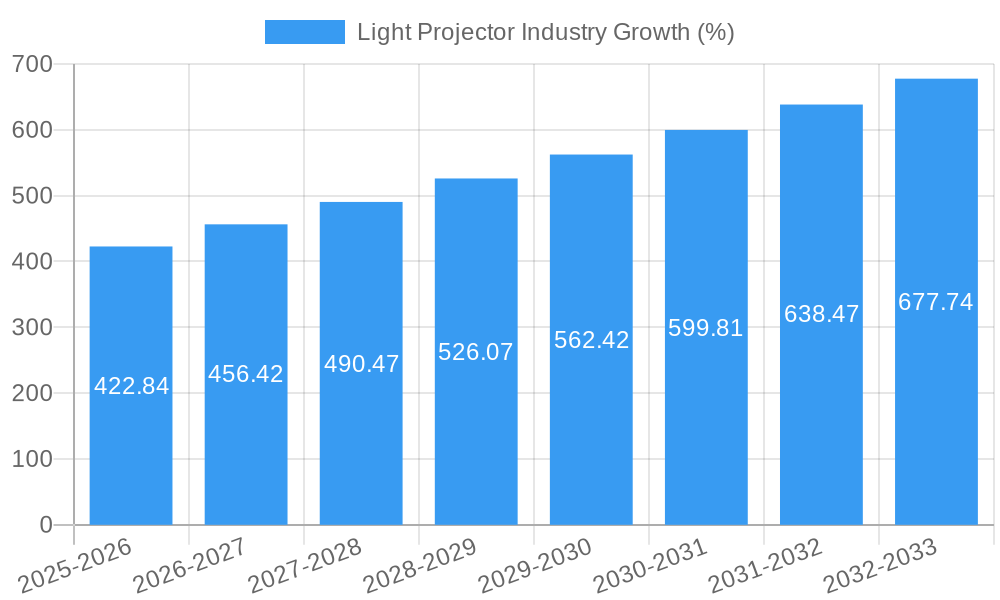
The global light projector market, valued at $5.81 billion in 2025, is projected to experience robust growth, driven by increasing demand across diverse sectors. The Compound Annual Growth Rate (CAGR) of 7.24% from 2025 to 2033 indicates a significant expansion, fueled by several key factors. Technological advancements, particularly in LED and laser light sources, are enhancing projector brightness, resolution, and energy efficiency, making them more appealing for both home and professional use. The rise of home theaters, coupled with the increasing adoption of smart homes and interactive displays, is bolstering the home entertainment segment. Furthermore, the projector market is witnessing a shift towards short-throw and ultra-short-throw projectors, which offer greater flexibility and ease of installation in various settings. Growth in the education and business sectors, driven by the need for interactive presentations and collaborative learning environments, further contributes to market expansion. While certain economic factors may pose temporary restraints, the overall market outlook remains positive, with continued innovation and expanding applications likely to drive sustained growth throughout the forecast period.
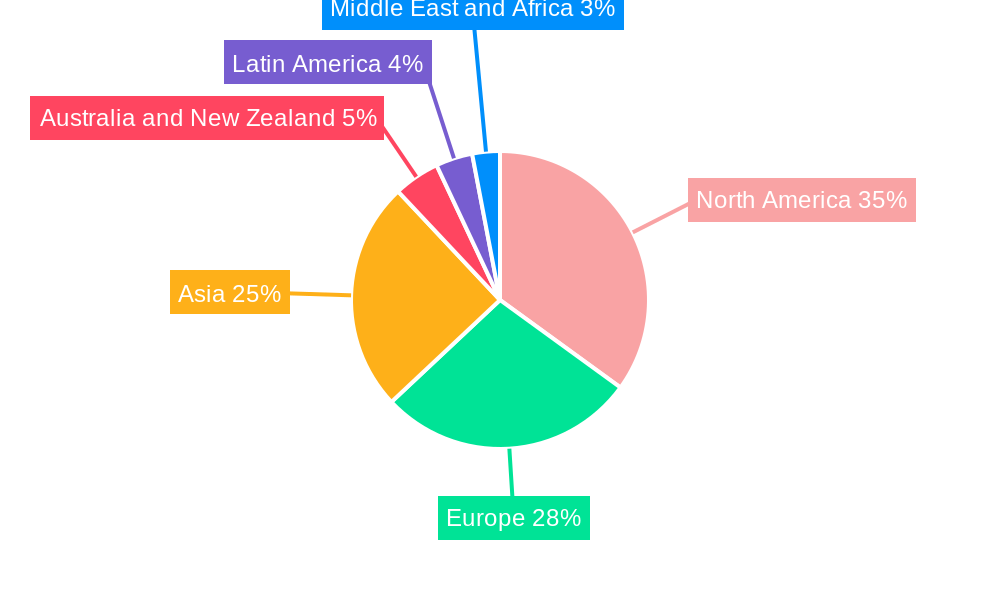
The market segmentation reveals significant opportunities within specific niches. LED projectors are gaining traction due to their cost-effectiveness and energy efficiency, while laser projectors are commanding a premium segment due to their superior brightness and lifespan. The three-chip projector model maintains a strong presence in high-end applications, offering superior color accuracy and performance compared to one-chip models. Short-throw and ultra-short-throw projectors are experiencing rapid adoption, particularly in education and corporate settings, due to their space-saving design and improved user experience. Geographically, North America and Europe are expected to remain key markets, while Asia-Pacific is anticipated to witness the highest growth rate due to rising disposable incomes and increasing demand for advanced technology across various sectors. Competition among established players like Barco, Digital Projection, ViewSonic, and Optoma, alongside emerging players, is driving innovation and fostering competitive pricing, ensuring the market continues its upward trajectory.
Light Projector Industry Market Report: 2019-2033
This comprehensive report provides an in-depth analysis of the global light projector market, projecting a market value exceeding $XX Billion by 2033. It delves into market segmentation, competitive landscape, technological advancements, and future growth opportunities, offering invaluable insights for stakeholders across the value chain. The study period covers 2019-2033, with 2025 serving as the base and estimated year. The report utilizes data from the historical period (2019-2024) to forecast market trends from 2025-2033.
Light Projector Industry Market Composition & Trends
This section evaluates the market's competitive intensity, highlighting innovation drivers, regulatory influences, substitute products, key end-user segments, and merger & acquisition (M&A) activities. The market exhibits a moderately concentrated structure, with key players such as Barco, Digital Projection Limited, and ViewSonic Corporation commanding significant shares. However, numerous smaller players contribute to a dynamic landscape.
- Market Share Distribution (2024): Barco (15%), Digital Projection (8%), ViewSonic (7%), Others (70%). (These are estimated values)
- Innovation Catalysts: Advancements in laser technology, improved chip models (especially three-chip DLP), and the development of ultra-short-throw projectors are key drivers.
- Regulatory Landscape: Varying regional standards and regulations regarding energy efficiency and safety influence product design and market access.
- Substitute Products: Large-screen TVs and digital signage systems pose competitive threats, particularly in the home entertainment segment.
- End-User Profiles: The market caters to diverse segments including home entertainment, business, education, large venues, and government. The business and education sectors are experiencing robust growth.
- M&A Activities (2019-2024): While specific deal values are not publicly available for all transactions, significant M&A activity has been observed within the industry, consolidating market share and fostering innovation. Estimated total M&A deal value for the period exceeds $XX Billion.
Light Projector Industry Industry Evolution
The light projector market has witnessed substantial growth driven by technological breakthroughs and shifting consumer preferences. From 2019 to 2024, the market experienced a Compound Annual Growth Rate (CAGR) of approximately XX%, fueled by increasing demand for high-resolution displays, improved portability, and diverse applications. The adoption of laser light sources is accelerating, replacing traditional lamp-based projectors due to superior brightness, longevity, and energy efficiency. Consumer demand is shifting towards compact, versatile projectors suitable for home theaters and business settings. The transition from one-chip to three-chip DLP systems is also enhancing image quality, driving market growth. Further, increasing adoption of smart features like wireless connectivity and integration with streaming platforms are broadening the appeal of projectors. The forecast period (2025-2033) anticipates a continued CAGR of XX%, driven by the factors mentioned above and the growing penetration of projectors in emerging markets.
Leading Regions, Countries, or Segments in Light Projector Industry
North America and Europe currently dominate the global light projector market, driven by high disposable incomes and strong demand across various applications. However, the Asia-Pacific region is expected to experience the fastest growth in the coming years.
Key Drivers by Segment:
- By Light Source:
- Laser: High brightness, extended lifespan, and improved energy efficiency are driving rapid adoption.
- LED: Cost-effectiveness and energy efficiency make it a popular choice for budget-conscious consumers and businesses.
- Lamp: Despite declining market share, lamp-based projectors maintain a presence in the lower-end market.
- By Chip Model:
- Three-Chip DLP: Superior color accuracy and brightness compared to single-chip models are driving preference in high-end applications.
- One-Chip DLP: Cost-effectiveness maintains its market share in budget-friendly segments.
- By Throw Distance:
- Ultra-Short Throw: Growing popularity in interactive applications and limited space environments fuels this segment's growth.
- Short Throw: Convenience and compact setup are key advantages, driving demand in diverse settings.
- Normal Throw: Maintains a substantial market presence due to its suitability for a broad range of applications.
- By Application:
- Business: Strong demand for presentation tools and collaborative workspaces drives this segment.
- Education: Growing adoption in classrooms and educational institutions fuels consistent growth.
- Home Entertainment: Increasing preference for home theaters and large-screen experiences is driving market expansion.
Light Projector Industry Product Innovations
Recent innovations focus on enhanced brightness, improved resolution (4K and beyond), compact form factors, and advanced features like interactive capabilities and smart connectivity. Manufacturers are incorporating laser light sources, three-chip DLP technology, and ultra-short-throw lens designs to improve image quality, reduce installation complexities, and enhance user experience. Unique selling propositions (USPs) now emphasize portability, ease of setup, and seamless integration with existing smart home ecosystems.
Propelling Factors for Light Projector Industry Growth
Technological advancements, such as laser light sources and improved chip technology, are primary growth drivers. Economic factors, including rising disposable incomes in developing economies, also contribute. Favorable government policies promoting digitalization in education and business further support market expansion. The increasing demand for large-screen displays in various settings, coupled with the falling prices of projectors, also contributes to market growth.
Obstacles in the Light Projector Industry Market
Supply chain disruptions, particularly concerning components like specialized chips and laser diodes, have hampered production and increased prices. Intense competition among established players and emerging brands, as well as the presence of substitute products, exerts downward pressure on pricing. Stringent environmental regulations related to energy consumption and material disposal also pose challenges for manufacturers.
Future Opportunities in Light Projector Industry
Emerging markets in Asia and Africa represent significant growth potential. Advancements in technologies such as holographic projection and augmented reality (AR) integration offer exciting opportunities. The increasing demand for interactive displays in educational and business settings will drive the market towards innovative solutions.
Major Players in the Light Projector Industry Ecosystem
- Barco
- Digital Projection Limited
- ViewSonic Corporation
- Vivitek (DELTA Electronics)
- Delta Electronics Inc
- Acer Inc
- Texas Instruments Inc
- BenQ Corporation
- Panasonic Corporation
- Optoma Corporation (Coretronic Corp)
- NEC Corporation
- Sharp Corporation
Key Developments in Light Projector Industry Industry
- February 2023: Digital Projection International received the TNT (Top New Technologies) award for its HIGHlite 4K UHD Reference Satellite Modular Light Source (MLS) projection system. This highlights the continued innovation within high-end projection technology.
- January 2023: Epson's launch of new projectors and visual solutions for professional displays, education, and business showcases the company's focus on diverse applications and technological advancements, especially in short-throw and laser technologies.
Strategic Light Projector Industry Market Forecast
The light projector market is poised for sustained growth, driven by technological innovation, expanding applications, and increasing demand from emerging markets. The shift towards laser and LED light sources, along with advancements in resolution and interactive capabilities, will continue shaping the market. The projected market value exceeding $XX Billion by 2033 signifies the significant potential for growth and investment in this dynamic industry.
Light Projector Industry Segmentation
-
1. Light Source
- 1.1. Lamp
- 1.2. LED
- 1.3. Laser
-
2. Chip Model
- 2.1. One Chip
- 2.2. Three Chip
-
3. Throw Distance
- 3.1. Normal Throw
- 3.2. Short Throw
- 3.3. Ultra-Short Throw
-
4. Application
- 4.1. Home Entertainment and Cinema
- 4.2. Business
- 4.3. Education and Government
- 4.4. Large Venues
- 4.5. Other Applications
Light Projector Industry Segmentation By Geography
- 1. North America
- 2. Europe
- 3. Asia
- 4. Australia and New Zealand
- 5. Latin America
- 6. Middle East and Africa
Light Projector Industry REPORT HIGHLIGHTS
| Aspects | Details |
|---|---|
| Study Period | 2019-2033 |
| Base Year | 2024 |
| Estimated Year | 2025 |
| Forecast Period | 2025-2033 |
| Historical Period | 2019-2024 |
| Growth Rate | CAGR of 7.24% from 2019-2033 |
| Segmentation |
|
Table of Contents
- 1. Introduction
- 1.1. Research Scope
- 1.2. Market Segmentation
- 1.3. Research Methodology
- 1.4. Definitions and Assumptions
- 2. Executive Summary
- 2.1. Introduction
- 3. Market Dynamics
- 3.1. Introduction
- 3.2. Market Drivers
- 3.2.1. Increment in the Demand of DLP Projector in the Entertainment Industry; Increasing Digitalization Process in the Education Sector
- 3.3. Market Restrains
- 3.3.1 High Cost and Lack of Knowledge; Stiff Competition from Other Projection Technologies such as LCD
- 3.3.2 LCOS
- 3.4. Market Trends
- 3.4.1. Increasing Demand of DLP Projector in the Home Entertainment and Cinema Industry to Drive the Market
- 4. Market Factor Analysis
- 4.1. Porters Five Forces
- 4.2. Supply/Value Chain
- 4.3. PESTEL analysis
- 4.4. Market Entropy
- 4.5. Patent/Trademark Analysis
- 5. Global Light Projector Industry Analysis, Insights and Forecast, 2019-2031
- 5.1. Market Analysis, Insights and Forecast - by Light Source
- 5.1.1. Lamp
- 5.1.2. LED
- 5.1.3. Laser
- 5.2. Market Analysis, Insights and Forecast - by Chip Model
- 5.2.1. One Chip
- 5.2.2. Three Chip
- 5.3. Market Analysis, Insights and Forecast - by Throw Distance
- 5.3.1. Normal Throw
- 5.3.2. Short Throw
- 5.3.3. Ultra-Short Throw
- 5.4. Market Analysis, Insights and Forecast - by Application
- 5.4.1. Home Entertainment and Cinema
- 5.4.2. Business
- 5.4.3. Education and Government
- 5.4.4. Large Venues
- 5.4.5. Other Applications
- 5.5. Market Analysis, Insights and Forecast - by Region
- 5.5.1. North America
- 5.5.2. Europe
- 5.5.3. Asia
- 5.5.4. Australia and New Zealand
- 5.5.5. Latin America
- 5.5.6. Middle East and Africa
- 5.1. Market Analysis, Insights and Forecast - by Light Source
- 6. North America Light Projector Industry Analysis, Insights and Forecast, 2019-2031
- 6.1. Market Analysis, Insights and Forecast - by Light Source
- 6.1.1. Lamp
- 6.1.2. LED
- 6.1.3. Laser
- 6.2. Market Analysis, Insights and Forecast - by Chip Model
- 6.2.1. One Chip
- 6.2.2. Three Chip
- 6.3. Market Analysis, Insights and Forecast - by Throw Distance
- 6.3.1. Normal Throw
- 6.3.2. Short Throw
- 6.3.3. Ultra-Short Throw
- 6.4. Market Analysis, Insights and Forecast - by Application
- 6.4.1. Home Entertainment and Cinema
- 6.4.2. Business
- 6.4.3. Education and Government
- 6.4.4. Large Venues
- 6.4.5. Other Applications
- 6.1. Market Analysis, Insights and Forecast - by Light Source
- 7. Europe Light Projector Industry Analysis, Insights and Forecast, 2019-2031
- 7.1. Market Analysis, Insights and Forecast - by Light Source
- 7.1.1. Lamp
- 7.1.2. LED
- 7.1.3. Laser
- 7.2. Market Analysis, Insights and Forecast - by Chip Model
- 7.2.1. One Chip
- 7.2.2. Three Chip
- 7.3. Market Analysis, Insights and Forecast - by Throw Distance
- 7.3.1. Normal Throw
- 7.3.2. Short Throw
- 7.3.3. Ultra-Short Throw
- 7.4. Market Analysis, Insights and Forecast - by Application
- 7.4.1. Home Entertainment and Cinema
- 7.4.2. Business
- 7.4.3. Education and Government
- 7.4.4. Large Venues
- 7.4.5. Other Applications
- 7.1. Market Analysis, Insights and Forecast - by Light Source
- 8. Asia Light Projector Industry Analysis, Insights and Forecast, 2019-2031
- 8.1. Market Analysis, Insights and Forecast - by Light Source
- 8.1.1. Lamp
- 8.1.2. LED
- 8.1.3. Laser
- 8.2. Market Analysis, Insights and Forecast - by Chip Model
- 8.2.1. One Chip
- 8.2.2. Three Chip
- 8.3. Market Analysis, Insights and Forecast - by Throw Distance
- 8.3.1. Normal Throw
- 8.3.2. Short Throw
- 8.3.3. Ultra-Short Throw
- 8.4. Market Analysis, Insights and Forecast - by Application
- 8.4.1. Home Entertainment and Cinema
- 8.4.2. Business
- 8.4.3. Education and Government
- 8.4.4. Large Venues
- 8.4.5. Other Applications
- 8.1. Market Analysis, Insights and Forecast - by Light Source
- 9. Australia and New Zealand Light Projector Industry Analysis, Insights and Forecast, 2019-2031
- 9.1. Market Analysis, Insights and Forecast - by Light Source
- 9.1.1. Lamp
- 9.1.2. LED
- 9.1.3. Laser
- 9.2. Market Analysis, Insights and Forecast - by Chip Model
- 9.2.1. One Chip
- 9.2.2. Three Chip
- 9.3. Market Analysis, Insights and Forecast - by Throw Distance
- 9.3.1. Normal Throw
- 9.3.2. Short Throw
- 9.3.3. Ultra-Short Throw
- 9.4. Market Analysis, Insights and Forecast - by Application
- 9.4.1. Home Entertainment and Cinema
- 9.4.2. Business
- 9.4.3. Education and Government
- 9.4.4. Large Venues
- 9.4.5. Other Applications
- 9.1. Market Analysis, Insights and Forecast - by Light Source
- 10. Latin America Light Projector Industry Analysis, Insights and Forecast, 2019-2031
- 10.1. Market Analysis, Insights and Forecast - by Light Source
- 10.1.1. Lamp
- 10.1.2. LED
- 10.1.3. Laser
- 10.2. Market Analysis, Insights and Forecast - by Chip Model
- 10.2.1. One Chip
- 10.2.2. Three Chip
- 10.3. Market Analysis, Insights and Forecast - by Throw Distance
- 10.3.1. Normal Throw
- 10.3.2. Short Throw
- 10.3.3. Ultra-Short Throw
- 10.4. Market Analysis, Insights and Forecast - by Application
- 10.4.1. Home Entertainment and Cinema
- 10.4.2. Business
- 10.4.3. Education and Government
- 10.4.4. Large Venues
- 10.4.5. Other Applications
- 10.1. Market Analysis, Insights and Forecast - by Light Source
- 11. Middle East and Africa Light Projector Industry Analysis, Insights and Forecast, 2019-2031
- 11.1. Market Analysis, Insights and Forecast - by Light Source
- 11.1.1. Lamp
- 11.1.2. LED
- 11.1.3. Laser
- 11.2. Market Analysis, Insights and Forecast - by Chip Model
- 11.2.1. One Chip
- 11.2.2. Three Chip
- 11.3. Market Analysis, Insights and Forecast - by Throw Distance
- 11.3.1. Normal Throw
- 11.3.2. Short Throw
- 11.3.3. Ultra-Short Throw
- 11.4. Market Analysis, Insights and Forecast - by Application
- 11.4.1. Home Entertainment and Cinema
- 11.4.2. Business
- 11.4.3. Education and Government
- 11.4.4. Large Venues
- 11.4.5. Other Applications
- 11.1. Market Analysis, Insights and Forecast - by Light Source
- 12. North America Light Projector Industry Analysis, Insights and Forecast, 2019-2031
- 12.1. Market Analysis, Insights and Forecast - By Country/Sub-region
- 12.1.1.
- 13. Europe Light Projector Industry Analysis, Insights and Forecast, 2019-2031
- 13.1. Market Analysis, Insights and Forecast - By Country/Sub-region
- 13.1.1.
- 14. Asia Light Projector Industry Analysis, Insights and Forecast, 2019-2031
- 14.1. Market Analysis, Insights and Forecast - By Country/Sub-region
- 14.1.1.
- 15. Australia and New Zealand Light Projector Industry Analysis, Insights and Forecast, 2019-2031
- 15.1. Market Analysis, Insights and Forecast - By Country/Sub-region
- 15.1.1.
- 16. Latin America Light Projector Industry Analysis, Insights and Forecast, 2019-2031
- 16.1. Market Analysis, Insights and Forecast - By Country/Sub-region
- 16.1.1.
- 17. Middle East and Africa Light Projector Industry Analysis, Insights and Forecast, 2019-2031
- 17.1. Market Analysis, Insights and Forecast - By Country/Sub-region
- 17.1.1.
- 18. Competitive Analysis
- 18.1. Global Market Share Analysis 2024
- 18.2. Company Profiles
- 18.2.1 Barco
- 18.2.1.1. Overview
- 18.2.1.2. Products
- 18.2.1.3. SWOT Analysis
- 18.2.1.4. Recent Developments
- 18.2.1.5. Financials (Based on Availability)
- 18.2.2 Digital Projection Limited
- 18.2.2.1. Overview
- 18.2.2.2. Products
- 18.2.2.3. SWOT Analysis
- 18.2.2.4. Recent Developments
- 18.2.2.5. Financials (Based on Availability)
- 18.2.3 ViewSonic Corporation
- 18.2.3.1. Overview
- 18.2.3.2. Products
- 18.2.3.3. SWOT Analysis
- 18.2.3.4. Recent Developments
- 18.2.3.5. Financials (Based on Availability)
- 18.2.4 Vivitek (DELTA Electronics)
- 18.2.4.1. Overview
- 18.2.4.2. Products
- 18.2.4.3. SWOT Analysis
- 18.2.4.4. Recent Developments
- 18.2.4.5. Financials (Based on Availability)
- 18.2.5 Delta Electronics Inc
- 18.2.5.1. Overview
- 18.2.5.2. Products
- 18.2.5.3. SWOT Analysis
- 18.2.5.4. Recent Developments
- 18.2.5.5. Financials (Based on Availability)
- 18.2.6 Acer Inc
- 18.2.6.1. Overview
- 18.2.6.2. Products
- 18.2.6.3. SWOT Analysis
- 18.2.6.4. Recent Developments
- 18.2.6.5. Financials (Based on Availability)
- 18.2.7 Texas Instruments Inc
- 18.2.7.1. Overview
- 18.2.7.2. Products
- 18.2.7.3. SWOT Analysis
- 18.2.7.4. Recent Developments
- 18.2.7.5. Financials (Based on Availability)
- 18.2.8 BenQ Corporation
- 18.2.8.1. Overview
- 18.2.8.2. Products
- 18.2.8.3. SWOT Analysis
- 18.2.8.4. Recent Developments
- 18.2.8.5. Financials (Based on Availability)
- 18.2.9 Panasonic Corporation*List Not Exhaustive
- 18.2.9.1. Overview
- 18.2.9.2. Products
- 18.2.9.3. SWOT Analysis
- 18.2.9.4. Recent Developments
- 18.2.9.5. Financials (Based on Availability)
- 18.2.10 Optoma Corporation (Coretronic Corp )
- 18.2.10.1. Overview
- 18.2.10.2. Products
- 18.2.10.3. SWOT Analysis
- 18.2.10.4. Recent Developments
- 18.2.10.5. Financials (Based on Availability)
- 18.2.11 NEC Corporation
- 18.2.11.1. Overview
- 18.2.11.2. Products
- 18.2.11.3. SWOT Analysis
- 18.2.11.4. Recent Developments
- 18.2.11.5. Financials (Based on Availability)
- 18.2.12 Sharp Corporation
- 18.2.12.1. Overview
- 18.2.12.2. Products
- 18.2.12.3. SWOT Analysis
- 18.2.12.4. Recent Developments
- 18.2.12.5. Financials (Based on Availability)
- 18.2.1 Barco
List of Figures
- Figure 1: Global Light Projector Industry Revenue Breakdown (Million, %) by Region 2024 & 2032
- Figure 2: North America Light Projector Industry Revenue (Million), by Country 2024 & 2032
- Figure 3: North America Light Projector Industry Revenue Share (%), by Country 2024 & 2032
- Figure 4: Europe Light Projector Industry Revenue (Million), by Country 2024 & 2032
- Figure 5: Europe Light Projector Industry Revenue Share (%), by Country 2024 & 2032
- Figure 6: Asia Light Projector Industry Revenue (Million), by Country 2024 & 2032
- Figure 7: Asia Light Projector Industry Revenue Share (%), by Country 2024 & 2032
- Figure 8: Australia and New Zealand Light Projector Industry Revenue (Million), by Country 2024 & 2032
- Figure 9: Australia and New Zealand Light Projector Industry Revenue Share (%), by Country 2024 & 2032
- Figure 10: Latin America Light Projector Industry Revenue (Million), by Country 2024 & 2032
- Figure 11: Latin America Light Projector Industry Revenue Share (%), by Country 2024 & 2032
- Figure 12: Middle East and Africa Light Projector Industry Revenue (Million), by Country 2024 & 2032
- Figure 13: Middle East and Africa Light Projector Industry Revenue Share (%), by Country 2024 & 2032
- Figure 14: North America Light Projector Industry Revenue (Million), by Light Source 2024 & 2032
- Figure 15: North America Light Projector Industry Revenue Share (%), by Light Source 2024 & 2032
- Figure 16: North America Light Projector Industry Revenue (Million), by Chip Model 2024 & 2032
- Figure 17: North America Light Projector Industry Revenue Share (%), by Chip Model 2024 & 2032
- Figure 18: North America Light Projector Industry Revenue (Million), by Throw Distance 2024 & 2032
- Figure 19: North America Light Projector Industry Revenue Share (%), by Throw Distance 2024 & 2032
- Figure 20: North America Light Projector Industry Revenue (Million), by Application 2024 & 2032
- Figure 21: North America Light Projector Industry Revenue Share (%), by Application 2024 & 2032
- Figure 22: North America Light Projector Industry Revenue (Million), by Country 2024 & 2032
- Figure 23: North America Light Projector Industry Revenue Share (%), by Country 2024 & 2032
- Figure 24: Europe Light Projector Industry Revenue (Million), by Light Source 2024 & 2032
- Figure 25: Europe Light Projector Industry Revenue Share (%), by Light Source 2024 & 2032
- Figure 26: Europe Light Projector Industry Revenue (Million), by Chip Model 2024 & 2032
- Figure 27: Europe Light Projector Industry Revenue Share (%), by Chip Model 2024 & 2032
- Figure 28: Europe Light Projector Industry Revenue (Million), by Throw Distance 2024 & 2032
- Figure 29: Europe Light Projector Industry Revenue Share (%), by Throw Distance 2024 & 2032
- Figure 30: Europe Light Projector Industry Revenue (Million), by Application 2024 & 2032
- Figure 31: Europe Light Projector Industry Revenue Share (%), by Application 2024 & 2032
- Figure 32: Europe Light Projector Industry Revenue (Million), by Country 2024 & 2032
- Figure 33: Europe Light Projector Industry Revenue Share (%), by Country 2024 & 2032
- Figure 34: Asia Light Projector Industry Revenue (Million), by Light Source 2024 & 2032
- Figure 35: Asia Light Projector Industry Revenue Share (%), by Light Source 2024 & 2032
- Figure 36: Asia Light Projector Industry Revenue (Million), by Chip Model 2024 & 2032
- Figure 37: Asia Light Projector Industry Revenue Share (%), by Chip Model 2024 & 2032
- Figure 38: Asia Light Projector Industry Revenue (Million), by Throw Distance 2024 & 2032
- Figure 39: Asia Light Projector Industry Revenue Share (%), by Throw Distance 2024 & 2032
- Figure 40: Asia Light Projector Industry Revenue (Million), by Application 2024 & 2032
- Figure 41: Asia Light Projector Industry Revenue Share (%), by Application 2024 & 2032
- Figure 42: Asia Light Projector Industry Revenue (Million), by Country 2024 & 2032
- Figure 43: Asia Light Projector Industry Revenue Share (%), by Country 2024 & 2032
- Figure 44: Australia and New Zealand Light Projector Industry Revenue (Million), by Light Source 2024 & 2032
- Figure 45: Australia and New Zealand Light Projector Industry Revenue Share (%), by Light Source 2024 & 2032
- Figure 46: Australia and New Zealand Light Projector Industry Revenue (Million), by Chip Model 2024 & 2032
- Figure 47: Australia and New Zealand Light Projector Industry Revenue Share (%), by Chip Model 2024 & 2032
- Figure 48: Australia and New Zealand Light Projector Industry Revenue (Million), by Throw Distance 2024 & 2032
- Figure 49: Australia and New Zealand Light Projector Industry Revenue Share (%), by Throw Distance 2024 & 2032
- Figure 50: Australia and New Zealand Light Projector Industry Revenue (Million), by Application 2024 & 2032
- Figure 51: Australia and New Zealand Light Projector Industry Revenue Share (%), by Application 2024 & 2032
- Figure 52: Australia and New Zealand Light Projector Industry Revenue (Million), by Country 2024 & 2032
- Figure 53: Australia and New Zealand Light Projector Industry Revenue Share (%), by Country 2024 & 2032
- Figure 54: Latin America Light Projector Industry Revenue (Million), by Light Source 2024 & 2032
- Figure 55: Latin America Light Projector Industry Revenue Share (%), by Light Source 2024 & 2032
- Figure 56: Latin America Light Projector Industry Revenue (Million), by Chip Model 2024 & 2032
- Figure 57: Latin America Light Projector Industry Revenue Share (%), by Chip Model 2024 & 2032
- Figure 58: Latin America Light Projector Industry Revenue (Million), by Throw Distance 2024 & 2032
- Figure 59: Latin America Light Projector Industry Revenue Share (%), by Throw Distance 2024 & 2032
- Figure 60: Latin America Light Projector Industry Revenue (Million), by Application 2024 & 2032
- Figure 61: Latin America Light Projector Industry Revenue Share (%), by Application 2024 & 2032
- Figure 62: Latin America Light Projector Industry Revenue (Million), by Country 2024 & 2032
- Figure 63: Latin America Light Projector Industry Revenue Share (%), by Country 2024 & 2032
- Figure 64: Middle East and Africa Light Projector Industry Revenue (Million), by Light Source 2024 & 2032
- Figure 65: Middle East and Africa Light Projector Industry Revenue Share (%), by Light Source 2024 & 2032
- Figure 66: Middle East and Africa Light Projector Industry Revenue (Million), by Chip Model 2024 & 2032
- Figure 67: Middle East and Africa Light Projector Industry Revenue Share (%), by Chip Model 2024 & 2032
- Figure 68: Middle East and Africa Light Projector Industry Revenue (Million), by Throw Distance 2024 & 2032
- Figure 69: Middle East and Africa Light Projector Industry Revenue Share (%), by Throw Distance 2024 & 2032
- Figure 70: Middle East and Africa Light Projector Industry Revenue (Million), by Application 2024 & 2032
- Figure 71: Middle East and Africa Light Projector Industry Revenue Share (%), by Application 2024 & 2032
- Figure 72: Middle East and Africa Light Projector Industry Revenue (Million), by Country 2024 & 2032
- Figure 73: Middle East and Africa Light Projector Industry Revenue Share (%), by Country 2024 & 2032
List of Tables
- Table 1: Global Light Projector Industry Revenue Million Forecast, by Region 2019 & 2032
- Table 2: Global Light Projector Industry Revenue Million Forecast, by Light Source 2019 & 2032
- Table 3: Global Light Projector Industry Revenue Million Forecast, by Chip Model 2019 & 2032
- Table 4: Global Light Projector Industry Revenue Million Forecast, by Throw Distance 2019 & 2032
- Table 5: Global Light Projector Industry Revenue Million Forecast, by Application 2019 & 2032
- Table 6: Global Light Projector Industry Revenue Million Forecast, by Region 2019 & 2032
- Table 7: Global Light Projector Industry Revenue Million Forecast, by Country 2019 & 2032
- Table 8: Light Projector Industry Revenue (Million) Forecast, by Application 2019 & 2032
- Table 9: Global Light Projector Industry Revenue Million Forecast, by Country 2019 & 2032
- Table 10: Light Projector Industry Revenue (Million) Forecast, by Application 2019 & 2032
- Table 11: Global Light Projector Industry Revenue Million Forecast, by Country 2019 & 2032
- Table 12: Light Projector Industry Revenue (Million) Forecast, by Application 2019 & 2032
- Table 13: Global Light Projector Industry Revenue Million Forecast, by Country 2019 & 2032
- Table 14: Light Projector Industry Revenue (Million) Forecast, by Application 2019 & 2032
- Table 15: Global Light Projector Industry Revenue Million Forecast, by Country 2019 & 2032
- Table 16: Light Projector Industry Revenue (Million) Forecast, by Application 2019 & 2032
- Table 17: Global Light Projector Industry Revenue Million Forecast, by Country 2019 & 2032
- Table 18: Light Projector Industry Revenue (Million) Forecast, by Application 2019 & 2032
- Table 19: Global Light Projector Industry Revenue Million Forecast, by Light Source 2019 & 2032
- Table 20: Global Light Projector Industry Revenue Million Forecast, by Chip Model 2019 & 2032
- Table 21: Global Light Projector Industry Revenue Million Forecast, by Throw Distance 2019 & 2032
- Table 22: Global Light Projector Industry Revenue Million Forecast, by Application 2019 & 2032
- Table 23: Global Light Projector Industry Revenue Million Forecast, by Country 2019 & 2032
- Table 24: Global Light Projector Industry Revenue Million Forecast, by Light Source 2019 & 2032
- Table 25: Global Light Projector Industry Revenue Million Forecast, by Chip Model 2019 & 2032
- Table 26: Global Light Projector Industry Revenue Million Forecast, by Throw Distance 2019 & 2032
- Table 27: Global Light Projector Industry Revenue Million Forecast, by Application 2019 & 2032
- Table 28: Global Light Projector Industry Revenue Million Forecast, by Country 2019 & 2032
- Table 29: Global Light Projector Industry Revenue Million Forecast, by Light Source 2019 & 2032
- Table 30: Global Light Projector Industry Revenue Million Forecast, by Chip Model 2019 & 2032
- Table 31: Global Light Projector Industry Revenue Million Forecast, by Throw Distance 2019 & 2032
- Table 32: Global Light Projector Industry Revenue Million Forecast, by Application 2019 & 2032
- Table 33: Global Light Projector Industry Revenue Million Forecast, by Country 2019 & 2032
- Table 34: Global Light Projector Industry Revenue Million Forecast, by Light Source 2019 & 2032
- Table 35: Global Light Projector Industry Revenue Million Forecast, by Chip Model 2019 & 2032
- Table 36: Global Light Projector Industry Revenue Million Forecast, by Throw Distance 2019 & 2032
- Table 37: Global Light Projector Industry Revenue Million Forecast, by Application 2019 & 2032
- Table 38: Global Light Projector Industry Revenue Million Forecast, by Country 2019 & 2032
- Table 39: Global Light Projector Industry Revenue Million Forecast, by Light Source 2019 & 2032
- Table 40: Global Light Projector Industry Revenue Million Forecast, by Chip Model 2019 & 2032
- Table 41: Global Light Projector Industry Revenue Million Forecast, by Throw Distance 2019 & 2032
- Table 42: Global Light Projector Industry Revenue Million Forecast, by Application 2019 & 2032
- Table 43: Global Light Projector Industry Revenue Million Forecast, by Country 2019 & 2032
- Table 44: Global Light Projector Industry Revenue Million Forecast, by Light Source 2019 & 2032
- Table 45: Global Light Projector Industry Revenue Million Forecast, by Chip Model 2019 & 2032
- Table 46: Global Light Projector Industry Revenue Million Forecast, by Throw Distance 2019 & 2032
- Table 47: Global Light Projector Industry Revenue Million Forecast, by Application 2019 & 2032
- Table 48: Global Light Projector Industry Revenue Million Forecast, by Country 2019 & 2032
Frequently Asked Questions
1. What is the projected Compound Annual Growth Rate (CAGR) of the Light Projector Industry?
The projected CAGR is approximately 7.24%.
2. Which companies are prominent players in the Light Projector Industry?
Key companies in the market include Barco, Digital Projection Limited, ViewSonic Corporation, Vivitek (DELTA Electronics), Delta Electronics Inc, Acer Inc, Texas Instruments Inc, BenQ Corporation, Panasonic Corporation*List Not Exhaustive, Optoma Corporation (Coretronic Corp ), NEC Corporation, Sharp Corporation.
3. What are the main segments of the Light Projector Industry?
The market segments include Light Source, Chip Model, Throw Distance, Application.
4. Can you provide details about the market size?
The market size is estimated to be USD 5.81 Million as of 2022.
5. What are some drivers contributing to market growth?
Increment in the Demand of DLP Projector in the Entertainment Industry; Increasing Digitalization Process in the Education Sector.
6. What are the notable trends driving market growth?
Increasing Demand of DLP Projector in the Home Entertainment and Cinema Industry to Drive the Market.
7. Are there any restraints impacting market growth?
High Cost and Lack of Knowledge; Stiff Competition from Other Projection Technologies such as LCD. LCOS.
8. Can you provide examples of recent developments in the market?
February 2023 - Digital Projection International received the coveted TNT (Top New Technologies) award from CE Pro magazine for its HIGHlite 4K UHD Reference Satellite Modular Light Source (MLS) projection system.
9. What pricing options are available for accessing the report?
Pricing options include single-user, multi-user, and enterprise licenses priced at USD 4750, USD 5250, and USD 8750 respectively.
10. Is the market size provided in terms of value or volume?
The market size is provided in terms of value, measured in Million.
11. Are there any specific market keywords associated with the report?
Yes, the market keyword associated with the report is "Light Projector Industry," which aids in identifying and referencing the specific market segment covered.
12. How do I determine which pricing option suits my needs best?
The pricing options vary based on user requirements and access needs. Individual users may opt for single-user licenses, while businesses requiring broader access may choose multi-user or enterprise licenses for cost-effective access to the report.
13. Are there any additional resources or data provided in the Light Projector Industry report?
While the report offers comprehensive insights, it's advisable to review the specific contents or supplementary materials provided to ascertain if additional resources or data are available.
14. How can I stay updated on further developments or reports in the Light Projector Industry?
To stay informed about further developments, trends, and reports in the Light Projector Industry, consider subscribing to industry newsletters, following relevant companies and organizations, or regularly checking reputable industry news sources and publications.
Methodology
Step 1 - Identification of Relevant Samples Size from Population Database


Step 2 - Approaches for Defining Global Market Size (Value, Volume* & Price*)

Note*: In applicable scenarios
Step 3 - Data Sources
Primary Research
- Web Analytics
- Survey Reports
- Research Institute
- Latest Research Reports
- Opinion Leaders
Secondary Research
- Annual Reports
- White Paper
- Latest Press Release
- Industry Association
- Paid Database
- Investor Presentations

Step 4 - Data Triangulation
Involves using different sources of information in order to increase the validity of a study
These sources are likely to be stakeholders in a program - participants, other researchers, program staff, other community members, and so on.
Then we put all data in single framework & apply various statistical tools to find out the dynamic on the market.
During the analysis stage, feedback from the stakeholder groups would be compared to determine areas of agreement as well as areas of divergence
