

Key Insights
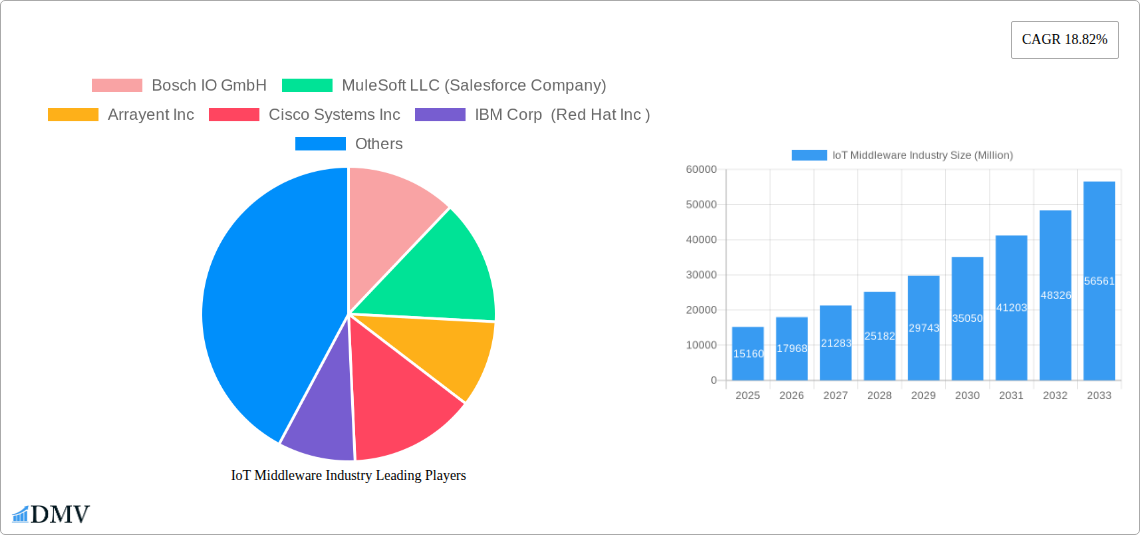
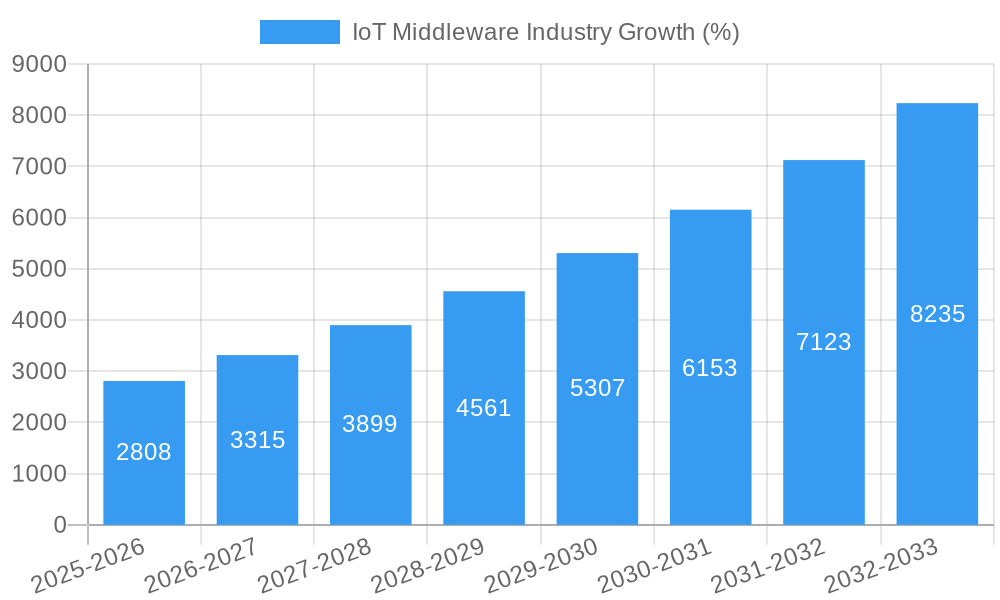
The IoT Middleware market, valued at $15.16 billion in 2025, is projected to experience robust growth, exhibiting a Compound Annual Growth Rate (CAGR) of 18.82% from 2025 to 2033. This expansion is driven by the increasing adoption of IoT devices across diverse sectors, including manufacturing, healthcare, and energy and utilities. The need for seamless connectivity, efficient device management, and robust application enablement is fueling demand for middleware solutions that bridge the gap between disparate IoT components. Key trends shaping this market include the rise of edge computing, which enables faster data processing and reduces latency, the increasing adoption of cloud-based platforms for scalability and cost-effectiveness, and a growing focus on security protocols to protect sensitive IoT data. While challenges such as data privacy concerns and the complexity of integrating various systems exist, the overall market trajectory remains positive, driven by continuous innovation in middleware technologies and the expanding scope of IoT applications. The segmentation by platform (Application Enablement, Device Management, Connectivity Management) and end-user industry (Manufacturing, Healthcare, Energy and Utilities, Transportation and Logistics, Agriculture) reflects the diverse application of this crucial technology. Leading companies like Bosch IO GmbH, MuleSoft, and Cisco Systems are actively competing in this dynamic landscape, constantly developing and improving their offerings to meet the ever-evolving demands of the IoT ecosystem.
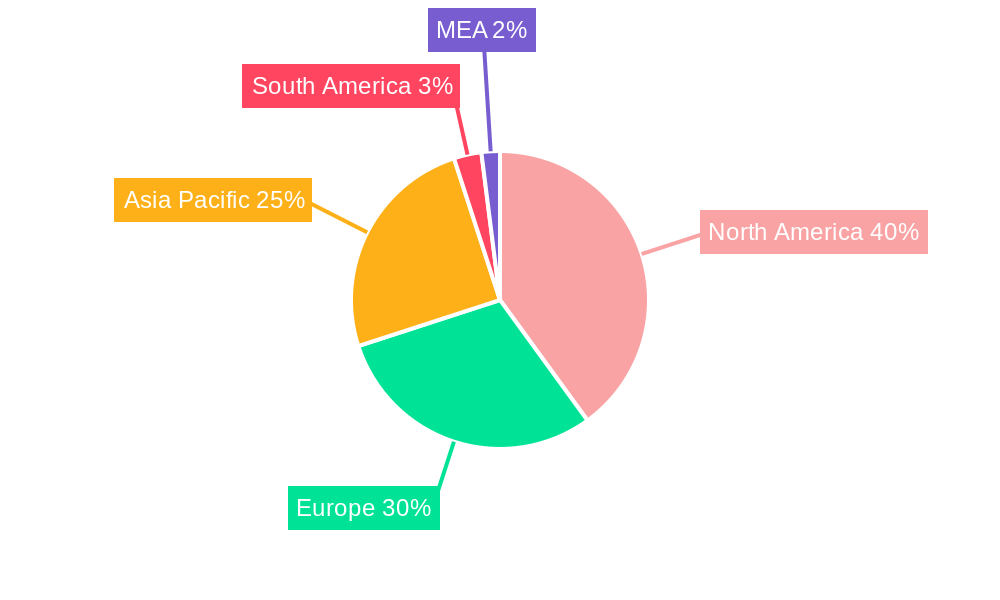
The North American region currently holds a significant market share due to the early adoption of IoT technologies and a well-established technological infrastructure. However, Asia-Pacific is expected to witness rapid growth in the coming years fueled by increasing digitalization initiatives and substantial investments in IoT infrastructure development across countries like China and India. Europe also maintains a substantial market presence, driven by strong government support for digital transformation and the presence of major technology players. The competitive landscape is characterized by a mix of established technology providers and emerging startups, indicating significant ongoing innovation and competition within the market. This blend of factors points to a sustained and substantial period of growth for the IoT Middleware market throughout the forecast period.
IoT Middleware Industry Market Report: 2019-2033
This comprehensive report provides an in-depth analysis of the IoT Middleware market, projecting a market value of $XX Million by 2033. It covers market composition, technological advancements, key players, and future opportunities, offering invaluable insights for stakeholders seeking to navigate this rapidly evolving landscape. The study period spans 2019-2033, with 2025 as the base and estimated year. The forecast period covers 2025-2033, and the historical period is 2019-2024.
IoT Middleware Industry Market Composition & Trends
The IoT Middleware market is characterized by a moderately concentrated landscape, with several major players holding significant market share. The market share distribution in 2025 is estimated as follows: Amazon Web Services Inc. (XX%), IBM Corp (Red Hat Inc) (XX%), MuleSoft LLC (Salesforce Company) (XX%), and others (XX%). Innovation is driven by the need for enhanced security, interoperability, and scalability across diverse IoT deployments. Stringent data privacy regulations, particularly GDPR and CCPA, significantly influence market dynamics. Substitute products, such as custom-built solutions, exist, but their cost and complexity often favor the use of established middleware platforms. End-users span various industries, with Manufacturing, Healthcare, and Energy & Utilities sectors demonstrating particularly robust adoption. M&A activity has been moderate, with deal values averaging $XX Million in recent years. Key M&A events impacting the market included:
- Strategic acquisitions aimed at expanding platform capabilities and market reach.
- Consolidation among smaller players, driven by competitive pressures.
IoT Middleware Industry Industry Evolution
The IoT Middleware market has witnessed substantial growth since 2019, driven by the proliferation of connected devices and the increasing demand for efficient data management and application enablement in diverse sectors. The Compound Annual Growth Rate (CAGR) from 2019 to 2024 was approximately XX%, and is projected to be XX% from 2025 to 2033, reaching $XX Million by 2033. This growth is fueled by technological advancements such as the adoption of cloud-native architectures, AI-powered analytics, and edge computing capabilities within middleware platforms. Consumer demand is shifting towards solutions that offer enhanced security, simplified integration, and improved scalability. Adoption metrics show an increase in the number of enterprises integrating IoT middleware into their operational workflows, particularly in sectors like manufacturing and logistics where real-time data insights are critical. The emergence of 5G and advancements in low-power wide-area networks (LPWAN) further enhance the capabilities and appeal of IoT middleware.
Leading Regions, Countries, or Segments in IoT Middleware Industry
North America currently dominates the IoT Middleware market, driven by high technology adoption rates, robust investments in digital transformation, and the presence of major technology companies. However, significant growth potential lies in Asia-Pacific regions due to rapid industrialization and increasing government initiatives for smart city development.
Key Drivers:
- By Platform:
- Application Enablement: High demand for scalable, flexible platforms enabling the rapid development of IoT applications.
- Device Management: Crucial for managing large-scale deployments and ensuring seamless device connectivity and operation.
- Connectivity Management: Essential for secure and reliable communication across heterogeneous networks.
- By End-user Industry:
- Manufacturing: The implementation of smart factories and Industry 4.0 initiatives drives substantial demand.
- Healthcare: Remote patient monitoring and connected medical devices are fueling growth.
- Energy & Utilities: Smart grids and asset management are significant growth catalysts.
- Transportation & Logistics: Real-time tracking, fleet management, and supply chain optimization.
- Agriculture: Precision agriculture and smart farming practices are gaining adoption.
The dominance of North America stems from factors such as early adoption of IoT technologies, high levels of technological expertise, substantial investment in R&D, and the presence of major market players, while Asia-Pacific’s growth is linked to increasing infrastructure investments and government support for IoT initiatives.
IoT Middleware Industry Product Innovations
Recent innovations in IoT middleware focus on enhanced security, AI-driven analytics, and edge computing capabilities. Many platforms now integrate advanced security features such as encryption, authentication, and access control to protect sensitive data. Integration of AI and machine learning algorithms enables real-time insights and predictive analytics. Edge computing capabilities are increasingly incorporated to reduce latency and bandwidth requirements. Unique selling propositions often include ease of integration with existing systems, support for various communication protocols, and scalability to accommodate growing IoT deployments.
Propelling Factors for IoT Middleware Growth
The IoT Middleware market is propelled by several factors. Technological advancements, such as the rise of 5G and edge computing, are expanding the capabilities and applications of IoT. Economically, the increasing ROI associated with IoT deployments fuels investment in middleware solutions. Favorable regulatory landscapes, while presenting challenges, also incentivize adoption by mandating data security and interoperability standards. For example, initiatives promoting smart city development in many regions are boosting demand for scalable IoT platforms.
Obstacles in the IoT Middleware Industry Market
Significant barriers include the complexity of integrating diverse IoT devices and platforms, ensuring data security across various networks, and managing the cost of implementation and maintenance. Supply chain disruptions can impact the availability of components and increase deployment costs. Intense competition among vendors necessitates continuous innovation and differentiation to maintain market share. These factors can collectively reduce market growth by an estimated XX% annually.
Future Opportunities in IoT Middleware Industry
Future opportunities include the integration of blockchain technology for enhanced security and transparency, the expansion into new vertical markets like smart homes and wearables, and the development of solutions tailored to specific industry requirements such as healthcare and manufacturing. Advancements in low-power wide-area networks (LPWAN) technology will further enable the deployment of large-scale IoT solutions in various sectors.
Major Players in the IoT Middleware Industry Ecosystem
- Bosch IO GmbH
- MuleSoft LLC (Salesforce Company)
- Arrayent Inc
- Cisco Systems Inc
- IBM Corp (Red Hat Inc)
- ClearBlade Inc
- Amazon Web Services Inc
- PTC Inc
- Axiros GmbH
- Oracle Corporation
- Davra Networks
Key Developments in IoT Middleware Industry
- March 2023: UnaBiz and LORIOT partnered to offer comprehensive IoT solutions with flexible protocol choices.
- May 2022: STMicroelectronics and Microsoft collaborated to enhance IoT application security using STM32U5 microcontrollers and Azure RTOS.
Strategic IoT Middleware Industry Market Forecast
The IoT Middleware market is poised for sustained growth, driven by increasing IoT adoption across various industries. New technologies, such as AI and edge computing, will further enhance platform capabilities, creating opportunities for market expansion. The focus on security and data privacy will continue to shape market dynamics, with vendors investing in robust security solutions and adhering to evolving regulatory standards. The overall market outlook is positive, with a projected CAGR of XX% from 2025 to 2033, leading to a significant increase in market size and value.
IoT Middleware Industry Segmentation
-
1. Platform
- 1.1. Application Enablement
- 1.2. Device Management
- 1.3. Connectivity Management
-
2. End-user Industry
- 2.1. Manufacturing
- 2.2. Healthcare
- 2.3. Energy and Utilities
- 2.4. Transportation and Logistics
- 2.5. Agriculture
- 2.6. Other End-user Industries
IoT Middleware Industry Segmentation By Geography
- 1. North America
- 2. Europe
- 3. Asia
- 4. Australia and New Zealand
- 5. Latin America
- 6. Middle East and Africa
IoT Middleware Industry REPORT HIGHLIGHTS
| Aspects | Details |
|---|---|
| Study Period | 2019-2033 |
| Base Year | 2024 |
| Estimated Year | 2025 |
| Forecast Period | 2025-2033 |
| Historical Period | 2019-2024 |
| Growth Rate | CAGR of 18.82% from 2019-2033 |
| Segmentation |
|
Table of Contents
- 1. Introduction
- 1.1. Research Scope
- 1.2. Market Segmentation
- 1.3. Research Methodology
- 1.4. Definitions and Assumptions
- 2. Executive Summary
- 2.1. Introduction
- 3. Market Dynamics
- 3.1. Introduction
- 3.2. Market Drivers
- 3.2.1. Developments Across Open-source Platforms; Increasing M2M Communications
- 3.3. Market Restrains
- 3.3.1. Complex Technologies Pertaining to the Development of IoT Middleware
- 3.4. Market Trends
- 3.4.1. Manufacturing Expected to Have the High Potential Growth
- 4. Market Factor Analysis
- 4.1. Porters Five Forces
- 4.2. Supply/Value Chain
- 4.3. PESTEL analysis
- 4.4. Market Entropy
- 4.5. Patent/Trademark Analysis
- 5. Global IoT Middleware Industry Analysis, Insights and Forecast, 2019-2031
- 5.1. Market Analysis, Insights and Forecast - by Platform
- 5.1.1. Application Enablement
- 5.1.2. Device Management
- 5.1.3. Connectivity Management
- 5.2. Market Analysis, Insights and Forecast - by End-user Industry
- 5.2.1. Manufacturing
- 5.2.2. Healthcare
- 5.2.3. Energy and Utilities
- 5.2.4. Transportation and Logistics
- 5.2.5. Agriculture
- 5.2.6. Other End-user Industries
- 5.3. Market Analysis, Insights and Forecast - by Region
- 5.3.1. North America
- 5.3.2. Europe
- 5.3.3. Asia
- 5.3.4. Australia and New Zealand
- 5.3.5. Latin America
- 5.3.6. Middle East and Africa
- 5.1. Market Analysis, Insights and Forecast - by Platform
- 6. North America IoT Middleware Industry Analysis, Insights and Forecast, 2019-2031
- 6.1. Market Analysis, Insights and Forecast - by Platform
- 6.1.1. Application Enablement
- 6.1.2. Device Management
- 6.1.3. Connectivity Management
- 6.2. Market Analysis, Insights and Forecast - by End-user Industry
- 6.2.1. Manufacturing
- 6.2.2. Healthcare
- 6.2.3. Energy and Utilities
- 6.2.4. Transportation and Logistics
- 6.2.5. Agriculture
- 6.2.6. Other End-user Industries
- 6.1. Market Analysis, Insights and Forecast - by Platform
- 7. Europe IoT Middleware Industry Analysis, Insights and Forecast, 2019-2031
- 7.1. Market Analysis, Insights and Forecast - by Platform
- 7.1.1. Application Enablement
- 7.1.2. Device Management
- 7.1.3. Connectivity Management
- 7.2. Market Analysis, Insights and Forecast - by End-user Industry
- 7.2.1. Manufacturing
- 7.2.2. Healthcare
- 7.2.3. Energy and Utilities
- 7.2.4. Transportation and Logistics
- 7.2.5. Agriculture
- 7.2.6. Other End-user Industries
- 7.1. Market Analysis, Insights and Forecast - by Platform
- 8. Asia IoT Middleware Industry Analysis, Insights and Forecast, 2019-2031
- 8.1. Market Analysis, Insights and Forecast - by Platform
- 8.1.1. Application Enablement
- 8.1.2. Device Management
- 8.1.3. Connectivity Management
- 8.2. Market Analysis, Insights and Forecast - by End-user Industry
- 8.2.1. Manufacturing
- 8.2.2. Healthcare
- 8.2.3. Energy and Utilities
- 8.2.4. Transportation and Logistics
- 8.2.5. Agriculture
- 8.2.6. Other End-user Industries
- 8.1. Market Analysis, Insights and Forecast - by Platform
- 9. Australia and New Zealand IoT Middleware Industry Analysis, Insights and Forecast, 2019-2031
- 9.1. Market Analysis, Insights and Forecast - by Platform
- 9.1.1. Application Enablement
- 9.1.2. Device Management
- 9.1.3. Connectivity Management
- 9.2. Market Analysis, Insights and Forecast - by End-user Industry
- 9.2.1. Manufacturing
- 9.2.2. Healthcare
- 9.2.3. Energy and Utilities
- 9.2.4. Transportation and Logistics
- 9.2.5. Agriculture
- 9.2.6. Other End-user Industries
- 9.1. Market Analysis, Insights and Forecast - by Platform
- 10. Latin America IoT Middleware Industry Analysis, Insights and Forecast, 2019-2031
- 10.1. Market Analysis, Insights and Forecast - by Platform
- 10.1.1. Application Enablement
- 10.1.2. Device Management
- 10.1.3. Connectivity Management
- 10.2. Market Analysis, Insights and Forecast - by End-user Industry
- 10.2.1. Manufacturing
- 10.2.2. Healthcare
- 10.2.3. Energy and Utilities
- 10.2.4. Transportation and Logistics
- 10.2.5. Agriculture
- 10.2.6. Other End-user Industries
- 10.1. Market Analysis, Insights and Forecast - by Platform
- 11. Middle East and Africa IoT Middleware Industry Analysis, Insights and Forecast, 2019-2031
- 11.1. Market Analysis, Insights and Forecast - by Platform
- 11.1.1. Application Enablement
- 11.1.2. Device Management
- 11.1.3. Connectivity Management
- 11.2. Market Analysis, Insights and Forecast - by End-user Industry
- 11.2.1. Manufacturing
- 11.2.2. Healthcare
- 11.2.3. Energy and Utilities
- 11.2.4. Transportation and Logistics
- 11.2.5. Agriculture
- 11.2.6. Other End-user Industries
- 11.1. Market Analysis, Insights and Forecast - by Platform
- 12. North America IoT Middleware Industry Analysis, Insights and Forecast, 2019-2031
- 12.1. Market Analysis, Insights and Forecast - By Country/Sub-region
- 12.1.1 United States
- 12.1.2 Canada
- 12.1.3 Mexico
- 13. Europe IoT Middleware Industry Analysis, Insights and Forecast, 2019-2031
- 13.1. Market Analysis, Insights and Forecast - By Country/Sub-region
- 13.1.1 Germany
- 13.1.2 United Kingdom
- 13.1.3 France
- 13.1.4 Spain
- 13.1.5 Italy
- 13.1.6 Spain
- 13.1.7 Belgium
- 13.1.8 Netherland
- 13.1.9 Nordics
- 13.1.10 Rest of Europe
- 14. Asia Pacific IoT Middleware Industry Analysis, Insights and Forecast, 2019-2031
- 14.1. Market Analysis, Insights and Forecast - By Country/Sub-region
- 14.1.1 China
- 14.1.2 Japan
- 14.1.3 India
- 14.1.4 South Korea
- 14.1.5 Southeast Asia
- 14.1.6 Australia
- 14.1.7 Indonesia
- 14.1.8 Phillipes
- 14.1.9 Singapore
- 14.1.10 Thailandc
- 14.1.11 Rest of Asia Pacific
- 15. South America IoT Middleware Industry Analysis, Insights and Forecast, 2019-2031
- 15.1. Market Analysis, Insights and Forecast - By Country/Sub-region
- 15.1.1 Brazil
- 15.1.2 Argentina
- 15.1.3 Peru
- 15.1.4 Chile
- 15.1.5 Colombia
- 15.1.6 Ecuador
- 15.1.7 Venezuela
- 15.1.8 Rest of South America
- 16. North America IoT Middleware Industry Analysis, Insights and Forecast, 2019-2031
- 16.1. Market Analysis, Insights and Forecast - By Country/Sub-region
- 16.1.1 United States
- 16.1.2 Canada
- 16.1.3 Mexico
- 17. MEA IoT Middleware Industry Analysis, Insights and Forecast, 2019-2031
- 17.1. Market Analysis, Insights and Forecast - By Country/Sub-region
- 17.1.1 United Arab Emirates
- 17.1.2 Saudi Arabia
- 17.1.3 South Africa
- 17.1.4 Rest of Middle East and Africa
- 18. Competitive Analysis
- 18.1. Global Market Share Analysis 2024
- 18.2. Company Profiles
- 18.2.1 Bosch IO GmbH
- 18.2.1.1. Overview
- 18.2.1.2. Products
- 18.2.1.3. SWOT Analysis
- 18.2.1.4. Recent Developments
- 18.2.1.5. Financials (Based on Availability)
- 18.2.2 MuleSoft LLC (Salesforce Company)
- 18.2.2.1. Overview
- 18.2.2.2. Products
- 18.2.2.3. SWOT Analysis
- 18.2.2.4. Recent Developments
- 18.2.2.5. Financials (Based on Availability)
- 18.2.3 Arrayent Inc
- 18.2.3.1. Overview
- 18.2.3.2. Products
- 18.2.3.3. SWOT Analysis
- 18.2.3.4. Recent Developments
- 18.2.3.5. Financials (Based on Availability)
- 18.2.4 Cisco Systems Inc
- 18.2.4.1. Overview
- 18.2.4.2. Products
- 18.2.4.3. SWOT Analysis
- 18.2.4.4. Recent Developments
- 18.2.4.5. Financials (Based on Availability)
- 18.2.5 IBM Corp (Red Hat Inc )
- 18.2.5.1. Overview
- 18.2.5.2. Products
- 18.2.5.3. SWOT Analysis
- 18.2.5.4. Recent Developments
- 18.2.5.5. Financials (Based on Availability)
- 18.2.6 ClearBlade Inc
- 18.2.6.1. Overview
- 18.2.6.2. Products
- 18.2.6.3. SWOT Analysis
- 18.2.6.4. Recent Developments
- 18.2.6.5. Financials (Based on Availability)
- 18.2.7 Amazon Web Services Inc
- 18.2.7.1. Overview
- 18.2.7.2. Products
- 18.2.7.3. SWOT Analysis
- 18.2.7.4. Recent Developments
- 18.2.7.5. Financials (Based on Availability)
- 18.2.8 PTC Inc
- 18.2.8.1. Overview
- 18.2.8.2. Products
- 18.2.8.3. SWOT Analysis
- 18.2.8.4. Recent Developments
- 18.2.8.5. Financials (Based on Availability)
- 18.2.9 Axiros GmbH
- 18.2.9.1. Overview
- 18.2.9.2. Products
- 18.2.9.3. SWOT Analysis
- 18.2.9.4. Recent Developments
- 18.2.9.5. Financials (Based on Availability)
- 18.2.10 Oracle Corporation
- 18.2.10.1. Overview
- 18.2.10.2. Products
- 18.2.10.3. SWOT Analysis
- 18.2.10.4. Recent Developments
- 18.2.10.5. Financials (Based on Availability)
- 18.2.11 Davra Networks
- 18.2.11.1. Overview
- 18.2.11.2. Products
- 18.2.11.3. SWOT Analysis
- 18.2.11.4. Recent Developments
- 18.2.11.5. Financials (Based on Availability)
- 18.2.1 Bosch IO GmbH
List of Figures
- Figure 1: Global IoT Middleware Industry Revenue Breakdown (Million, %) by Region 2024 & 2032
- Figure 2: North America IoT Middleware Industry Revenue (Million), by Country 2024 & 2032
- Figure 3: North America IoT Middleware Industry Revenue Share (%), by Country 2024 & 2032
- Figure 4: Europe IoT Middleware Industry Revenue (Million), by Country 2024 & 2032
- Figure 5: Europe IoT Middleware Industry Revenue Share (%), by Country 2024 & 2032
- Figure 6: Asia Pacific IoT Middleware Industry Revenue (Million), by Country 2024 & 2032
- Figure 7: Asia Pacific IoT Middleware Industry Revenue Share (%), by Country 2024 & 2032
- Figure 8: South America IoT Middleware Industry Revenue (Million), by Country 2024 & 2032
- Figure 9: South America IoT Middleware Industry Revenue Share (%), by Country 2024 & 2032
- Figure 10: North America IoT Middleware Industry Revenue (Million), by Country 2024 & 2032
- Figure 11: North America IoT Middleware Industry Revenue Share (%), by Country 2024 & 2032
- Figure 12: MEA IoT Middleware Industry Revenue (Million), by Country 2024 & 2032
- Figure 13: MEA IoT Middleware Industry Revenue Share (%), by Country 2024 & 2032
- Figure 14: North America IoT Middleware Industry Revenue (Million), by Platform 2024 & 2032
- Figure 15: North America IoT Middleware Industry Revenue Share (%), by Platform 2024 & 2032
- Figure 16: North America IoT Middleware Industry Revenue (Million), by End-user Industry 2024 & 2032
- Figure 17: North America IoT Middleware Industry Revenue Share (%), by End-user Industry 2024 & 2032
- Figure 18: North America IoT Middleware Industry Revenue (Million), by Country 2024 & 2032
- Figure 19: North America IoT Middleware Industry Revenue Share (%), by Country 2024 & 2032
- Figure 20: Europe IoT Middleware Industry Revenue (Million), by Platform 2024 & 2032
- Figure 21: Europe IoT Middleware Industry Revenue Share (%), by Platform 2024 & 2032
- Figure 22: Europe IoT Middleware Industry Revenue (Million), by End-user Industry 2024 & 2032
- Figure 23: Europe IoT Middleware Industry Revenue Share (%), by End-user Industry 2024 & 2032
- Figure 24: Europe IoT Middleware Industry Revenue (Million), by Country 2024 & 2032
- Figure 25: Europe IoT Middleware Industry Revenue Share (%), by Country 2024 & 2032
- Figure 26: Asia IoT Middleware Industry Revenue (Million), by Platform 2024 & 2032
- Figure 27: Asia IoT Middleware Industry Revenue Share (%), by Platform 2024 & 2032
- Figure 28: Asia IoT Middleware Industry Revenue (Million), by End-user Industry 2024 & 2032
- Figure 29: Asia IoT Middleware Industry Revenue Share (%), by End-user Industry 2024 & 2032
- Figure 30: Asia IoT Middleware Industry Revenue (Million), by Country 2024 & 2032
- Figure 31: Asia IoT Middleware Industry Revenue Share (%), by Country 2024 & 2032
- Figure 32: Australia and New Zealand IoT Middleware Industry Revenue (Million), by Platform 2024 & 2032
- Figure 33: Australia and New Zealand IoT Middleware Industry Revenue Share (%), by Platform 2024 & 2032
- Figure 34: Australia and New Zealand IoT Middleware Industry Revenue (Million), by End-user Industry 2024 & 2032
- Figure 35: Australia and New Zealand IoT Middleware Industry Revenue Share (%), by End-user Industry 2024 & 2032
- Figure 36: Australia and New Zealand IoT Middleware Industry Revenue (Million), by Country 2024 & 2032
- Figure 37: Australia and New Zealand IoT Middleware Industry Revenue Share (%), by Country 2024 & 2032
- Figure 38: Latin America IoT Middleware Industry Revenue (Million), by Platform 2024 & 2032
- Figure 39: Latin America IoT Middleware Industry Revenue Share (%), by Platform 2024 & 2032
- Figure 40: Latin America IoT Middleware Industry Revenue (Million), by End-user Industry 2024 & 2032
- Figure 41: Latin America IoT Middleware Industry Revenue Share (%), by End-user Industry 2024 & 2032
- Figure 42: Latin America IoT Middleware Industry Revenue (Million), by Country 2024 & 2032
- Figure 43: Latin America IoT Middleware Industry Revenue Share (%), by Country 2024 & 2032
- Figure 44: Middle East and Africa IoT Middleware Industry Revenue (Million), by Platform 2024 & 2032
- Figure 45: Middle East and Africa IoT Middleware Industry Revenue Share (%), by Platform 2024 & 2032
- Figure 46: Middle East and Africa IoT Middleware Industry Revenue (Million), by End-user Industry 2024 & 2032
- Figure 47: Middle East and Africa IoT Middleware Industry Revenue Share (%), by End-user Industry 2024 & 2032
- Figure 48: Middle East and Africa IoT Middleware Industry Revenue (Million), by Country 2024 & 2032
- Figure 49: Middle East and Africa IoT Middleware Industry Revenue Share (%), by Country 2024 & 2032
List of Tables
- Table 1: Global IoT Middleware Industry Revenue Million Forecast, by Region 2019 & 2032
- Table 2: Global IoT Middleware Industry Revenue Million Forecast, by Platform 2019 & 2032
- Table 3: Global IoT Middleware Industry Revenue Million Forecast, by End-user Industry 2019 & 2032
- Table 4: Global IoT Middleware Industry Revenue Million Forecast, by Region 2019 & 2032
- Table 5: Global IoT Middleware Industry Revenue Million Forecast, by Country 2019 & 2032
- Table 6: United States IoT Middleware Industry Revenue (Million) Forecast, by Application 2019 & 2032
- Table 7: Canada IoT Middleware Industry Revenue (Million) Forecast, by Application 2019 & 2032
- Table 8: Mexico IoT Middleware Industry Revenue (Million) Forecast, by Application 2019 & 2032
- Table 9: Global IoT Middleware Industry Revenue Million Forecast, by Country 2019 & 2032
- Table 10: Germany IoT Middleware Industry Revenue (Million) Forecast, by Application 2019 & 2032
- Table 11: United Kingdom IoT Middleware Industry Revenue (Million) Forecast, by Application 2019 & 2032
- Table 12: France IoT Middleware Industry Revenue (Million) Forecast, by Application 2019 & 2032
- Table 13: Spain IoT Middleware Industry Revenue (Million) Forecast, by Application 2019 & 2032
- Table 14: Italy IoT Middleware Industry Revenue (Million) Forecast, by Application 2019 & 2032
- Table 15: Spain IoT Middleware Industry Revenue (Million) Forecast, by Application 2019 & 2032
- Table 16: Belgium IoT Middleware Industry Revenue (Million) Forecast, by Application 2019 & 2032
- Table 17: Netherland IoT Middleware Industry Revenue (Million) Forecast, by Application 2019 & 2032
- Table 18: Nordics IoT Middleware Industry Revenue (Million) Forecast, by Application 2019 & 2032
- Table 19: Rest of Europe IoT Middleware Industry Revenue (Million) Forecast, by Application 2019 & 2032
- Table 20: Global IoT Middleware Industry Revenue Million Forecast, by Country 2019 & 2032
- Table 21: China IoT Middleware Industry Revenue (Million) Forecast, by Application 2019 & 2032
- Table 22: Japan IoT Middleware Industry Revenue (Million) Forecast, by Application 2019 & 2032
- Table 23: India IoT Middleware Industry Revenue (Million) Forecast, by Application 2019 & 2032
- Table 24: South Korea IoT Middleware Industry Revenue (Million) Forecast, by Application 2019 & 2032
- Table 25: Southeast Asia IoT Middleware Industry Revenue (Million) Forecast, by Application 2019 & 2032
- Table 26: Australia IoT Middleware Industry Revenue (Million) Forecast, by Application 2019 & 2032
- Table 27: Indonesia IoT Middleware Industry Revenue (Million) Forecast, by Application 2019 & 2032
- Table 28: Phillipes IoT Middleware Industry Revenue (Million) Forecast, by Application 2019 & 2032
- Table 29: Singapore IoT Middleware Industry Revenue (Million) Forecast, by Application 2019 & 2032
- Table 30: Thailandc IoT Middleware Industry Revenue (Million) Forecast, by Application 2019 & 2032
- Table 31: Rest of Asia Pacific IoT Middleware Industry Revenue (Million) Forecast, by Application 2019 & 2032
- Table 32: Global IoT Middleware Industry Revenue Million Forecast, by Country 2019 & 2032
- Table 33: Brazil IoT Middleware Industry Revenue (Million) Forecast, by Application 2019 & 2032
- Table 34: Argentina IoT Middleware Industry Revenue (Million) Forecast, by Application 2019 & 2032
- Table 35: Peru IoT Middleware Industry Revenue (Million) Forecast, by Application 2019 & 2032
- Table 36: Chile IoT Middleware Industry Revenue (Million) Forecast, by Application 2019 & 2032
- Table 37: Colombia IoT Middleware Industry Revenue (Million) Forecast, by Application 2019 & 2032
- Table 38: Ecuador IoT Middleware Industry Revenue (Million) Forecast, by Application 2019 & 2032
- Table 39: Venezuela IoT Middleware Industry Revenue (Million) Forecast, by Application 2019 & 2032
- Table 40: Rest of South America IoT Middleware Industry Revenue (Million) Forecast, by Application 2019 & 2032
- Table 41: Global IoT Middleware Industry Revenue Million Forecast, by Country 2019 & 2032
- Table 42: United States IoT Middleware Industry Revenue (Million) Forecast, by Application 2019 & 2032
- Table 43: Canada IoT Middleware Industry Revenue (Million) Forecast, by Application 2019 & 2032
- Table 44: Mexico IoT Middleware Industry Revenue (Million) Forecast, by Application 2019 & 2032
- Table 45: Global IoT Middleware Industry Revenue Million Forecast, by Country 2019 & 2032
- Table 46: United Arab Emirates IoT Middleware Industry Revenue (Million) Forecast, by Application 2019 & 2032
- Table 47: Saudi Arabia IoT Middleware Industry Revenue (Million) Forecast, by Application 2019 & 2032
- Table 48: South Africa IoT Middleware Industry Revenue (Million) Forecast, by Application 2019 & 2032
- Table 49: Rest of Middle East and Africa IoT Middleware Industry Revenue (Million) Forecast, by Application 2019 & 2032
- Table 50: Global IoT Middleware Industry Revenue Million Forecast, by Platform 2019 & 2032
- Table 51: Global IoT Middleware Industry Revenue Million Forecast, by End-user Industry 2019 & 2032
- Table 52: Global IoT Middleware Industry Revenue Million Forecast, by Country 2019 & 2032
- Table 53: Global IoT Middleware Industry Revenue Million Forecast, by Platform 2019 & 2032
- Table 54: Global IoT Middleware Industry Revenue Million Forecast, by End-user Industry 2019 & 2032
- Table 55: Global IoT Middleware Industry Revenue Million Forecast, by Country 2019 & 2032
- Table 56: Global IoT Middleware Industry Revenue Million Forecast, by Platform 2019 & 2032
- Table 57: Global IoT Middleware Industry Revenue Million Forecast, by End-user Industry 2019 & 2032
- Table 58: Global IoT Middleware Industry Revenue Million Forecast, by Country 2019 & 2032
- Table 59: Global IoT Middleware Industry Revenue Million Forecast, by Platform 2019 & 2032
- Table 60: Global IoT Middleware Industry Revenue Million Forecast, by End-user Industry 2019 & 2032
- Table 61: Global IoT Middleware Industry Revenue Million Forecast, by Country 2019 & 2032
- Table 62: Global IoT Middleware Industry Revenue Million Forecast, by Platform 2019 & 2032
- Table 63: Global IoT Middleware Industry Revenue Million Forecast, by End-user Industry 2019 & 2032
- Table 64: Global IoT Middleware Industry Revenue Million Forecast, by Country 2019 & 2032
- Table 65: Global IoT Middleware Industry Revenue Million Forecast, by Platform 2019 & 2032
- Table 66: Global IoT Middleware Industry Revenue Million Forecast, by End-user Industry 2019 & 2032
- Table 67: Global IoT Middleware Industry Revenue Million Forecast, by Country 2019 & 2032
Frequently Asked Questions
1. What is the projected Compound Annual Growth Rate (CAGR) of the IoT Middleware Industry?
The projected CAGR is approximately 18.82%.
2. Which companies are prominent players in the IoT Middleware Industry?
Key companies in the market include Bosch IO GmbH, MuleSoft LLC (Salesforce Company), Arrayent Inc, Cisco Systems Inc, IBM Corp (Red Hat Inc ), ClearBlade Inc, Amazon Web Services Inc, PTC Inc, Axiros GmbH, Oracle Corporation, Davra Networks.
3. What are the main segments of the IoT Middleware Industry?
The market segments include Platform, End-user Industry.
4. Can you provide details about the market size?
The market size is estimated to be USD 15.16 Million as of 2022.
5. What are some drivers contributing to market growth?
Developments Across Open-source Platforms; Increasing M2M Communications.
6. What are the notable trends driving market growth?
Manufacturing Expected to Have the High Potential Growth.
7. Are there any restraints impacting market growth?
Complex Technologies Pertaining to the Development of IoT Middleware.
8. Can you provide examples of recent developments in the market?
March 2023: UnaBiz, an IoT Service Provider and Integrator company, and LORIOT, a global Swiss-based IoT company specializing in long-range connectivity and network management, partnered to empower clients to deploy extensive IoT solutions, offering them the flexibility to choose from multiple protocols tailored to their specific use cases. This collaboration involves the integration of LORIOT's hybrid Network Management System, Hummingbird, with UnaBiz's middleware IoT data management platform, UnaConnect, to develop a comprehensive catalog of various products and services.
9. What pricing options are available for accessing the report?
Pricing options include single-user, multi-user, and enterprise licenses priced at USD 4750, USD 5250, and USD 8750 respectively.
10. Is the market size provided in terms of value or volume?
The market size is provided in terms of value, measured in Million.
11. Are there any specific market keywords associated with the report?
Yes, the market keyword associated with the report is "IoT Middleware Industry," which aids in identifying and referencing the specific market segment covered.
12. How do I determine which pricing option suits my needs best?
The pricing options vary based on user requirements and access needs. Individual users may opt for single-user licenses, while businesses requiring broader access may choose multi-user or enterprise licenses for cost-effective access to the report.
13. Are there any additional resources or data provided in the IoT Middleware Industry report?
While the report offers comprehensive insights, it's advisable to review the specific contents or supplementary materials provided to ascertain if additional resources or data are available.
14. How can I stay updated on further developments or reports in the IoT Middleware Industry?
To stay informed about further developments, trends, and reports in the IoT Middleware Industry, consider subscribing to industry newsletters, following relevant companies and organizations, or regularly checking reputable industry news sources and publications.
Methodology
Step 1 - Identification of Relevant Samples Size from Population Database


Step 2 - Approaches for Defining Global Market Size (Value, Volume* & Price*)

Note*: In applicable scenarios
Step 3 - Data Sources
Primary Research
- Web Analytics
- Survey Reports
- Research Institute
- Latest Research Reports
- Opinion Leaders
Secondary Research
- Annual Reports
- White Paper
- Latest Press Release
- Industry Association
- Paid Database
- Investor Presentations

Step 4 - Data Triangulation
Involves using different sources of information in order to increase the validity of a study
These sources are likely to be stakeholders in a program - participants, other researchers, program staff, other community members, and so on.
Then we put all data in single framework & apply various statistical tools to find out the dynamic on the market.
During the analysis stage, feedback from the stakeholder groups would be compared to determine areas of agreement as well as areas of divergence
