

Key Insights
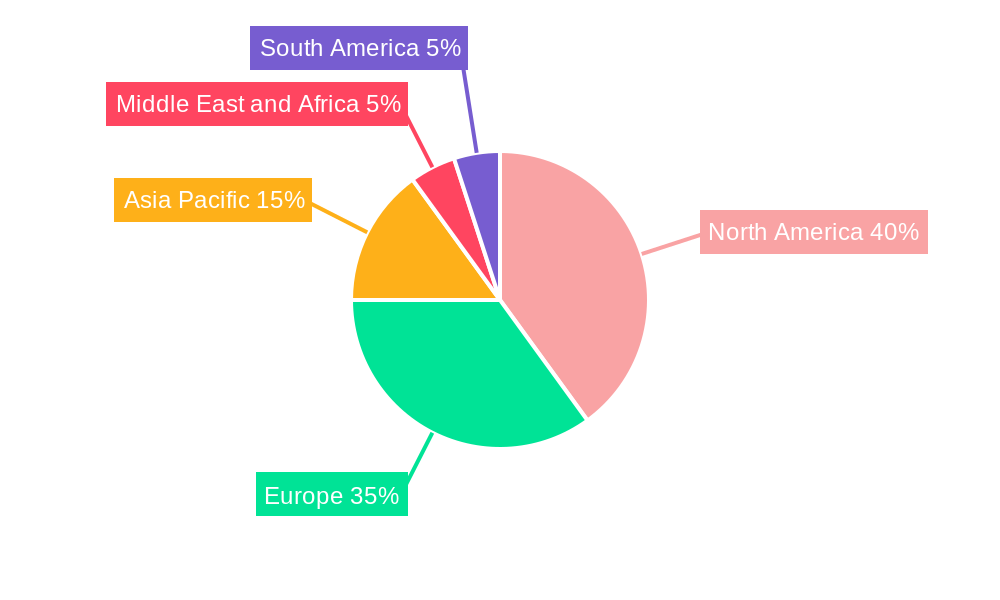
The intraoral scanner market, valued at $710.70 million in 2025, is projected to experience steady growth, driven by several key factors. The increasing adoption of digital dentistry, a shift towards minimally invasive procedures, and the rising demand for improved accuracy and efficiency in dental practices are significant contributors to market expansion. Technological advancements leading to smaller, more portable, and user-friendly scanners are also fueling market growth. The segmentation reveals a strong demand for both standalone and portable scanners across dental clinics and hospitals, with the dental clinic segment likely holding a larger market share due to the higher volume of procedures. Competition is robust, with established players like Medit Corp, Planmeca Oy, and 3Shape A/S competing alongside emerging companies. Geographic distribution shows a strong presence in North America and Europe, reflecting established dental infrastructure and higher adoption rates of advanced technologies. However, growth potential exists in developing regions such as the Middle East and Africa, and South America, driven by rising disposable incomes and improved healthcare infrastructure.
Looking ahead to 2033, the market is expected to continue its growth trajectory, albeit at a moderate pace, reflecting a mature market with incremental technological advancements. The continued expansion of dental tourism and the increasing awareness among patients about the benefits of digital dentistry are expected to drive further growth. Factors such as high initial investment costs for scanners and the need for specialized training could act as restraints, but are likely to be offset by the long-term cost savings and efficiency gains associated with intraoral scanning technology. Further market segmentation analysis would reveal the precise market share for each modality and end-user segment. Market strategies by key players will likely focus on innovation, improved integration with other dental technologies, and expansion into emerging markets.

Intraoral Scanners Industry Market Composition & Trends
The Intraoral Scanners Industry has shown a dynamic evolution over the study period of 2019-2033, with a notable concentration among leading companies such as Medit Corp, Planmeca Oy, and 3Shape A/S. The market's competitive landscape is characterized by a blend of innovation catalysts and regulatory landscapes shaping the industry. Key innovation drivers include advancements in 3D imaging technologies and AI integration, which have propelled the development of more efficient and user-friendly scanners. Regulatory frameworks, particularly in regions like the EU and North America, have influenced product standards and market entry.
End-user profiles reveal a predominant use in dental clinics, which hold a significant market share due to the increasing adoption of digital dentistry. Hospitals and other end users follow, with varying degrees of penetration influenced by investment in technology and infrastructure. The market has witnessed several M&A activities, with a total deal value reaching approximately 1.5 Billion in the past five years. These mergers and acquisitions have aimed at consolidating market positions and expanding technological portfolios.
- Market Share Distribution: Medit Corp and 3Shape A/S together hold around 40% of the market, showcasing a high concentration at the top.
- M&A Activities: Notable deals include the acquisition of BLZ Dental by Dentsply Sirona Inc for 300 Million in 2022.
- Regulatory Landscape: FDA clearances and CE markings are crucial for market entry and expansion.
- Substitute Products: Traditional impression materials still pose a challenge, but their use is declining at a rate of 5% annually.

Intraoral Scanners Industry Industry Evolution
The evolution of the Intraoral Scanners Industry has been marked by significant growth trajectories and technological advancements. From 2019 to 2024, the industry experienced a compound annual growth rate (CAGR) of 12%, driven by the shift towards digital dentistry and the need for more precise and efficient dental care solutions. Technological advancements such as the integration of artificial intelligence (AI) and machine learning (ML) have enhanced the functionality of intraoral scanners, improving accuracy and reducing scan times. These innovations have led to an increase in adoption rates, with dental clinics showing a 20% rise in the utilization of intraoral scanners over the last five years.
Consumer demands have shifted towards more personalized and efficient dental care, prompting manufacturers to focus on developing portable and user-friendly devices. The introduction of standalone and portable modalities has catered to these needs, with portable scanners gaining popularity due to their flexibility and ease of use. The market's growth is expected to continue, with a projected CAGR of 15% from 2025 to 2033, fueled by ongoing technological innovations and increasing investments in dental health infrastructure.
Leading Regions, Countries, or Segments in Intraoral Scanners Industry
North America stands out as the dominant region in the Intraoral Scanners Industry, driven by a robust healthcare infrastructure and high investment in dental technology. Within North America, the United States leads with a market share of approximately 60%, attributed to the presence of key market players and a strong emphasis on digital dentistry.
- Key Drivers:
- Investment Trends: Increased funding in healthcare technology, with over 2 Billion invested in dental tech in 2022.
- Regulatory Support: Stringent yet supportive regulations that encourage technological advancements and patient safety.
The dominance of North America can be attributed to several factors, including a high adoption rate of advanced dental technologies and a well-established network of dental clinics and hospitals. The segment of standalone scanners has seen significant growth, particularly in dental clinics, due to their reliability and precision. Portable scanners, on the other hand, are gaining traction in regions with less developed healthcare infrastructure, as they offer a cost-effective and flexible solution.
In terms of end users, dental clinics remain the leading segment, with a market share of 70%. This is driven by the increasing number of dental practices adopting digital solutions to enhance patient care and operational efficiency. Hospitals and other end users, such as academic institutions, are also significant, with hospitals accounting for around 20% of the market. The growth in these segments is supported by the integration of intraoral scanners into broader dental and medical systems, facilitating better patient outcomes and workflow efficiencies.
Intraoral Scanners Industry Product Innovations
Recent product innovations in the Intraoral Scanners Industry have focused on enhancing user experience and improving diagnostic accuracy. The integration of AI and machine learning has allowed for real-time analysis and more precise dental impressions. The development of smaller, more portable scanners has catered to the growing demand for flexibility and convenience in dental practices. Unique selling propositions include faster scan times, higher resolution imaging, and seamless integration with existing dental software systems, which have significantly improved the efficiency and effectiveness of dental care.
Propelling Factors for Intraoral Scanners Industry Growth
Several factors are driving the growth of the Intraoral Scanners Industry. Technological advancements, such as the integration of AI and 3D imaging, have enhanced the functionality and accuracy of scanners. Economically, increased healthcare spending and investment in dental technology, particularly in North America and Europe, have fueled market expansion. Regulatory influences, such as FDA clearances and CE markings, have facilitated market entry and product adoption. These factors collectively contribute to the industry's robust growth trajectory.
Obstacles in the Intraoral Scanners Industry Market
The Intraoral Scanners Industry faces several challenges that could impede growth. Regulatory hurdles, including stringent approval processes, can delay product launches and market entry. Supply chain disruptions, exacerbated by global events, have affected the availability and cost of components. Competitive pressures from both established players and new entrants have led to price wars and reduced profit margins. These obstacles have a quantifiable impact, with regulatory delays costing companies an estimated 10% of potential market share annually.
Future Opportunities in Intraoral Scanners Industry
Emerging opportunities in the Intraoral Scanners Industry include the expansion into new markets, such as Asia-Pacific, where dental health awareness is growing. Technological advancements, like the integration of augmented reality (AR) for enhanced patient education and treatment planning, present new avenues for growth. Additionally, shifting consumer trends towards personalized and preventive dental care are driving demand for innovative solutions, offering significant potential for market expansion.
Major Players in the Intraoral Scanners Industry Ecosystem
- Medit Corp
- Planmeca Oy
- 3Shape A/S
- BLZ Dental
- Guangdong Launca Medical Device Technology Co Ltd
- Densys Ltd
- Condor Technologies NV
- Dentsply Sirona Inc
- Align Technology Inc
- Institut Straumann AG
Key Developments in Intraoral Scanners Industry Industry
- March 2023: Freqty Technology, a Chinese high-tech enterprise in the field of digital dentistry, launched the latest and smallest PANDA intra-oral scanner, the PANDA Smart, at the International Dental Show (IDS) in Germany. This launch has significantly impacted the market by introducing a compact and advanced scanning solution, appealing to dental professionals seeking portable and efficient tools.
- March 2023: GC launched new solutions during the recent 40th International Dental Show (IDS) in Cologne, Germany. The new Aadva IOS 200 intra-oral scanner, equipped with 4DR technology, has enhanced the market dynamics by offering improved imaging and diagnostic capabilities, attracting interest from both dental clinics and hospitals.
Strategic Intraoral Scanners Industry Market Forecast
The Intraoral Scanners Industry is poised for significant growth from 2025 to 2033, driven by ongoing technological innovations and increasing demand for digital dental solutions. Future opportunities include expanding into emerging markets, integrating advanced technologies like AR and AI, and catering to the trend towards personalized and preventive care. The market's potential is underscored by the projected CAGR of 15%, reflecting a robust outlook for the industry's future.
Intraoral Scanners Industry Segmentation
-
1. Modality
- 1.1. Standalone
- 1.2. Portable
-
2. End User
- 2.1. Dental Clinics
- 2.2. Hospitals
- 2.3. Other End Users
Intraoral Scanners Industry Segmentation By Geography
-
1. North America
- 1.1. United States
- 1.2. Canada
- 1.3. Mexico
-
2. Europe
- 2.1. Germany
- 2.2. United Kingdom
- 2.3. France
- 2.4. Italy
- 2.5. Spain
- 2.6. Rest of Europe
-
3. Asia Pacific
- 3.1. China
- 3.2. Japan
- 3.3. India
- 3.4. Australia
- 3.5. South Korea
- 3.6. Rest of Asia Pacific
-
4. Middle East and Africa
- 4.1. GCC
- 4.2. South Africa
- 4.3. Rest of Middle East and Africa
-
5. South America
- 5.1. Brazil
- 5.2. Argentina
- 5.3. Rest of South America
Intraoral Scanners Industry REPORT HIGHLIGHTS
| Aspects | Details |
|---|---|
| Study Period | 2019-2033 |
| Base Year | 2024 |
| Estimated Year | 2025 |
| Forecast Period | 2025-2033 |
| Historical Period | 2019-2024 |
| Growth Rate | CAGR of 2.51% from 2019-2033 |
| Segmentation |
|
Table of Contents
- 1. Introduction
- 1.1. Research Scope
- 1.2. Market Segmentation
- 1.3. Research Methodology
- 1.4. Definitions and Assumptions
- 2. Executive Summary
- 2.1. Introduction
- 3. Market Dynamics
- 3.1. Introduction
- 3.2. Market Drivers
- 3.2.1. Rapid Technological Advancements; Increase in Geriatric Population; Rise in Dental Disorders
- 3.3. Market Restrains
- 3.3.1. Lack of Skilled Professionals; High Cost of Intraoral Scanners
- 3.4. Market Trends
- 3.4.1. Standalone Devices Segment is Expected to Witness Strong Growth in The Coming Years
- 4. Market Factor Analysis
- 4.1. Porters Five Forces
- 4.2. Supply/Value Chain
- 4.3. PESTEL analysis
- 4.4. Market Entropy
- 4.5. Patent/Trademark Analysis
- 5. Global Intraoral Scanners Industry Analysis, Insights and Forecast, 2019-2031
- 5.1. Market Analysis, Insights and Forecast - by Modality
- 5.1.1. Standalone
- 5.1.2. Portable
- 5.2. Market Analysis, Insights and Forecast - by End User
- 5.2.1. Dental Clinics
- 5.2.2. Hospitals
- 5.2.3. Other End Users
- 5.3. Market Analysis, Insights and Forecast - by Region
- 5.3.1. North America
- 5.3.2. Europe
- 5.3.3. Asia Pacific
- 5.3.4. Middle East and Africa
- 5.3.5. South America
- 5.1. Market Analysis, Insights and Forecast - by Modality
- 6. North America Intraoral Scanners Industry Analysis, Insights and Forecast, 2019-2031
- 6.1. Market Analysis, Insights and Forecast - by Modality
- 6.1.1. Standalone
- 6.1.2. Portable
- 6.2. Market Analysis, Insights and Forecast - by End User
- 6.2.1. Dental Clinics
- 6.2.2. Hospitals
- 6.2.3. Other End Users
- 6.1. Market Analysis, Insights and Forecast - by Modality
- 7. Europe Intraoral Scanners Industry Analysis, Insights and Forecast, 2019-2031
- 7.1. Market Analysis, Insights and Forecast - by Modality
- 7.1.1. Standalone
- 7.1.2. Portable
- 7.2. Market Analysis, Insights and Forecast - by End User
- 7.2.1. Dental Clinics
- 7.2.2. Hospitals
- 7.2.3. Other End Users
- 7.1. Market Analysis, Insights and Forecast - by Modality
- 8. Asia Pacific Intraoral Scanners Industry Analysis, Insights and Forecast, 2019-2031
- 8.1. Market Analysis, Insights and Forecast - by Modality
- 8.1.1. Standalone
- 8.1.2. Portable
- 8.2. Market Analysis, Insights and Forecast - by End User
- 8.2.1. Dental Clinics
- 8.2.2. Hospitals
- 8.2.3. Other End Users
- 8.1. Market Analysis, Insights and Forecast - by Modality
- 9. Middle East and Africa Intraoral Scanners Industry Analysis, Insights and Forecast, 2019-2031
- 9.1. Market Analysis, Insights and Forecast - by Modality
- 9.1.1. Standalone
- 9.1.2. Portable
- 9.2. Market Analysis, Insights and Forecast - by End User
- 9.2.1. Dental Clinics
- 9.2.2. Hospitals
- 9.2.3. Other End Users
- 9.1. Market Analysis, Insights and Forecast - by Modality
- 10. South America Intraoral Scanners Industry Analysis, Insights and Forecast, 2019-2031
- 10.1. Market Analysis, Insights and Forecast - by Modality
- 10.1.1. Standalone
- 10.1.2. Portable
- 10.2. Market Analysis, Insights and Forecast - by End User
- 10.2.1. Dental Clinics
- 10.2.2. Hospitals
- 10.2.3. Other End Users
- 10.1. Market Analysis, Insights and Forecast - by Modality
- 11. North America Intraoral Scanners Industry Analysis, Insights and Forecast, 2019-2031
- 11.1. Market Analysis, Insights and Forecast - By Country/Sub-region
- 11.1.1. undefined
- 12. Europe Intraoral Scanners Industry Analysis, Insights and Forecast, 2019-2031
- 12.1. Market Analysis, Insights and Forecast - By Country/Sub-region
- 12.1.1. undefined
- 13. Middle East and Africa Intraoral Scanners Industry Analysis, Insights and Forecast, 2019-2031
- 13.1. Market Analysis, Insights and Forecast - By Country/Sub-region
- 13.1.1. undefined
- 14. South America Intraoral Scanners Industry Analysis, Insights and Forecast, 2019-2031
- 14.1. Market Analysis, Insights and Forecast - By Country/Sub-region
- 14.1.1. undefined
- 15. Competitive Analysis
- 15.1. Global Market Share Analysis 2024
- 15.2. Company Profiles
- 15.2.1 Medit Corp
- 15.2.1.1. Overview
- 15.2.1.2. Products
- 15.2.1.3. SWOT Analysis
- 15.2.1.4. Recent Developments
- 15.2.1.5. Financials (Based on Availability)
- 15.2.2 Planmeca Oy
- 15.2.2.1. Overview
- 15.2.2.2. Products
- 15.2.2.3. SWOT Analysis
- 15.2.2.4. Recent Developments
- 15.2.2.5. Financials (Based on Availability)
- 15.2.3 3Shape A/S
- 15.2.3.1. Overview
- 15.2.3.2. Products
- 15.2.3.3. SWOT Analysis
- 15.2.3.4. Recent Developments
- 15.2.3.5. Financials (Based on Availability)
- 15.2.4 BLZ Dental
- 15.2.4.1. Overview
- 15.2.4.2. Products
- 15.2.4.3. SWOT Analysis
- 15.2.4.4. Recent Developments
- 15.2.4.5. Financials (Based on Availability)
- 15.2.5 Guangdong Launca Medical Device Technology Co Ltd
- 15.2.5.1. Overview
- 15.2.5.2. Products
- 15.2.5.3. SWOT Analysis
- 15.2.5.4. Recent Developments
- 15.2.5.5. Financials (Based on Availability)
- 15.2.6 Densys Ltd
- 15.2.6.1. Overview
- 15.2.6.2. Products
- 15.2.6.3. SWOT Analysis
- 15.2.6.4. Recent Developments
- 15.2.6.5. Financials (Based on Availability)
- 15.2.7 Condor Technologies NV
- 15.2.7.1. Overview
- 15.2.7.2. Products
- 15.2.7.3. SWOT Analysis
- 15.2.7.4. Recent Developments
- 15.2.7.5. Financials (Based on Availability)
- 15.2.8 Dentsply Sirona Inc
- 15.2.8.1. Overview
- 15.2.8.2. Products
- 15.2.8.3. SWOT Analysis
- 15.2.8.4. Recent Developments
- 15.2.8.5. Financials (Based on Availability)
- 15.2.9 Align Technology Inc
- 15.2.9.1. Overview
- 15.2.9.2. Products
- 15.2.9.3. SWOT Analysis
- 15.2.9.4. Recent Developments
- 15.2.9.5. Financials (Based on Availability)
- 15.2.10 Institut Straumann AG
- 15.2.10.1. Overview
- 15.2.10.2. Products
- 15.2.10.3. SWOT Analysis
- 15.2.10.4. Recent Developments
- 15.2.10.5. Financials (Based on Availability)
- 15.2.1 Medit Corp
List of Figures
- Figure 1: Global Intraoral Scanners Industry Revenue Breakdown (Million, %) by Region 2024 & 2032
- Figure 2: Global Intraoral Scanners Industry Volume Breakdown (K Unit, %) by Region 2024 & 2032
- Figure 3: North America Intraoral Scanners Industry Revenue (Million), by Country 2024 & 2032
- Figure 4: North America Intraoral Scanners Industry Volume (K Unit), by Country 2024 & 2032
- Figure 5: North America Intraoral Scanners Industry Revenue Share (%), by Country 2024 & 2032
- Figure 6: North America Intraoral Scanners Industry Volume Share (%), by Country 2024 & 2032
- Figure 7: Europe Intraoral Scanners Industry Revenue (Million), by Country 2024 & 2032
- Figure 8: Europe Intraoral Scanners Industry Volume (K Unit), by Country 2024 & 2032
- Figure 9: Europe Intraoral Scanners Industry Revenue Share (%), by Country 2024 & 2032
- Figure 10: Europe Intraoral Scanners Industry Volume Share (%), by Country 2024 & 2032
- Figure 11: Middle East and Africa Intraoral Scanners Industry Revenue (Million), by Country 2024 & 2032
- Figure 12: Middle East and Africa Intraoral Scanners Industry Volume (K Unit), by Country 2024 & 2032
- Figure 13: Middle East and Africa Intraoral Scanners Industry Revenue Share (%), by Country 2024 & 2032
- Figure 14: Middle East and Africa Intraoral Scanners Industry Volume Share (%), by Country 2024 & 2032
- Figure 15: South America Intraoral Scanners Industry Revenue (Million), by Country 2024 & 2032
- Figure 16: South America Intraoral Scanners Industry Volume (K Unit), by Country 2024 & 2032
- Figure 17: South America Intraoral Scanners Industry Revenue Share (%), by Country 2024 & 2032
- Figure 18: South America Intraoral Scanners Industry Volume Share (%), by Country 2024 & 2032
- Figure 19: North America Intraoral Scanners Industry Revenue (Million), by Modality 2024 & 2032
- Figure 20: North America Intraoral Scanners Industry Volume (K Unit), by Modality 2024 & 2032
- Figure 21: North America Intraoral Scanners Industry Revenue Share (%), by Modality 2024 & 2032
- Figure 22: North America Intraoral Scanners Industry Volume Share (%), by Modality 2024 & 2032
- Figure 23: North America Intraoral Scanners Industry Revenue (Million), by End User 2024 & 2032
- Figure 24: North America Intraoral Scanners Industry Volume (K Unit), by End User 2024 & 2032
- Figure 25: North America Intraoral Scanners Industry Revenue Share (%), by End User 2024 & 2032
- Figure 26: North America Intraoral Scanners Industry Volume Share (%), by End User 2024 & 2032
- Figure 27: North America Intraoral Scanners Industry Revenue (Million), by Country 2024 & 2032
- Figure 28: North America Intraoral Scanners Industry Volume (K Unit), by Country 2024 & 2032
- Figure 29: North America Intraoral Scanners Industry Revenue Share (%), by Country 2024 & 2032
- Figure 30: North America Intraoral Scanners Industry Volume Share (%), by Country 2024 & 2032
- Figure 31: Europe Intraoral Scanners Industry Revenue (Million), by Modality 2024 & 2032
- Figure 32: Europe Intraoral Scanners Industry Volume (K Unit), by Modality 2024 & 2032
- Figure 33: Europe Intraoral Scanners Industry Revenue Share (%), by Modality 2024 & 2032
- Figure 34: Europe Intraoral Scanners Industry Volume Share (%), by Modality 2024 & 2032
- Figure 35: Europe Intraoral Scanners Industry Revenue (Million), by End User 2024 & 2032
- Figure 36: Europe Intraoral Scanners Industry Volume (K Unit), by End User 2024 & 2032
- Figure 37: Europe Intraoral Scanners Industry Revenue Share (%), by End User 2024 & 2032
- Figure 38: Europe Intraoral Scanners Industry Volume Share (%), by End User 2024 & 2032
- Figure 39: Europe Intraoral Scanners Industry Revenue (Million), by Country 2024 & 2032
- Figure 40: Europe Intraoral Scanners Industry Volume (K Unit), by Country 2024 & 2032
- Figure 41: Europe Intraoral Scanners Industry Revenue Share (%), by Country 2024 & 2032
- Figure 42: Europe Intraoral Scanners Industry Volume Share (%), by Country 2024 & 2032
- Figure 43: Asia Pacific Intraoral Scanners Industry Revenue (Million), by Modality 2024 & 2032
- Figure 44: Asia Pacific Intraoral Scanners Industry Volume (K Unit), by Modality 2024 & 2032
- Figure 45: Asia Pacific Intraoral Scanners Industry Revenue Share (%), by Modality 2024 & 2032
- Figure 46: Asia Pacific Intraoral Scanners Industry Volume Share (%), by Modality 2024 & 2032
- Figure 47: Asia Pacific Intraoral Scanners Industry Revenue (Million), by End User 2024 & 2032
- Figure 48: Asia Pacific Intraoral Scanners Industry Volume (K Unit), by End User 2024 & 2032
- Figure 49: Asia Pacific Intraoral Scanners Industry Revenue Share (%), by End User 2024 & 2032
- Figure 50: Asia Pacific Intraoral Scanners Industry Volume Share (%), by End User 2024 & 2032
- Figure 51: Asia Pacific Intraoral Scanners Industry Revenue (Million), by Country 2024 & 2032
- Figure 52: Asia Pacific Intraoral Scanners Industry Volume (K Unit), by Country 2024 & 2032
- Figure 53: Asia Pacific Intraoral Scanners Industry Revenue Share (%), by Country 2024 & 2032
- Figure 54: Asia Pacific Intraoral Scanners Industry Volume Share (%), by Country 2024 & 2032
- Figure 55: Middle East and Africa Intraoral Scanners Industry Revenue (Million), by Modality 2024 & 2032
- Figure 56: Middle East and Africa Intraoral Scanners Industry Volume (K Unit), by Modality 2024 & 2032
- Figure 57: Middle East and Africa Intraoral Scanners Industry Revenue Share (%), by Modality 2024 & 2032
- Figure 58: Middle East and Africa Intraoral Scanners Industry Volume Share (%), by Modality 2024 & 2032
- Figure 59: Middle East and Africa Intraoral Scanners Industry Revenue (Million), by End User 2024 & 2032
- Figure 60: Middle East and Africa Intraoral Scanners Industry Volume (K Unit), by End User 2024 & 2032
- Figure 61: Middle East and Africa Intraoral Scanners Industry Revenue Share (%), by End User 2024 & 2032
- Figure 62: Middle East and Africa Intraoral Scanners Industry Volume Share (%), by End User 2024 & 2032
- Figure 63: Middle East and Africa Intraoral Scanners Industry Revenue (Million), by Country 2024 & 2032
- Figure 64: Middle East and Africa Intraoral Scanners Industry Volume (K Unit), by Country 2024 & 2032
- Figure 65: Middle East and Africa Intraoral Scanners Industry Revenue Share (%), by Country 2024 & 2032
- Figure 66: Middle East and Africa Intraoral Scanners Industry Volume Share (%), by Country 2024 & 2032
- Figure 67: South America Intraoral Scanners Industry Revenue (Million), by Modality 2024 & 2032
- Figure 68: South America Intraoral Scanners Industry Volume (K Unit), by Modality 2024 & 2032
- Figure 69: South America Intraoral Scanners Industry Revenue Share (%), by Modality 2024 & 2032
- Figure 70: South America Intraoral Scanners Industry Volume Share (%), by Modality 2024 & 2032
- Figure 71: South America Intraoral Scanners Industry Revenue (Million), by End User 2024 & 2032
- Figure 72: South America Intraoral Scanners Industry Volume (K Unit), by End User 2024 & 2032
- Figure 73: South America Intraoral Scanners Industry Revenue Share (%), by End User 2024 & 2032
- Figure 74: South America Intraoral Scanners Industry Volume Share (%), by End User 2024 & 2032
- Figure 75: South America Intraoral Scanners Industry Revenue (Million), by Country 2024 & 2032
- Figure 76: South America Intraoral Scanners Industry Volume (K Unit), by Country 2024 & 2032
- Figure 77: South America Intraoral Scanners Industry Revenue Share (%), by Country 2024 & 2032
- Figure 78: South America Intraoral Scanners Industry Volume Share (%), by Country 2024 & 2032
List of Tables
- Table 1: Global Intraoral Scanners Industry Revenue Million Forecast, by Region 2019 & 2032
- Table 2: Global Intraoral Scanners Industry Volume K Unit Forecast, by Region 2019 & 2032
- Table 3: Global Intraoral Scanners Industry Revenue Million Forecast, by Modality 2019 & 2032
- Table 4: Global Intraoral Scanners Industry Volume K Unit Forecast, by Modality 2019 & 2032
- Table 5: Global Intraoral Scanners Industry Revenue Million Forecast, by End User 2019 & 2032
- Table 6: Global Intraoral Scanners Industry Volume K Unit Forecast, by End User 2019 & 2032
- Table 7: Global Intraoral Scanners Industry Revenue Million Forecast, by Region 2019 & 2032
- Table 8: Global Intraoral Scanners Industry Volume K Unit Forecast, by Region 2019 & 2032
- Table 9: Global Intraoral Scanners Industry Revenue Million Forecast, by Country 2019 & 2032
- Table 10: Global Intraoral Scanners Industry Volume K Unit Forecast, by Country 2019 & 2032
- Table 11: Global Intraoral Scanners Industry Revenue Million Forecast, by Country 2019 & 2032
- Table 12: Global Intraoral Scanners Industry Volume K Unit Forecast, by Country 2019 & 2032
- Table 13: Global Intraoral Scanners Industry Revenue Million Forecast, by Country 2019 & 2032
- Table 14: Global Intraoral Scanners Industry Volume K Unit Forecast, by Country 2019 & 2032
- Table 15: Global Intraoral Scanners Industry Revenue Million Forecast, by Country 2019 & 2032
- Table 16: Global Intraoral Scanners Industry Volume K Unit Forecast, by Country 2019 & 2032
- Table 17: Global Intraoral Scanners Industry Revenue Million Forecast, by Modality 2019 & 2032
- Table 18: Global Intraoral Scanners Industry Volume K Unit Forecast, by Modality 2019 & 2032
- Table 19: Global Intraoral Scanners Industry Revenue Million Forecast, by End User 2019 & 2032
- Table 20: Global Intraoral Scanners Industry Volume K Unit Forecast, by End User 2019 & 2032
- Table 21: Global Intraoral Scanners Industry Revenue Million Forecast, by Country 2019 & 2032
- Table 22: Global Intraoral Scanners Industry Volume K Unit Forecast, by Country 2019 & 2032
- Table 23: United States Intraoral Scanners Industry Revenue (Million) Forecast, by Application 2019 & 2032
- Table 24: United States Intraoral Scanners Industry Volume (K Unit) Forecast, by Application 2019 & 2032
- Table 25: Canada Intraoral Scanners Industry Revenue (Million) Forecast, by Application 2019 & 2032
- Table 26: Canada Intraoral Scanners Industry Volume (K Unit) Forecast, by Application 2019 & 2032
- Table 27: Mexico Intraoral Scanners Industry Revenue (Million) Forecast, by Application 2019 & 2032
- Table 28: Mexico Intraoral Scanners Industry Volume (K Unit) Forecast, by Application 2019 & 2032
- Table 29: Global Intraoral Scanners Industry Revenue Million Forecast, by Modality 2019 & 2032
- Table 30: Global Intraoral Scanners Industry Volume K Unit Forecast, by Modality 2019 & 2032
- Table 31: Global Intraoral Scanners Industry Revenue Million Forecast, by End User 2019 & 2032
- Table 32: Global Intraoral Scanners Industry Volume K Unit Forecast, by End User 2019 & 2032
- Table 33: Global Intraoral Scanners Industry Revenue Million Forecast, by Country 2019 & 2032
- Table 34: Global Intraoral Scanners Industry Volume K Unit Forecast, by Country 2019 & 2032
- Table 35: Germany Intraoral Scanners Industry Revenue (Million) Forecast, by Application 2019 & 2032
- Table 36: Germany Intraoral Scanners Industry Volume (K Unit) Forecast, by Application 2019 & 2032
- Table 37: United Kingdom Intraoral Scanners Industry Revenue (Million) Forecast, by Application 2019 & 2032
- Table 38: United Kingdom Intraoral Scanners Industry Volume (K Unit) Forecast, by Application 2019 & 2032
- Table 39: France Intraoral Scanners Industry Revenue (Million) Forecast, by Application 2019 & 2032
- Table 40: France Intraoral Scanners Industry Volume (K Unit) Forecast, by Application 2019 & 2032
- Table 41: Italy Intraoral Scanners Industry Revenue (Million) Forecast, by Application 2019 & 2032
- Table 42: Italy Intraoral Scanners Industry Volume (K Unit) Forecast, by Application 2019 & 2032
- Table 43: Spain Intraoral Scanners Industry Revenue (Million) Forecast, by Application 2019 & 2032
- Table 44: Spain Intraoral Scanners Industry Volume (K Unit) Forecast, by Application 2019 & 2032
- Table 45: Rest of Europe Intraoral Scanners Industry Revenue (Million) Forecast, by Application 2019 & 2032
- Table 46: Rest of Europe Intraoral Scanners Industry Volume (K Unit) Forecast, by Application 2019 & 2032
- Table 47: Global Intraoral Scanners Industry Revenue Million Forecast, by Modality 2019 & 2032
- Table 48: Global Intraoral Scanners Industry Volume K Unit Forecast, by Modality 2019 & 2032
- Table 49: Global Intraoral Scanners Industry Revenue Million Forecast, by End User 2019 & 2032
- Table 50: Global Intraoral Scanners Industry Volume K Unit Forecast, by End User 2019 & 2032
- Table 51: Global Intraoral Scanners Industry Revenue Million Forecast, by Country 2019 & 2032
- Table 52: Global Intraoral Scanners Industry Volume K Unit Forecast, by Country 2019 & 2032
- Table 53: China Intraoral Scanners Industry Revenue (Million) Forecast, by Application 2019 & 2032
- Table 54: China Intraoral Scanners Industry Volume (K Unit) Forecast, by Application 2019 & 2032
- Table 55: Japan Intraoral Scanners Industry Revenue (Million) Forecast, by Application 2019 & 2032
- Table 56: Japan Intraoral Scanners Industry Volume (K Unit) Forecast, by Application 2019 & 2032
- Table 57: India Intraoral Scanners Industry Revenue (Million) Forecast, by Application 2019 & 2032
- Table 58: India Intraoral Scanners Industry Volume (K Unit) Forecast, by Application 2019 & 2032
- Table 59: Australia Intraoral Scanners Industry Revenue (Million) Forecast, by Application 2019 & 2032
- Table 60: Australia Intraoral Scanners Industry Volume (K Unit) Forecast, by Application 2019 & 2032
- Table 61: South Korea Intraoral Scanners Industry Revenue (Million) Forecast, by Application 2019 & 2032
- Table 62: South Korea Intraoral Scanners Industry Volume (K Unit) Forecast, by Application 2019 & 2032
- Table 63: Rest of Asia Pacific Intraoral Scanners Industry Revenue (Million) Forecast, by Application 2019 & 2032
- Table 64: Rest of Asia Pacific Intraoral Scanners Industry Volume (K Unit) Forecast, by Application 2019 & 2032
- Table 65: Global Intraoral Scanners Industry Revenue Million Forecast, by Modality 2019 & 2032
- Table 66: Global Intraoral Scanners Industry Volume K Unit Forecast, by Modality 2019 & 2032
- Table 67: Global Intraoral Scanners Industry Revenue Million Forecast, by End User 2019 & 2032
- Table 68: Global Intraoral Scanners Industry Volume K Unit Forecast, by End User 2019 & 2032
- Table 69: Global Intraoral Scanners Industry Revenue Million Forecast, by Country 2019 & 2032
- Table 70: Global Intraoral Scanners Industry Volume K Unit Forecast, by Country 2019 & 2032
- Table 71: GCC Intraoral Scanners Industry Revenue (Million) Forecast, by Application 2019 & 2032
- Table 72: GCC Intraoral Scanners Industry Volume (K Unit) Forecast, by Application 2019 & 2032
- Table 73: South Africa Intraoral Scanners Industry Revenue (Million) Forecast, by Application 2019 & 2032
- Table 74: South Africa Intraoral Scanners Industry Volume (K Unit) Forecast, by Application 2019 & 2032
- Table 75: Rest of Middle East and Africa Intraoral Scanners Industry Revenue (Million) Forecast, by Application 2019 & 2032
- Table 76: Rest of Middle East and Africa Intraoral Scanners Industry Volume (K Unit) Forecast, by Application 2019 & 2032
- Table 77: Global Intraoral Scanners Industry Revenue Million Forecast, by Modality 2019 & 2032
- Table 78: Global Intraoral Scanners Industry Volume K Unit Forecast, by Modality 2019 & 2032
- Table 79: Global Intraoral Scanners Industry Revenue Million Forecast, by End User 2019 & 2032
- Table 80: Global Intraoral Scanners Industry Volume K Unit Forecast, by End User 2019 & 2032
- Table 81: Global Intraoral Scanners Industry Revenue Million Forecast, by Country 2019 & 2032
- Table 82: Global Intraoral Scanners Industry Volume K Unit Forecast, by Country 2019 & 2032
- Table 83: Brazil Intraoral Scanners Industry Revenue (Million) Forecast, by Application 2019 & 2032
- Table 84: Brazil Intraoral Scanners Industry Volume (K Unit) Forecast, by Application 2019 & 2032
- Table 85: Argentina Intraoral Scanners Industry Revenue (Million) Forecast, by Application 2019 & 2032
- Table 86: Argentina Intraoral Scanners Industry Volume (K Unit) Forecast, by Application 2019 & 2032
- Table 87: Rest of South America Intraoral Scanners Industry Revenue (Million) Forecast, by Application 2019 & 2032
- Table 88: Rest of South America Intraoral Scanners Industry Volume (K Unit) Forecast, by Application 2019 & 2032
Frequently Asked Questions
1. What is the projected Compound Annual Growth Rate (CAGR) of the Intraoral Scanners Industry?
The projected CAGR is approximately 2.51%.
2. Which companies are prominent players in the Intraoral Scanners Industry?
Key companies in the market include Medit Corp, Planmeca Oy, 3Shape A/S, BLZ Dental, Guangdong Launca Medical Device Technology Co Ltd, Densys Ltd, Condor Technologies NV, Dentsply Sirona Inc, Align Technology Inc, Institut Straumann AG.
3. What are the main segments of the Intraoral Scanners Industry?
The market segments include Modality, End User.
4. Can you provide details about the market size?
The market size is estimated to be USD 710.70 Million as of 2022.
5. What are some drivers contributing to market growth?
Rapid Technological Advancements; Increase in Geriatric Population; Rise in Dental Disorders.
6. What are the notable trends driving market growth?
Standalone Devices Segment is Expected to Witness Strong Growth in The Coming Years.
7. Are there any restraints impacting market growth?
Lack of Skilled Professionals; High Cost of Intraoral Scanners.
8. Can you provide examples of recent developments in the market?
March 2023: Freqty Technology, a Chinese high-tech enterprise in the field of digital dentistry, launched the latest and smallest PANDA intra-oral scanner, the PANDA Smart, at the International Dental Show (IDS) in Germany in 2023.
9. What pricing options are available for accessing the report?
Pricing options include single-user, multi-user, and enterprise licenses priced at USD 4750, USD 5250, and USD 8750 respectively.
10. Is the market size provided in terms of value or volume?
The market size is provided in terms of value, measured in Million and volume, measured in K Unit.
11. Are there any specific market keywords associated with the report?
Yes, the market keyword associated with the report is "Intraoral Scanners Industry," which aids in identifying and referencing the specific market segment covered.
12. How do I determine which pricing option suits my needs best?
The pricing options vary based on user requirements and access needs. Individual users may opt for single-user licenses, while businesses requiring broader access may choose multi-user or enterprise licenses for cost-effective access to the report.
13. Are there any additional resources or data provided in the Intraoral Scanners Industry report?
While the report offers comprehensive insights, it's advisable to review the specific contents or supplementary materials provided to ascertain if additional resources or data are available.
14. How can I stay updated on further developments or reports in the Intraoral Scanners Industry?
To stay informed about further developments, trends, and reports in the Intraoral Scanners Industry, consider subscribing to industry newsletters, following relevant companies and organizations, or regularly checking reputable industry news sources and publications.
Methodology
Step 1 - Identification of Relevant Samples Size from Population Database


Step 2 - Approaches for Defining Global Market Size (Value, Volume* & Price*)

Note*: In applicable scenarios
Step 3 - Data Sources
Primary Research
- Web Analytics
- Survey Reports
- Research Institute
- Latest Research Reports
- Opinion Leaders
Secondary Research
- Annual Reports
- White Paper
- Latest Press Release
- Industry Association
- Paid Database
- Investor Presentations

Step 4 - Data Triangulation
Involves using different sources of information in order to increase the validity of a study
These sources are likely to be stakeholders in a program - participants, other researchers, program staff, other community members, and so on.
Then we put all data in single framework & apply various statistical tools to find out the dynamic on the market.
During the analysis stage, feedback from the stakeholder groups would be compared to determine areas of agreement as well as areas of divergence
