

Key Insights
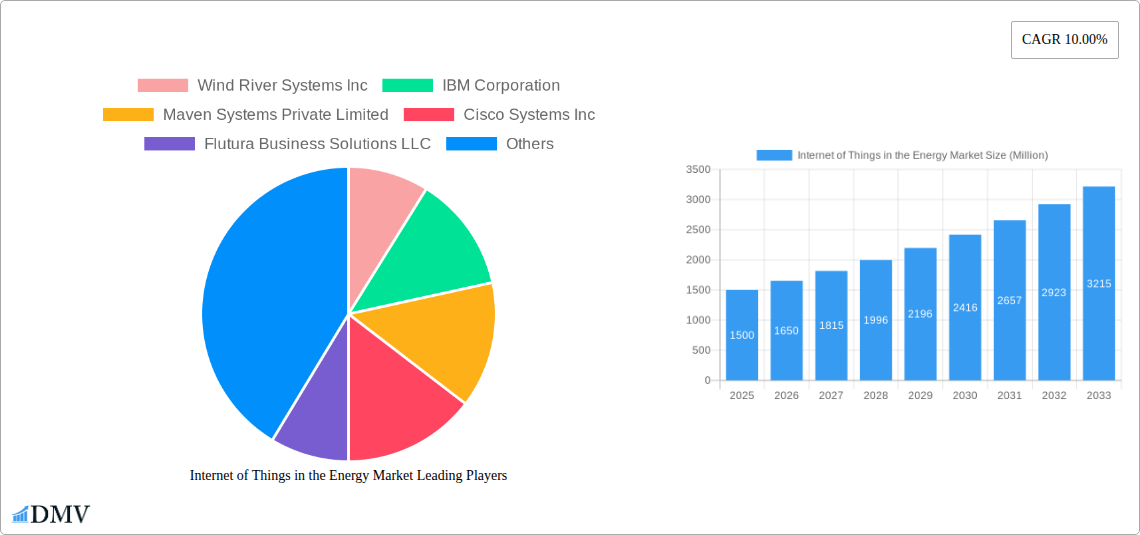
The Internet of Things (IoT) is rapidly transforming the energy sector, driving efficiency, sustainability, and grid modernization. The market, valued at approximately $XX million in 2025, is projected to experience robust growth, with a compound annual growth rate (CAGR) of 10% from 2025 to 2033. This expansion is fueled by several key drivers. Firstly, the increasing need for smart grids to manage fluctuating renewable energy sources and optimize power distribution is a major catalyst. Secondly, the growing adoption of advanced metering infrastructure (AMI) allows for real-time monitoring and data analysis, leading to improved energy management and reduced losses. Thirdly, the proliferation of IoT-enabled devices, such as smart sensors and actuators, provides granular insights into energy consumption patterns, enabling proactive maintenance and predictive analytics. Furthermore, government initiatives promoting energy efficiency and renewable energy integration are further bolstering market growth.
However, the market faces some challenges. High initial investment costs for IoT infrastructure can be a barrier to adoption, particularly for smaller energy companies. Concerns surrounding data security and privacy also need to be addressed to ensure the widespread deployment of IoT solutions. Despite these restraints, the long-term benefits of improved operational efficiency, cost savings, and environmental sustainability are expected to outweigh these challenges. Segmentation reveals significant opportunities across hardware (including IoT software, platforms, security solutions, and services). Major players like IBM, Cisco, and Intel are actively shaping this landscape, contributing to the development and implementation of advanced IoT solutions across diverse regions, including North America, Europe, and Asia Pacific, where early adoption and supportive regulatory environments are propelling market expansion. The continued expansion of renewable energy sources and increasing energy demand will further fuel the growth of the IoT in the energy sector over the forecast period.
Internet of Things (IoT) in the Energy Market: A Comprehensive Report (2019-2033)
This insightful report delivers a comprehensive analysis of the Internet of Things (IoT) in the energy market, projecting a market valuation exceeding $XX Million by 2033. It provides a detailed examination of market dynamics, technological advancements, key players, and future growth opportunities, offering crucial insights for stakeholders across the energy and technology sectors. The study period spans 2019-2033, with 2025 serving as the base and estimated year. The forecast period covers 2025-2033, while the historical period encompasses 2019-2024.
Internet of Things in the Energy Market Market Composition & Trends
This section analyzes the market's competitive landscape, encompassing market concentration, innovation drivers, regulatory frameworks, substitute products, end-user profiles, and mergers and acquisitions (M&A) activity. The report examines the market share distribution among key players and analyzes the financial aspects of significant M&A deals, with total deal values exceeding $XX Million recorded during the historical period.
- Market Concentration: The report details the market share held by major players like IBM Corporation, Cisco Systems Inc, and others, highlighting the level of market consolidation and competition. Specific market share data for each company for the estimated year (2025) will be provided.
- Innovation Catalysts: Factors driving innovation, such as advancements in 5G technology, post-quantum cryptography, and the development of sophisticated IoT platforms, are analyzed in detail, outlining their impact on market growth.
- Regulatory Landscape: The report explores the influence of governmental regulations and policies on market expansion, including incentives and potential barriers to entry for new companies and investments.
- Substitute Products: The analysis includes a comparative evaluation of alternative technologies and their potential to impact the market share of IoT solutions within the energy sector.
- End-User Profiles: This section provides a detailed breakdown of the various types of end-users adopting IoT solutions in the energy sector, including utilities, energy producers, and industrial consumers.
- M&A Activity: The report quantifies the M&A activity within the IoT energy market, detailing the financial implications of major deals and their strategic implications for market consolidation and technological advancements.
Internet of Things in the Energy Market Industry Evolution
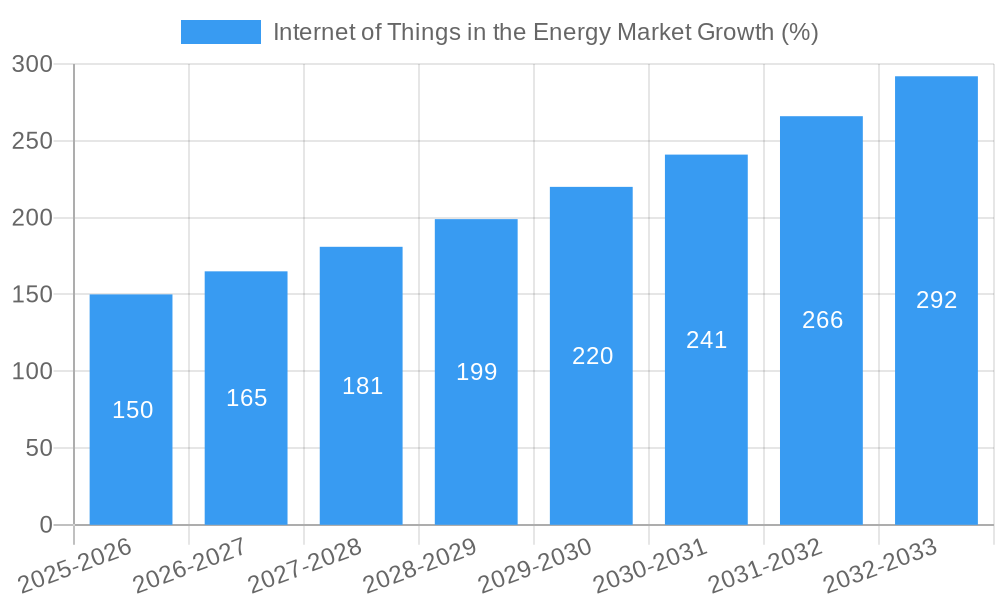
This section meticulously examines the trajectory of market growth, highlighting significant technological leaps, and the evolution of consumer preferences shaping the demand for IoT solutions in the energy sector. The analysis incorporates specific data points, including growth rates for various IoT segments and adoption metrics for key technologies. The compound annual growth rate (CAGR) for the forecast period is projected to be XX%.
- Market Growth Trajectories: Detailed analysis of historical and projected market growth rates, segmented by product type (Hardware, IoT Software, IoT Platform, IoT Security, IoT Services).
- Technological Advancements: Discussion of key technological developments (e.g., 5G, AI, blockchain) and their impact on the efficiency, scalability, and security of IoT solutions within the energy industry.
- Shifting Consumer Demands: Analysis of how evolving consumer needs and expectations (e.g., sustainability, cost-effectiveness, energy efficiency) are driving the adoption of IoT technologies.
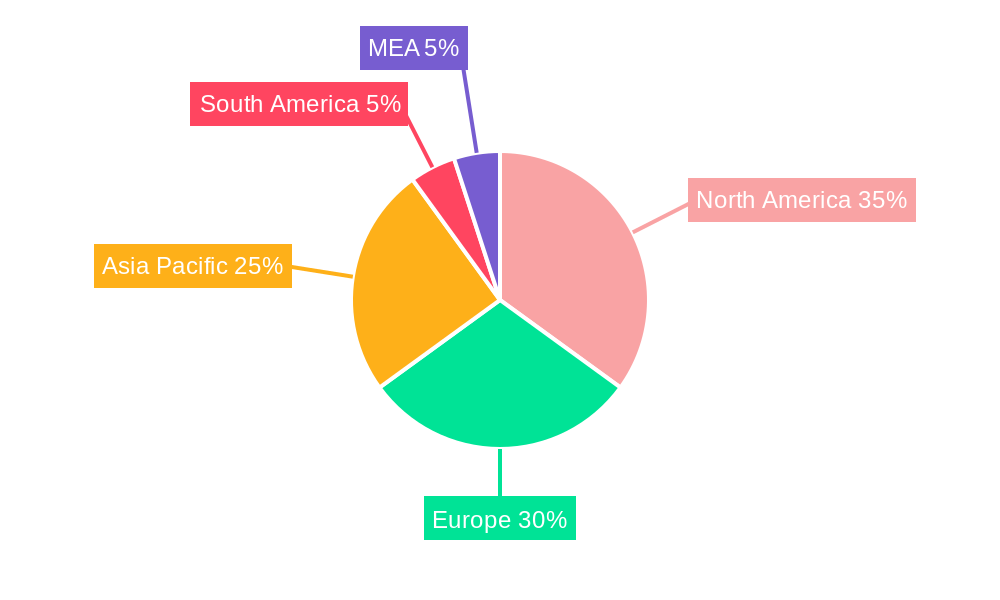
Leading Regions, Countries, or Segments in Internet of Things in the Energy Market
This section identifies the leading geographical regions and market segments within the IoT energy market. It delves into the underlying reasons for dominance, providing detailed insights into investment trends, regulatory support, and other contributing factors.
- Dominant Regions/Countries: Analysis pinpoints the leading regions for IoT adoption in the energy sector, identifying factors like existing infrastructure, governmental policies, and industry maturity.
- Segment Analysis: A comprehensive examination of the leading market segments (Hardware, IoT Software, IoT Platform, IoT Security, IoT Services) including market size projections for each segment through 2033. For example, the IoT software segment is expected to reach $XX Million by 2033.
- Key Drivers: Detailed analysis of the factors driving growth in each dominant region and segment, including:
- Investment Trends: Analysis of investment patterns in specific regions and segments, highlighting venture capital, private equity, and government funding.
- Regulatory Support: Examination of the impact of supportive regulations and policies on market growth in specific regions and segments.
Internet of Things in the Energy Market Product Innovations
This section showcases the latest product innovations, focusing on unique selling propositions and advancements in performance metrics. Recent advancements in sensors, data analytics, and edge computing are driving the development of more efficient and reliable IoT solutions in the energy sector. New products are improving energy grid management, predictive maintenance, and enhancing overall energy efficiency. Specific examples of these innovations, along with associated performance metrics, will be provided.
Propelling Factors for Internet of Things in the Energy Market Growth
Several factors contribute to the growth of the IoT in the energy market. Technological advancements like 5G and AI are improving the capabilities of IoT devices, while economic factors such as the decreasing cost of hardware and increasing energy prices are driving adoption. Supportive regulatory environments, such as government incentives for renewable energy, are also fueling market growth. The report provides detailed evidence to support these assertions.
Obstacles in the Internet of Things in the Energy Market Market
Despite the immense potential, challenges exist. Cybersecurity concerns related to data breaches and the potential for system failures pose risks. Supply chain disruptions caused by global events can impact the availability of critical components. Furthermore, intense competition among established players and new entrants creates a dynamic market. The report provides a quantified assessment of these obstacles' impact on market growth.
Future Opportunities in Internet of Things in the Energy Market
The future presents substantial opportunities. The integration of IoT with renewable energy sources is poised for significant expansion. The development of more sophisticated data analytics capabilities will enable better energy management and grid optimization. New markets in emerging economies present untapped potential. The report outlines these opportunities and their potential impact on market expansion.
Major Players in the Internet of Things in the Energy Market Ecosystem
- Wind River Systems Inc
- IBM Corporation
- Maven Systems Private Limited
- Cisco Systems Inc
- Flutura Business Solutions LLC
- Carriots SL
- AGT International
- SAP SE
- Intel Corporation
- Davra Networks
Key Developments in Internet of Things in the Energy Market Industry
- Feb 2022: Nokia and AT&T's collaboration to enhance 5G uplink with distributed massive MIMO, resulting in a projected 60-90% increase in 5G uplink capacity.
- Jul 2022: Release of Crypto Quantique's post-quantum cryptography (QPC) QuarkLink platform, enhancing IoT security in the energy sector.
- Nov 2022: Huawei's introduction of 5G distributed massive MIMO for indoor cellular networks, expanding the reach and capabilities of IoT deployments in energy infrastructure.
Strategic Internet of Things in the Energy Market Market Forecast
The IoT in the energy market is poised for continued strong growth, driven by technological innovations and increasing demand for efficient and sustainable energy solutions. The market is expected to witness significant expansion across various segments and geographical regions, creating numerous opportunities for market participants. The forecast incorporates projections based on current market trends, technological advancements, and macroeconomic factors. The report provides a detailed quantitative forecast, including CAGR and market size projections for the forecast period.
Internet of Things in the Energy Market Segmentation
-
1. Type
- 1.1. Hardware
- 1.2. IoT Software
- 1.3. IoT Platform
- 1.4. IoT Security
- 1.5. IoT Services
-
2. Industry
- 2.1. Utilities
- 2.2. Commercial Buildings
- 2.3. Industrial Facilities
Internet of Things in the Energy Market Segmentation By Geography
- 1. North America
- 2. Europe
- 3. Asia Pacific
- 4. Latin America
- 5. Middle East and Africa
Internet of Things in the Energy Market REPORT HIGHLIGHTS
| Aspects | Details |
|---|---|
| Study Period | 2019-2033 |
| Base Year | 2024 |
| Estimated Year | 2025 |
| Forecast Period | 2025-2033 |
| Historical Period | 2019-2024 |
| Growth Rate | CAGR of 10.00% from 2019-2033 |
| Segmentation |
|
Table of Contents
- 1. Introduction
- 1.1. Research Scope
- 1.2. Market Segmentation
- 1.3. Research Methodology
- 1.4. Definitions and Assumptions
- 2. Executive Summary
- 2.1. Introduction
- 3. Market Dynamics
- 3.1. Introduction
- 3.2. Market Drivers
- 3.2.1. Increasing Awareness of Energy Consumption Control
- 3.3. Market Restrains
- 3.3.1. High Risk Associated with Data
- 3.4. Market Trends
- 3.4.1. Smart Meters Expected to Hold Significant Share
- 4. Market Factor Analysis
- 4.1. Porters Five Forces
- 4.2. Supply/Value Chain
- 4.3. PESTEL analysis
- 4.4. Market Entropy
- 4.5. Patent/Trademark Analysis
- 5. Global Internet of Things in the Energy Market Analysis, Insights and Forecast, 2019-2031
- 5.1. Market Analysis, Insights and Forecast - by Type
- 5.1.1. Hardware
- 5.1.2. IoT Software
- 5.1.3. IoT Platform
- 5.1.4. IoT Security
- 5.1.5. IoT Services
- 5.2. Market Analysis, Insights and Forecast - by Industry
- 5.2.1. Utilities
- 5.2.2. Commercial Buildings
- 5.2.3. Industrial Facilities
- 5.3. Market Analysis, Insights and Forecast - by Region
- 5.3.1. North America
- 5.3.2. Europe
- 5.3.3. Asia Pacific
- 5.3.4. Latin America
- 5.3.5. Middle East and Africa
- 5.1. Market Analysis, Insights and Forecast - by Type
- 6. North America Internet of Things in the Energy Market Analysis, Insights and Forecast, 2019-2031
- 6.1. Market Analysis, Insights and Forecast - by Type
- 6.1.1. Hardware
- 6.1.2. IoT Software
- 6.1.3. IoT Platform
- 6.1.4. IoT Security
- 6.1.5. IoT Services
- 6.2. Market Analysis, Insights and Forecast - by Industry
- 6.2.1. Utilities
- 6.2.2. Commercial Buildings
- 6.2.3. Industrial Facilities
- 6.1. Market Analysis, Insights and Forecast - by Type
- 7. Europe Internet of Things in the Energy Market Analysis, Insights and Forecast, 2019-2031
- 7.1. Market Analysis, Insights and Forecast - by Type
- 7.1.1. Hardware
- 7.1.2. IoT Software
- 7.1.3. IoT Platform
- 7.1.4. IoT Security
- 7.1.5. IoT Services
- 7.2. Market Analysis, Insights and Forecast - by Industry
- 7.2.1. Utilities
- 7.2.2. Commercial Buildings
- 7.2.3. Industrial Facilities
- 7.1. Market Analysis, Insights and Forecast - by Type
- 8. Asia Pacific Internet of Things in the Energy Market Analysis, Insights and Forecast, 2019-2031
- 8.1. Market Analysis, Insights and Forecast - by Type
- 8.1.1. Hardware
- 8.1.2. IoT Software
- 8.1.3. IoT Platform
- 8.1.4. IoT Security
- 8.1.5. IoT Services
- 8.2. Market Analysis, Insights and Forecast - by Industry
- 8.2.1. Utilities
- 8.2.2. Commercial Buildings
- 8.2.3. Industrial Facilities
- 8.1. Market Analysis, Insights and Forecast - by Type
- 9. Latin America Internet of Things in the Energy Market Analysis, Insights and Forecast, 2019-2031
- 9.1. Market Analysis, Insights and Forecast - by Type
- 9.1.1. Hardware
- 9.1.2. IoT Software
- 9.1.3. IoT Platform
- 9.1.4. IoT Security
- 9.1.5. IoT Services
- 9.2. Market Analysis, Insights and Forecast - by Industry
- 9.2.1. Utilities
- 9.2.2. Commercial Buildings
- 9.2.3. Industrial Facilities
- 9.1. Market Analysis, Insights and Forecast - by Type
- 10. Middle East and Africa Internet of Things in the Energy Market Analysis, Insights and Forecast, 2019-2031
- 10.1. Market Analysis, Insights and Forecast - by Type
- 10.1.1. Hardware
- 10.1.2. IoT Software
- 10.1.3. IoT Platform
- 10.1.4. IoT Security
- 10.1.5. IoT Services
- 10.2. Market Analysis, Insights and Forecast - by Industry
- 10.2.1. Utilities
- 10.2.2. Commercial Buildings
- 10.2.3. Industrial Facilities
- 10.1. Market Analysis, Insights and Forecast - by Type
- 11. North America Internet of Things in the Energy Market Analysis, Insights and Forecast, 2019-2031
- 11.1. Market Analysis, Insights and Forecast - By Country/Sub-region
- 11.1.1 United States
- 11.1.2 Canada
- 11.1.3 Mexico
- 12. Europe Internet of Things in the Energy Market Analysis, Insights and Forecast, 2019-2031
- 12.1. Market Analysis, Insights and Forecast - By Country/Sub-region
- 12.1.1 Germany
- 12.1.2 United Kingdom
- 12.1.3 France
- 12.1.4 Spain
- 12.1.5 Italy
- 12.1.6 Spain
- 12.1.7 Belgium
- 12.1.8 Netherland
- 12.1.9 Nordics
- 12.1.10 Rest of Europe
- 13. Asia Pacific Internet of Things in the Energy Market Analysis, Insights and Forecast, 2019-2031
- 13.1. Market Analysis, Insights and Forecast - By Country/Sub-region
- 13.1.1 China
- 13.1.2 Japan
- 13.1.3 India
- 13.1.4 South Korea
- 13.1.5 Southeast Asia
- 13.1.6 Australia
- 13.1.7 Indonesia
- 13.1.8 Phillipes
- 13.1.9 Singapore
- 13.1.10 Thailandc
- 13.1.11 Rest of Asia Pacific
- 14. South America Internet of Things in the Energy Market Analysis, Insights and Forecast, 2019-2031
- 14.1. Market Analysis, Insights and Forecast - By Country/Sub-region
- 14.1.1 Brazil
- 14.1.2 Argentina
- 14.1.3 Peru
- 14.1.4 Chile
- 14.1.5 Colombia
- 14.1.6 Ecuador
- 14.1.7 Venezuela
- 14.1.8 Rest of South America
- 15. North America Internet of Things in the Energy Market Analysis, Insights and Forecast, 2019-2031
- 15.1. Market Analysis, Insights and Forecast - By Country/Sub-region
- 15.1.1 United States
- 15.1.2 Canada
- 15.1.3 Mexico
- 16. MEA Internet of Things in the Energy Market Analysis, Insights and Forecast, 2019-2031
- 16.1. Market Analysis, Insights and Forecast - By Country/Sub-region
- 16.1.1 United Arab Emirates
- 16.1.2 Saudi Arabia
- 16.1.3 South Africa
- 16.1.4 Rest of Middle East and Africa
- 17. Competitive Analysis
- 17.1. Global Market Share Analysis 2024
- 17.2. Company Profiles
- 17.2.1 Wind River Systems Inc
- 17.2.1.1. Overview
- 17.2.1.2. Products
- 17.2.1.3. SWOT Analysis
- 17.2.1.4. Recent Developments
- 17.2.1.5. Financials (Based on Availability)
- 17.2.2 IBM Corporation
- 17.2.2.1. Overview
- 17.2.2.2. Products
- 17.2.2.3. SWOT Analysis
- 17.2.2.4. Recent Developments
- 17.2.2.5. Financials (Based on Availability)
- 17.2.3 Maven Systems Private Limited
- 17.2.3.1. Overview
- 17.2.3.2. Products
- 17.2.3.3. SWOT Analysis
- 17.2.3.4. Recent Developments
- 17.2.3.5. Financials (Based on Availability)
- 17.2.4 Cisco Systems Inc
- 17.2.4.1. Overview
- 17.2.4.2. Products
- 17.2.4.3. SWOT Analysis
- 17.2.4.4. Recent Developments
- 17.2.4.5. Financials (Based on Availability)
- 17.2.5 Flutura Business Solutions LLC
- 17.2.5.1. Overview
- 17.2.5.2. Products
- 17.2.5.3. SWOT Analysis
- 17.2.5.4. Recent Developments
- 17.2.5.5. Financials (Based on Availability)
- 17.2.6 Carriots SL
- 17.2.6.1. Overview
- 17.2.6.2. Products
- 17.2.6.3. SWOT Analysis
- 17.2.6.4. Recent Developments
- 17.2.6.5. Financials (Based on Availability)
- 17.2.7 AGT International
- 17.2.7.1. Overview
- 17.2.7.2. Products
- 17.2.7.3. SWOT Analysis
- 17.2.7.4. Recent Developments
- 17.2.7.5. Financials (Based on Availability)
- 17.2.8 SAP SE
- 17.2.8.1. Overview
- 17.2.8.2. Products
- 17.2.8.3. SWOT Analysis
- 17.2.8.4. Recent Developments
- 17.2.8.5. Financials (Based on Availability)
- 17.2.9 Intel Corporation
- 17.2.9.1. Overview
- 17.2.9.2. Products
- 17.2.9.3. SWOT Analysis
- 17.2.9.4. Recent Developments
- 17.2.9.5. Financials (Based on Availability)
- 17.2.10 Davra Networks
- 17.2.10.1. Overview
- 17.2.10.2. Products
- 17.2.10.3. SWOT Analysis
- 17.2.10.4. Recent Developments
- 17.2.10.5. Financials (Based on Availability)
- 17.2.1 Wind River Systems Inc
List of Figures
- Figure 1: Global Internet of Things in the Energy Market Revenue Breakdown (Million, %) by Region 2024 & 2032
- Figure 2: Global Internet of Things in the Energy Market Volume Breakdown (K Unit, %) by Region 2024 & 2032
- Figure 3: North America Internet of Things in the Energy Market Revenue (Million), by Country 2024 & 2032
- Figure 4: North America Internet of Things in the Energy Market Volume (K Unit), by Country 2024 & 2032
- Figure 5: North America Internet of Things in the Energy Market Revenue Share (%), by Country 2024 & 2032
- Figure 6: North America Internet of Things in the Energy Market Volume Share (%), by Country 2024 & 2032
- Figure 7: Europe Internet of Things in the Energy Market Revenue (Million), by Country 2024 & 2032
- Figure 8: Europe Internet of Things in the Energy Market Volume (K Unit), by Country 2024 & 2032
- Figure 9: Europe Internet of Things in the Energy Market Revenue Share (%), by Country 2024 & 2032
- Figure 10: Europe Internet of Things in the Energy Market Volume Share (%), by Country 2024 & 2032
- Figure 11: Asia Pacific Internet of Things in the Energy Market Revenue (Million), by Country 2024 & 2032
- Figure 12: Asia Pacific Internet of Things in the Energy Market Volume (K Unit), by Country 2024 & 2032
- Figure 13: Asia Pacific Internet of Things in the Energy Market Revenue Share (%), by Country 2024 & 2032
- Figure 14: Asia Pacific Internet of Things in the Energy Market Volume Share (%), by Country 2024 & 2032
- Figure 15: South America Internet of Things in the Energy Market Revenue (Million), by Country 2024 & 2032
- Figure 16: South America Internet of Things in the Energy Market Volume (K Unit), by Country 2024 & 2032
- Figure 17: South America Internet of Things in the Energy Market Revenue Share (%), by Country 2024 & 2032
- Figure 18: South America Internet of Things in the Energy Market Volume Share (%), by Country 2024 & 2032
- Figure 19: North America Internet of Things in the Energy Market Revenue (Million), by Country 2024 & 2032
- Figure 20: North America Internet of Things in the Energy Market Volume (K Unit), by Country 2024 & 2032
- Figure 21: North America Internet of Things in the Energy Market Revenue Share (%), by Country 2024 & 2032
- Figure 22: North America Internet of Things in the Energy Market Volume Share (%), by Country 2024 & 2032
- Figure 23: MEA Internet of Things in the Energy Market Revenue (Million), by Country 2024 & 2032
- Figure 24: MEA Internet of Things in the Energy Market Volume (K Unit), by Country 2024 & 2032
- Figure 25: MEA Internet of Things in the Energy Market Revenue Share (%), by Country 2024 & 2032
- Figure 26: MEA Internet of Things in the Energy Market Volume Share (%), by Country 2024 & 2032
- Figure 27: North America Internet of Things in the Energy Market Revenue (Million), by Type 2024 & 2032
- Figure 28: North America Internet of Things in the Energy Market Volume (K Unit), by Type 2024 & 2032
- Figure 29: North America Internet of Things in the Energy Market Revenue Share (%), by Type 2024 & 2032
- Figure 30: North America Internet of Things in the Energy Market Volume Share (%), by Type 2024 & 2032
- Figure 31: North America Internet of Things in the Energy Market Revenue (Million), by Industry 2024 & 2032
- Figure 32: North America Internet of Things in the Energy Market Volume (K Unit), by Industry 2024 & 2032
- Figure 33: North America Internet of Things in the Energy Market Revenue Share (%), by Industry 2024 & 2032
- Figure 34: North America Internet of Things in the Energy Market Volume Share (%), by Industry 2024 & 2032
- Figure 35: North America Internet of Things in the Energy Market Revenue (Million), by Country 2024 & 2032
- Figure 36: North America Internet of Things in the Energy Market Volume (K Unit), by Country 2024 & 2032
- Figure 37: North America Internet of Things in the Energy Market Revenue Share (%), by Country 2024 & 2032
- Figure 38: North America Internet of Things in the Energy Market Volume Share (%), by Country 2024 & 2032
- Figure 39: Europe Internet of Things in the Energy Market Revenue (Million), by Type 2024 & 2032
- Figure 40: Europe Internet of Things in the Energy Market Volume (K Unit), by Type 2024 & 2032
- Figure 41: Europe Internet of Things in the Energy Market Revenue Share (%), by Type 2024 & 2032
- Figure 42: Europe Internet of Things in the Energy Market Volume Share (%), by Type 2024 & 2032
- Figure 43: Europe Internet of Things in the Energy Market Revenue (Million), by Industry 2024 & 2032
- Figure 44: Europe Internet of Things in the Energy Market Volume (K Unit), by Industry 2024 & 2032
- Figure 45: Europe Internet of Things in the Energy Market Revenue Share (%), by Industry 2024 & 2032
- Figure 46: Europe Internet of Things in the Energy Market Volume Share (%), by Industry 2024 & 2032
- Figure 47: Europe Internet of Things in the Energy Market Revenue (Million), by Country 2024 & 2032
- Figure 48: Europe Internet of Things in the Energy Market Volume (K Unit), by Country 2024 & 2032
- Figure 49: Europe Internet of Things in the Energy Market Revenue Share (%), by Country 2024 & 2032
- Figure 50: Europe Internet of Things in the Energy Market Volume Share (%), by Country 2024 & 2032
- Figure 51: Asia Pacific Internet of Things in the Energy Market Revenue (Million), by Type 2024 & 2032
- Figure 52: Asia Pacific Internet of Things in the Energy Market Volume (K Unit), by Type 2024 & 2032
- Figure 53: Asia Pacific Internet of Things in the Energy Market Revenue Share (%), by Type 2024 & 2032
- Figure 54: Asia Pacific Internet of Things in the Energy Market Volume Share (%), by Type 2024 & 2032
- Figure 55: Asia Pacific Internet of Things in the Energy Market Revenue (Million), by Industry 2024 & 2032
- Figure 56: Asia Pacific Internet of Things in the Energy Market Volume (K Unit), by Industry 2024 & 2032
- Figure 57: Asia Pacific Internet of Things in the Energy Market Revenue Share (%), by Industry 2024 & 2032
- Figure 58: Asia Pacific Internet of Things in the Energy Market Volume Share (%), by Industry 2024 & 2032
- Figure 59: Asia Pacific Internet of Things in the Energy Market Revenue (Million), by Country 2024 & 2032
- Figure 60: Asia Pacific Internet of Things in the Energy Market Volume (K Unit), by Country 2024 & 2032
- Figure 61: Asia Pacific Internet of Things in the Energy Market Revenue Share (%), by Country 2024 & 2032
- Figure 62: Asia Pacific Internet of Things in the Energy Market Volume Share (%), by Country 2024 & 2032
- Figure 63: Latin America Internet of Things in the Energy Market Revenue (Million), by Type 2024 & 2032
- Figure 64: Latin America Internet of Things in the Energy Market Volume (K Unit), by Type 2024 & 2032
- Figure 65: Latin America Internet of Things in the Energy Market Revenue Share (%), by Type 2024 & 2032
- Figure 66: Latin America Internet of Things in the Energy Market Volume Share (%), by Type 2024 & 2032
- Figure 67: Latin America Internet of Things in the Energy Market Revenue (Million), by Industry 2024 & 2032
- Figure 68: Latin America Internet of Things in the Energy Market Volume (K Unit), by Industry 2024 & 2032
- Figure 69: Latin America Internet of Things in the Energy Market Revenue Share (%), by Industry 2024 & 2032
- Figure 70: Latin America Internet of Things in the Energy Market Volume Share (%), by Industry 2024 & 2032
- Figure 71: Latin America Internet of Things in the Energy Market Revenue (Million), by Country 2024 & 2032
- Figure 72: Latin America Internet of Things in the Energy Market Volume (K Unit), by Country 2024 & 2032
- Figure 73: Latin America Internet of Things in the Energy Market Revenue Share (%), by Country 2024 & 2032
- Figure 74: Latin America Internet of Things in the Energy Market Volume Share (%), by Country 2024 & 2032
- Figure 75: Middle East and Africa Internet of Things in the Energy Market Revenue (Million), by Type 2024 & 2032
- Figure 76: Middle East and Africa Internet of Things in the Energy Market Volume (K Unit), by Type 2024 & 2032
- Figure 77: Middle East and Africa Internet of Things in the Energy Market Revenue Share (%), by Type 2024 & 2032
- Figure 78: Middle East and Africa Internet of Things in the Energy Market Volume Share (%), by Type 2024 & 2032
- Figure 79: Middle East and Africa Internet of Things in the Energy Market Revenue (Million), by Industry 2024 & 2032
- Figure 80: Middle East and Africa Internet of Things in the Energy Market Volume (K Unit), by Industry 2024 & 2032
- Figure 81: Middle East and Africa Internet of Things in the Energy Market Revenue Share (%), by Industry 2024 & 2032
- Figure 82: Middle East and Africa Internet of Things in the Energy Market Volume Share (%), by Industry 2024 & 2032
- Figure 83: Middle East and Africa Internet of Things in the Energy Market Revenue (Million), by Country 2024 & 2032
- Figure 84: Middle East and Africa Internet of Things in the Energy Market Volume (K Unit), by Country 2024 & 2032
- Figure 85: Middle East and Africa Internet of Things in the Energy Market Revenue Share (%), by Country 2024 & 2032
- Figure 86: Middle East and Africa Internet of Things in the Energy Market Volume Share (%), by Country 2024 & 2032
List of Tables
- Table 1: Global Internet of Things in the Energy Market Revenue Million Forecast, by Region 2019 & 2032
- Table 2: Global Internet of Things in the Energy Market Volume K Unit Forecast, by Region 2019 & 2032
- Table 3: Global Internet of Things in the Energy Market Revenue Million Forecast, by Type 2019 & 2032
- Table 4: Global Internet of Things in the Energy Market Volume K Unit Forecast, by Type 2019 & 2032
- Table 5: Global Internet of Things in the Energy Market Revenue Million Forecast, by Industry 2019 & 2032
- Table 6: Global Internet of Things in the Energy Market Volume K Unit Forecast, by Industry 2019 & 2032
- Table 7: Global Internet of Things in the Energy Market Revenue Million Forecast, by Region 2019 & 2032
- Table 8: Global Internet of Things in the Energy Market Volume K Unit Forecast, by Region 2019 & 2032
- Table 9: Global Internet of Things in the Energy Market Revenue Million Forecast, by Country 2019 & 2032
- Table 10: Global Internet of Things in the Energy Market Volume K Unit Forecast, by Country 2019 & 2032
- Table 11: United States Internet of Things in the Energy Market Revenue (Million) Forecast, by Application 2019 & 2032
- Table 12: United States Internet of Things in the Energy Market Volume (K Unit) Forecast, by Application 2019 & 2032
- Table 13: Canada Internet of Things in the Energy Market Revenue (Million) Forecast, by Application 2019 & 2032
- Table 14: Canada Internet of Things in the Energy Market Volume (K Unit) Forecast, by Application 2019 & 2032
- Table 15: Mexico Internet of Things in the Energy Market Revenue (Million) Forecast, by Application 2019 & 2032
- Table 16: Mexico Internet of Things in the Energy Market Volume (K Unit) Forecast, by Application 2019 & 2032
- Table 17: Global Internet of Things in the Energy Market Revenue Million Forecast, by Country 2019 & 2032
- Table 18: Global Internet of Things in the Energy Market Volume K Unit Forecast, by Country 2019 & 2032
- Table 19: Germany Internet of Things in the Energy Market Revenue (Million) Forecast, by Application 2019 & 2032
- Table 20: Germany Internet of Things in the Energy Market Volume (K Unit) Forecast, by Application 2019 & 2032
- Table 21: United Kingdom Internet of Things in the Energy Market Revenue (Million) Forecast, by Application 2019 & 2032
- Table 22: United Kingdom Internet of Things in the Energy Market Volume (K Unit) Forecast, by Application 2019 & 2032
- Table 23: France Internet of Things in the Energy Market Revenue (Million) Forecast, by Application 2019 & 2032
- Table 24: France Internet of Things in the Energy Market Volume (K Unit) Forecast, by Application 2019 & 2032
- Table 25: Spain Internet of Things in the Energy Market Revenue (Million) Forecast, by Application 2019 & 2032
- Table 26: Spain Internet of Things in the Energy Market Volume (K Unit) Forecast, by Application 2019 & 2032
- Table 27: Italy Internet of Things in the Energy Market Revenue (Million) Forecast, by Application 2019 & 2032
- Table 28: Italy Internet of Things in the Energy Market Volume (K Unit) Forecast, by Application 2019 & 2032
- Table 29: Spain Internet of Things in the Energy Market Revenue (Million) Forecast, by Application 2019 & 2032
- Table 30: Spain Internet of Things in the Energy Market Volume (K Unit) Forecast, by Application 2019 & 2032
- Table 31: Belgium Internet of Things in the Energy Market Revenue (Million) Forecast, by Application 2019 & 2032
- Table 32: Belgium Internet of Things in the Energy Market Volume (K Unit) Forecast, by Application 2019 & 2032
- Table 33: Netherland Internet of Things in the Energy Market Revenue (Million) Forecast, by Application 2019 & 2032
- Table 34: Netherland Internet of Things in the Energy Market Volume (K Unit) Forecast, by Application 2019 & 2032
- Table 35: Nordics Internet of Things in the Energy Market Revenue (Million) Forecast, by Application 2019 & 2032
- Table 36: Nordics Internet of Things in the Energy Market Volume (K Unit) Forecast, by Application 2019 & 2032
- Table 37: Rest of Europe Internet of Things in the Energy Market Revenue (Million) Forecast, by Application 2019 & 2032
- Table 38: Rest of Europe Internet of Things in the Energy Market Volume (K Unit) Forecast, by Application 2019 & 2032
- Table 39: Global Internet of Things in the Energy Market Revenue Million Forecast, by Country 2019 & 2032
- Table 40: Global Internet of Things in the Energy Market Volume K Unit Forecast, by Country 2019 & 2032
- Table 41: China Internet of Things in the Energy Market Revenue (Million) Forecast, by Application 2019 & 2032
- Table 42: China Internet of Things in the Energy Market Volume (K Unit) Forecast, by Application 2019 & 2032
- Table 43: Japan Internet of Things in the Energy Market Revenue (Million) Forecast, by Application 2019 & 2032
- Table 44: Japan Internet of Things in the Energy Market Volume (K Unit) Forecast, by Application 2019 & 2032
- Table 45: India Internet of Things in the Energy Market Revenue (Million) Forecast, by Application 2019 & 2032
- Table 46: India Internet of Things in the Energy Market Volume (K Unit) Forecast, by Application 2019 & 2032
- Table 47: South Korea Internet of Things in the Energy Market Revenue (Million) Forecast, by Application 2019 & 2032
- Table 48: South Korea Internet of Things in the Energy Market Volume (K Unit) Forecast, by Application 2019 & 2032
- Table 49: Southeast Asia Internet of Things in the Energy Market Revenue (Million) Forecast, by Application 2019 & 2032
- Table 50: Southeast Asia Internet of Things in the Energy Market Volume (K Unit) Forecast, by Application 2019 & 2032
- Table 51: Australia Internet of Things in the Energy Market Revenue (Million) Forecast, by Application 2019 & 2032
- Table 52: Australia Internet of Things in the Energy Market Volume (K Unit) Forecast, by Application 2019 & 2032
- Table 53: Indonesia Internet of Things in the Energy Market Revenue (Million) Forecast, by Application 2019 & 2032
- Table 54: Indonesia Internet of Things in the Energy Market Volume (K Unit) Forecast, by Application 2019 & 2032
- Table 55: Phillipes Internet of Things in the Energy Market Revenue (Million) Forecast, by Application 2019 & 2032
- Table 56: Phillipes Internet of Things in the Energy Market Volume (K Unit) Forecast, by Application 2019 & 2032
- Table 57: Singapore Internet of Things in the Energy Market Revenue (Million) Forecast, by Application 2019 & 2032
- Table 58: Singapore Internet of Things in the Energy Market Volume (K Unit) Forecast, by Application 2019 & 2032
- Table 59: Thailandc Internet of Things in the Energy Market Revenue (Million) Forecast, by Application 2019 & 2032
- Table 60: Thailandc Internet of Things in the Energy Market Volume (K Unit) Forecast, by Application 2019 & 2032
- Table 61: Rest of Asia Pacific Internet of Things in the Energy Market Revenue (Million) Forecast, by Application 2019 & 2032
- Table 62: Rest of Asia Pacific Internet of Things in the Energy Market Volume (K Unit) Forecast, by Application 2019 & 2032
- Table 63: Global Internet of Things in the Energy Market Revenue Million Forecast, by Country 2019 & 2032
- Table 64: Global Internet of Things in the Energy Market Volume K Unit Forecast, by Country 2019 & 2032
- Table 65: Brazil Internet of Things in the Energy Market Revenue (Million) Forecast, by Application 2019 & 2032
- Table 66: Brazil Internet of Things in the Energy Market Volume (K Unit) Forecast, by Application 2019 & 2032
- Table 67: Argentina Internet of Things in the Energy Market Revenue (Million) Forecast, by Application 2019 & 2032
- Table 68: Argentina Internet of Things in the Energy Market Volume (K Unit) Forecast, by Application 2019 & 2032
- Table 69: Peru Internet of Things in the Energy Market Revenue (Million) Forecast, by Application 2019 & 2032
- Table 70: Peru Internet of Things in the Energy Market Volume (K Unit) Forecast, by Application 2019 & 2032
- Table 71: Chile Internet of Things in the Energy Market Revenue (Million) Forecast, by Application 2019 & 2032
- Table 72: Chile Internet of Things in the Energy Market Volume (K Unit) Forecast, by Application 2019 & 2032
- Table 73: Colombia Internet of Things in the Energy Market Revenue (Million) Forecast, by Application 2019 & 2032
- Table 74: Colombia Internet of Things in the Energy Market Volume (K Unit) Forecast, by Application 2019 & 2032
- Table 75: Ecuador Internet of Things in the Energy Market Revenue (Million) Forecast, by Application 2019 & 2032
- Table 76: Ecuador Internet of Things in the Energy Market Volume (K Unit) Forecast, by Application 2019 & 2032
- Table 77: Venezuela Internet of Things in the Energy Market Revenue (Million) Forecast, by Application 2019 & 2032
- Table 78: Venezuela Internet of Things in the Energy Market Volume (K Unit) Forecast, by Application 2019 & 2032
- Table 79: Rest of South America Internet of Things in the Energy Market Revenue (Million) Forecast, by Application 2019 & 2032
- Table 80: Rest of South America Internet of Things in the Energy Market Volume (K Unit) Forecast, by Application 2019 & 2032
- Table 81: Global Internet of Things in the Energy Market Revenue Million Forecast, by Country 2019 & 2032
- Table 82: Global Internet of Things in the Energy Market Volume K Unit Forecast, by Country 2019 & 2032
- Table 83: United States Internet of Things in the Energy Market Revenue (Million) Forecast, by Application 2019 & 2032
- Table 84: United States Internet of Things in the Energy Market Volume (K Unit) Forecast, by Application 2019 & 2032
- Table 85: Canada Internet of Things in the Energy Market Revenue (Million) Forecast, by Application 2019 & 2032
- Table 86: Canada Internet of Things in the Energy Market Volume (K Unit) Forecast, by Application 2019 & 2032
- Table 87: Mexico Internet of Things in the Energy Market Revenue (Million) Forecast, by Application 2019 & 2032
- Table 88: Mexico Internet of Things in the Energy Market Volume (K Unit) Forecast, by Application 2019 & 2032
- Table 89: Global Internet of Things in the Energy Market Revenue Million Forecast, by Country 2019 & 2032
- Table 90: Global Internet of Things in the Energy Market Volume K Unit Forecast, by Country 2019 & 2032
- Table 91: United Arab Emirates Internet of Things in the Energy Market Revenue (Million) Forecast, by Application 2019 & 2032
- Table 92: United Arab Emirates Internet of Things in the Energy Market Volume (K Unit) Forecast, by Application 2019 & 2032
- Table 93: Saudi Arabia Internet of Things in the Energy Market Revenue (Million) Forecast, by Application 2019 & 2032
- Table 94: Saudi Arabia Internet of Things in the Energy Market Volume (K Unit) Forecast, by Application 2019 & 2032
- Table 95: South Africa Internet of Things in the Energy Market Revenue (Million) Forecast, by Application 2019 & 2032
- Table 96: South Africa Internet of Things in the Energy Market Volume (K Unit) Forecast, by Application 2019 & 2032
- Table 97: Rest of Middle East and Africa Internet of Things in the Energy Market Revenue (Million) Forecast, by Application 2019 & 2032
- Table 98: Rest of Middle East and Africa Internet of Things in the Energy Market Volume (K Unit) Forecast, by Application 2019 & 2032
- Table 99: Global Internet of Things in the Energy Market Revenue Million Forecast, by Type 2019 & 2032
- Table 100: Global Internet of Things in the Energy Market Volume K Unit Forecast, by Type 2019 & 2032
- Table 101: Global Internet of Things in the Energy Market Revenue Million Forecast, by Industry 2019 & 2032
- Table 102: Global Internet of Things in the Energy Market Volume K Unit Forecast, by Industry 2019 & 2032
- Table 103: Global Internet of Things in the Energy Market Revenue Million Forecast, by Country 2019 & 2032
- Table 104: Global Internet of Things in the Energy Market Volume K Unit Forecast, by Country 2019 & 2032
- Table 105: Global Internet of Things in the Energy Market Revenue Million Forecast, by Type 2019 & 2032
- Table 106: Global Internet of Things in the Energy Market Volume K Unit Forecast, by Type 2019 & 2032
- Table 107: Global Internet of Things in the Energy Market Revenue Million Forecast, by Industry 2019 & 2032
- Table 108: Global Internet of Things in the Energy Market Volume K Unit Forecast, by Industry 2019 & 2032
- Table 109: Global Internet of Things in the Energy Market Revenue Million Forecast, by Country 2019 & 2032
- Table 110: Global Internet of Things in the Energy Market Volume K Unit Forecast, by Country 2019 & 2032
- Table 111: Global Internet of Things in the Energy Market Revenue Million Forecast, by Type 2019 & 2032
- Table 112: Global Internet of Things in the Energy Market Volume K Unit Forecast, by Type 2019 & 2032
- Table 113: Global Internet of Things in the Energy Market Revenue Million Forecast, by Industry 2019 & 2032
- Table 114: Global Internet of Things in the Energy Market Volume K Unit Forecast, by Industry 2019 & 2032
- Table 115: Global Internet of Things in the Energy Market Revenue Million Forecast, by Country 2019 & 2032
- Table 116: Global Internet of Things in the Energy Market Volume K Unit Forecast, by Country 2019 & 2032
- Table 117: Global Internet of Things in the Energy Market Revenue Million Forecast, by Type 2019 & 2032
- Table 118: Global Internet of Things in the Energy Market Volume K Unit Forecast, by Type 2019 & 2032
- Table 119: Global Internet of Things in the Energy Market Revenue Million Forecast, by Industry 2019 & 2032
- Table 120: Global Internet of Things in the Energy Market Volume K Unit Forecast, by Industry 2019 & 2032
- Table 121: Global Internet of Things in the Energy Market Revenue Million Forecast, by Country 2019 & 2032
- Table 122: Global Internet of Things in the Energy Market Volume K Unit Forecast, by Country 2019 & 2032
- Table 123: Global Internet of Things in the Energy Market Revenue Million Forecast, by Type 2019 & 2032
- Table 124: Global Internet of Things in the Energy Market Volume K Unit Forecast, by Type 2019 & 2032
- Table 125: Global Internet of Things in the Energy Market Revenue Million Forecast, by Industry 2019 & 2032
- Table 126: Global Internet of Things in the Energy Market Volume K Unit Forecast, by Industry 2019 & 2032
- Table 127: Global Internet of Things in the Energy Market Revenue Million Forecast, by Country 2019 & 2032
- Table 128: Global Internet of Things in the Energy Market Volume K Unit Forecast, by Country 2019 & 2032
Frequently Asked Questions
1. What is the projected Compound Annual Growth Rate (CAGR) of the Internet of Things in the Energy Market?
The projected CAGR is approximately 10.00%.
2. Which companies are prominent players in the Internet of Things in the Energy Market?
Key companies in the market include Wind River Systems Inc, IBM Corporation, Maven Systems Private Limited, Cisco Systems Inc, Flutura Business Solutions LLC, Carriots SL, AGT International, SAP SE, Intel Corporation, Davra Networks.
3. What are the main segments of the Internet of Things in the Energy Market?
The market segments include Type , Industry.
4. Can you provide details about the market size?
The market size is estimated to be USD XX Million as of 2022.
5. What are some drivers contributing to market growth?
Increasing Awareness of Energy Consumption Control.
6. What are the notable trends driving market growth?
Smart Meters Expected to Hold Significant Share.
7. Are there any restraints impacting market growth?
High Risk Associated with Data.
8. Can you provide examples of recent developments in the market?
Nov 2022: With the subsequent development in indoor cellular networks, Huawei Technologies Co. Ltd started offering 5G distributed massive MIMO. To replicate Massive MIMO indoors, Huawei offers to coordinate distributed indoor radio networks like the enhanced antenna arrays of Massive MIMO.
9. What pricing options are available for accessing the report?
Pricing options include single-user, multi-user, and enterprise licenses priced at USD 4750, USD 5250, and USD 8750 respectively.
10. Is the market size provided in terms of value or volume?
The market size is provided in terms of value, measured in Million and volume, measured in K Unit.
11. Are there any specific market keywords associated with the report?
Yes, the market keyword associated with the report is "Internet of Things in the Energy Market," which aids in identifying and referencing the specific market segment covered.
12. How do I determine which pricing option suits my needs best?
The pricing options vary based on user requirements and access needs. Individual users may opt for single-user licenses, while businesses requiring broader access may choose multi-user or enterprise licenses for cost-effective access to the report.
13. Are there any additional resources or data provided in the Internet of Things in the Energy Market report?
While the report offers comprehensive insights, it's advisable to review the specific contents or supplementary materials provided to ascertain if additional resources or data are available.
14. How can I stay updated on further developments or reports in the Internet of Things in the Energy Market?
To stay informed about further developments, trends, and reports in the Internet of Things in the Energy Market, consider subscribing to industry newsletters, following relevant companies and organizations, or regularly checking reputable industry news sources and publications.
Methodology
Step 1 - Identification of Relevant Samples Size from Population Database


Step 2 - Approaches for Defining Global Market Size (Value, Volume* & Price*)

Note*: In applicable scenarios
Step 3 - Data Sources
Primary Research
- Web Analytics
- Survey Reports
- Research Institute
- Latest Research Reports
- Opinion Leaders
Secondary Research
- Annual Reports
- White Paper
- Latest Press Release
- Industry Association
- Paid Database
- Investor Presentations

Step 4 - Data Triangulation
Involves using different sources of information in order to increase the validity of a study
These sources are likely to be stakeholders in a program - participants, other researchers, program staff, other community members, and so on.
Then we put all data in single framework & apply various statistical tools to find out the dynamic on the market.
During the analysis stage, feedback from the stakeholder groups would be compared to determine areas of agreement as well as areas of divergence
