

Key Insights
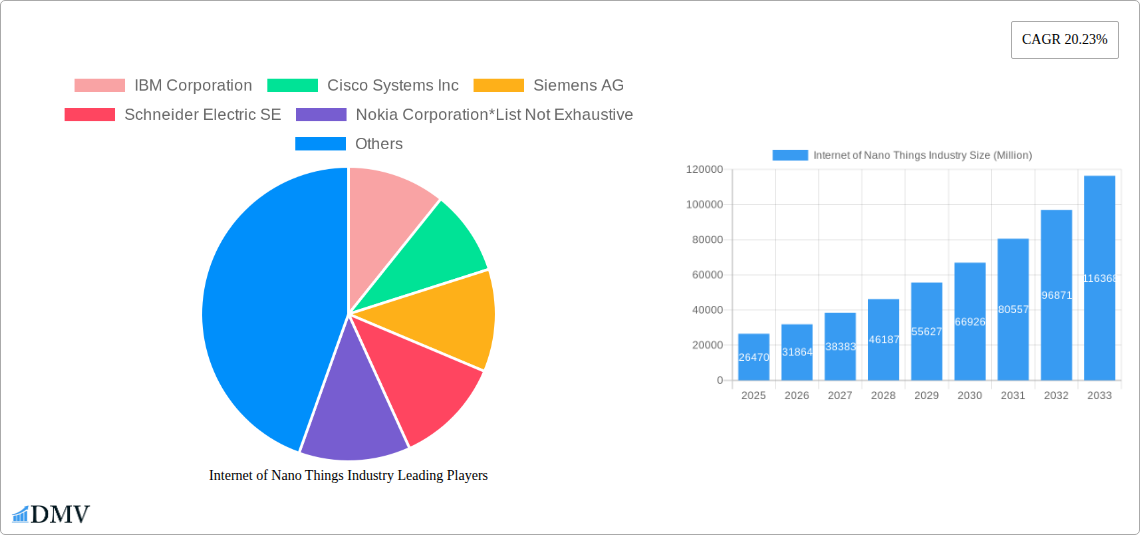
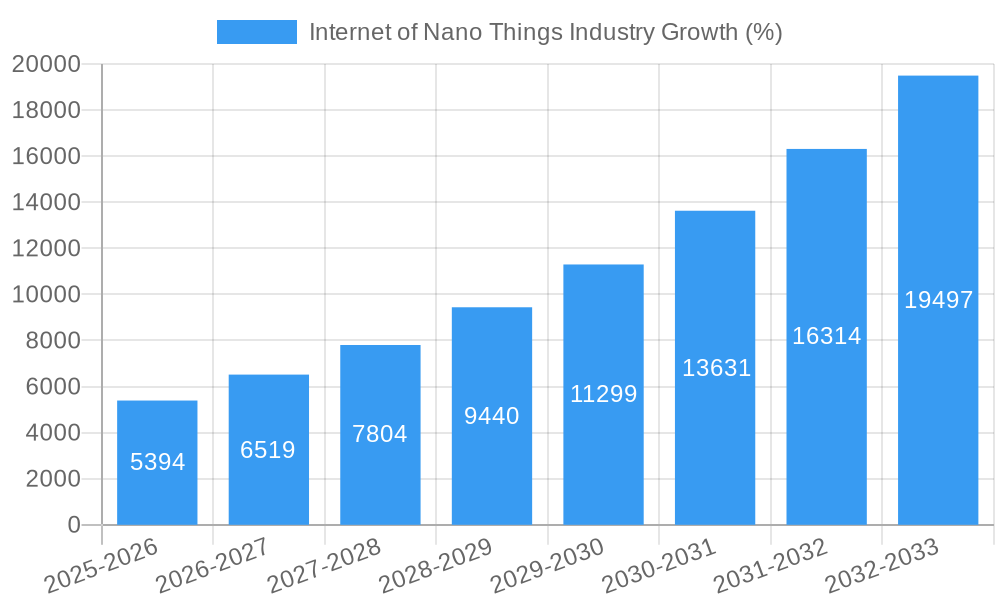
The Internet of Nano Things (IoNT) market is experiencing explosive growth, projected to reach $26.47 billion in 2025 and exhibiting a robust Compound Annual Growth Rate (CAGR) of 20.23%. This expansion is fueled by several key drivers. Advancements in nanotechnology are enabling the creation of increasingly smaller, more powerful, and energy-efficient sensors and actuators, opening up a vast array of applications across diverse sectors. The convergence of IoT technologies with nanotechnology is creating opportunities for real-time monitoring and control in areas previously inaccessible. Strong demand for improved efficiency, predictive maintenance, and enhanced product development is driving adoption across sectors like healthcare (personalized medicine, advanced diagnostics), logistics (smart supply chain management), manufacturing (process optimization, quality control), and energy (smart grids, renewable energy monitoring). Furthermore, government initiatives supporting research and development in nanotechnology and IoT are further accelerating market growth.
However, the IoNT market also faces challenges. High initial investment costs associated with research, development, and deployment of nano-scale devices can be a barrier to entry for smaller companies. Technical hurdles related to data transmission, data security, and device lifespan also need to be addressed to ensure widespread adoption. Standardization of protocols and interoperability across different nano-devices and platforms remains a critical challenge that needs collaborative industry efforts. Despite these restraints, the long-term growth prospects for IoNT are exceptionally positive, driven by ongoing technological advancements, increasing funding, and the inherent potential to revolutionize industries with precise, efficient, and cost-effective solutions. The market's segmentation by component (hardware, software, connectivity/services) and end-user (healthcare, logistics, defense, etc.) highlights the diverse applications and opportunities for growth across various sectors. Companies like IBM, Cisco, Siemens, and Qualcomm are at the forefront of innovation and are key players in shaping the future of this rapidly evolving market.
Internet of Nano Things (IoNT) Industry Market Report: 2019-2033
This comprehensive report provides a detailed analysis of the Internet of Nano Things (IoNT) industry, offering valuable insights for stakeholders seeking to understand market dynamics, growth trajectories, and future opportunities. The report covers the period from 2019 to 2033, with a focus on the forecast period of 2025-2033 and a base year of 2025. The global IoNT market is projected to reach xx Million by 2033, demonstrating substantial growth potential.
Internet of Nano Things Industry Market Composition & Trends
This section delves into the current state of the IoNT market, evaluating its concentration, innovation drivers, regulatory landscape, and competitive dynamics. The market is characterized by a relatively fragmented landscape, with several key players vying for market share. However, a high degree of innovation is accelerating growth.
Market Concentration & Competitive Landscape:
- Market share distribution: IBM Corporation, Cisco Systems Inc, and Siemens AG collectively hold an estimated 30% market share in 2025, while smaller players account for the remaining 70%. This suggests significant potential for consolidation and further market evolution.
- M&A Activity: The IoNT sector has seen xx Million in M&A deals between 2019-2024, signifying increasing strategic activity and market consolidation. Future activity is predicted to accelerate, fueled by technological advancements and the need for companies to acquire specialized expertise.
- Regulatory Landscape: The regulatory environment varies across different regions, presenting both opportunities and challenges to market players. Stringent regulations related to data privacy and security are crucial considerations.
Innovation Catalysts & Substitute Products:
- Advancements in nanotechnology and sensor technology are driving innovation.
- The development of new materials with enhanced functionalities is crucial for IoNT applications.
- The absence of significant substitute products currently strengthens the IoNT market’s growth trajectory.
Internet of Nano Things Industry Industry Evolution
The IoNT market is experiencing a period of rapid growth, driven by technological advancements and increasing demand across various sectors. The historical period (2019-2024) showed a Compound Annual Growth Rate (CAGR) of xx%, with projections for xx% CAGR from 2025 to 2033. This growth is fueled by a confluence of factors:
- The miniaturization of sensors and actuators has enabled the development of smaller, more powerful, and energy-efficient IoNT devices.
- Advances in wireless communication technologies, such as 5G and IoT protocols, are enhancing connectivity and data transfer capabilities.
- The rising adoption of IoNT devices across various industries, like healthcare, logistics, and manufacturing, is a major driving force. Specifically, the healthcare sector is projected to see a significant increase in IoNT adoption, driven by the need for remote patient monitoring and personalized medicine. Adoption is also influenced by consumer demand for greater convenience and efficiency.
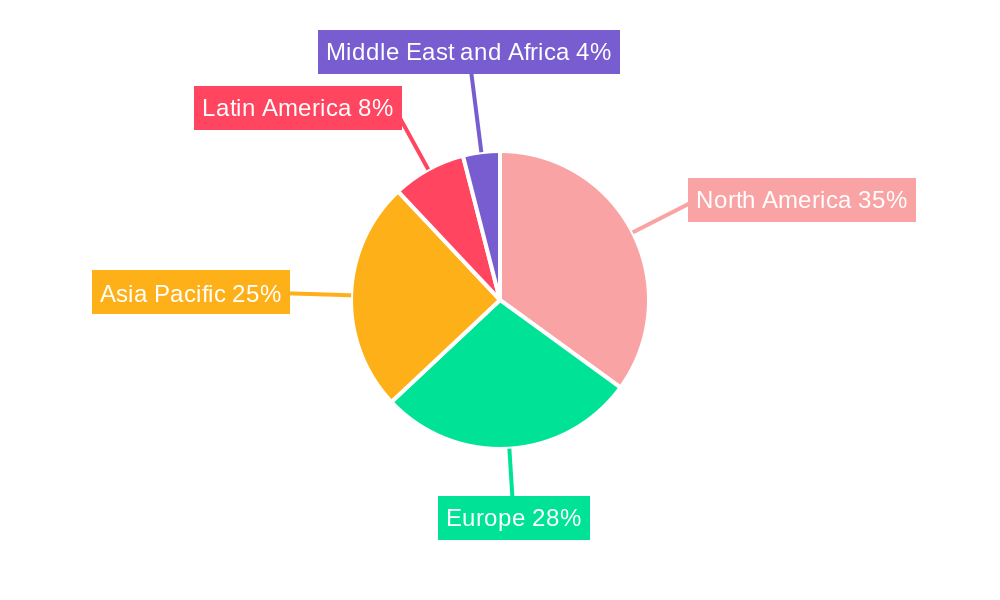
Leading Regions, Countries, or Segments in Internet of Nano Things Industry
North America currently holds the largest market share within the IoNT landscape, driven by significant investments in R&D and early adoption of new technologies. Asia-Pacific is predicted to experience the most rapid growth in the coming years, fueled by increasing industrialization and the expanding digital economy.
Key Drivers by Segment:
By Component:
- Hardware: High demand for miniaturized sensors and actuators, fueled by advancements in nanotechnology.
- Software: Increased demand for sophisticated data analytics and management tools.
- Connectivity/Services: Growth driven by expanding 5G and IoT infrastructure.
By End User:
- Healthcare: High growth projected, driven by the need for remote patient monitoring, personalized medicine, and improved diagnostics.
- Manufacturing: Adoption is increasing for enhanced production efficiency, predictive maintenance, and quality control.
- Logistics: IoNT technologies are improving supply chain visibility, efficiency, and security. Demand is also growing in the Defense and Aerospace, Energy and Power, and Retail sectors.
Internet of Nano Things Industry Product Innovations
Recent product innovations focus on enhancing sensor capabilities, improving data processing efficiency, and broadening applications across different sectors. For instance, the development of flexible and biocompatible sensors for healthcare applications is gaining prominence. Key innovations also involve enhanced energy harvesting techniques, boosting the operational lifespan of IoNT devices. This extends to advancements in AI-powered data analytics, which enable real-time insights from IoNT networks, opening up new possibilities for optimization across various industries.
Propelling Factors for Internet of Nano Things Industry Growth
Several factors are accelerating IoNT industry growth:
- Technological advancements: Continuous improvements in nanotechnology, sensor technology, and communication protocols.
- Economic drivers: Increased demand for efficiency and cost reduction across various sectors.
- Regulatory support: Government initiatives and funding programs promoting IoT and nanotechnology development.
Obstacles in the Internet of Nano Things Industry Market
The IoNT market faces several challenges:
- Regulatory hurdles: Varied regulatory frameworks across different regions present complexity for manufacturers and deployment.
- Supply chain disruptions: Global supply chain vulnerabilities can impact the availability of components.
- High initial investment costs: The substantial investment required for infrastructure setup and deployment can be a deterrent.
- Interoperability issues: Inconsistencies in communication protocols can hinder seamless data exchange among devices.
Future Opportunities in Internet of Nano Things Industry
The IoNT sector presents significant future opportunities:
- New market penetration: Expanding into emerging markets with untapped potential.
- Technological advancements: Exploring and integrating emerging technologies such as AI and machine learning.
- New applications: Discovering and developing novel applications in areas like environmental monitoring and smart agriculture.
Major Players in the Internet of Nano Things Industry Ecosystem
- IBM Corporation
- Cisco Systems Inc
- Siemens AG
- Schneider Electric SE
- Nokia Corporation
- Juniper Networks Inc
- Qualcomm Inc
- SAP SE
- Intel Corporation
Key Developments in Internet of Nano Things Industry Industry
- February 2023: Siemens Digital Industries Software launched an updated NX software, leveraging AI and advanced simulation capabilities. This significantly enhances design and manufacturing processes, boosting the efficiency and innovation capabilities of its user base.
- January 2023: Advanced Material Development (AMD) secured an InnovateUK grant for developing next-generation nanomaterial-based gas sensors. This validates the market potential for advanced sensor technologies and further contributes to the advancement of IoNT applications.
Strategic Internet of Nano Things Industry Market Forecast
The IoNT market is poised for continued robust growth, fueled by technological breakthroughs, rising demand across diverse sectors, and supportive regulatory environments. The convergence of technologies like AI, 5G, and advanced materials will further enhance the capabilities of IoNT devices, unlocking new opportunities in diverse applications. This will lead to substantial market expansion across various regions, creating exciting avenues for innovation and investment in the years to come.
Internet of Nano Things Industry Segmentation
-
1. Component
- 1.1. Hardware
- 1.2. Software
- 1.3. Connectivity/Services
-
2. End User
- 2.1. Healthcare
- 2.2. Logistics
- 2.3. Defense and Aerospace
- 2.4. Manufacturing
- 2.5. Energy and Power
- 2.6. Retail
- 2.7. Other End Users
Internet of Nano Things Industry Segmentation By Geography
- 1. North America
- 2. Europe
- 3. Asia
- 4. Australia and New Zealand
- 5. Latin America
- 6. Middle East and Africa
Internet of Nano Things Industry REPORT HIGHLIGHTS
| Aspects | Details |
|---|---|
| Study Period | 2019-2033 |
| Base Year | 2024 |
| Estimated Year | 2025 |
| Forecast Period | 2025-2033 |
| Historical Period | 2019-2024 |
| Growth Rate | CAGR of 20.23% from 2019-2033 |
| Segmentation |
|
Table of Contents
- 1. Introduction
- 1.1. Research Scope
- 1.2. Market Segmentation
- 1.3. Research Methodology
- 1.4. Definitions and Assumptions
- 2. Executive Summary
- 2.1. Introduction
- 3. Market Dynamics
- 3.1. Introduction
- 3.2. Market Drivers
- 3.2.1. Wide Connectivity in Devices; Emergence of Nanotechnology
- 3.3. Market Restrains
- 3.3.1. Security Concerns; High Costs of the Technology
- 3.4. Market Trends
- 3.4.1. Healthcare Industry is Expected to Hold a Significant Share
- 4. Market Factor Analysis
- 4.1. Porters Five Forces
- 4.2. Supply/Value Chain
- 4.3. PESTEL analysis
- 4.4. Market Entropy
- 4.5. Patent/Trademark Analysis
- 5. Global Internet of Nano Things Industry Analysis, Insights and Forecast, 2019-2031
- 5.1. Market Analysis, Insights and Forecast - by Component
- 5.1.1. Hardware
- 5.1.2. Software
- 5.1.3. Connectivity/Services
- 5.2. Market Analysis, Insights and Forecast - by End User
- 5.2.1. Healthcare
- 5.2.2. Logistics
- 5.2.3. Defense and Aerospace
- 5.2.4. Manufacturing
- 5.2.5. Energy and Power
- 5.2.6. Retail
- 5.2.7. Other End Users
- 5.3. Market Analysis, Insights and Forecast - by Region
- 5.3.1. North America
- 5.3.2. Europe
- 5.3.3. Asia
- 5.3.4. Australia and New Zealand
- 5.3.5. Latin America
- 5.3.6. Middle East and Africa
- 5.1. Market Analysis, Insights and Forecast - by Component
- 6. North America Internet of Nano Things Industry Analysis, Insights and Forecast, 2019-2031
- 6.1. Market Analysis, Insights and Forecast - by Component
- 6.1.1. Hardware
- 6.1.2. Software
- 6.1.3. Connectivity/Services
- 6.2. Market Analysis, Insights and Forecast - by End User
- 6.2.1. Healthcare
- 6.2.2. Logistics
- 6.2.3. Defense and Aerospace
- 6.2.4. Manufacturing
- 6.2.5. Energy and Power
- 6.2.6. Retail
- 6.2.7. Other End Users
- 6.1. Market Analysis, Insights and Forecast - by Component
- 7. Europe Internet of Nano Things Industry Analysis, Insights and Forecast, 2019-2031
- 7.1. Market Analysis, Insights and Forecast - by Component
- 7.1.1. Hardware
- 7.1.2. Software
- 7.1.3. Connectivity/Services
- 7.2. Market Analysis, Insights and Forecast - by End User
- 7.2.1. Healthcare
- 7.2.2. Logistics
- 7.2.3. Defense and Aerospace
- 7.2.4. Manufacturing
- 7.2.5. Energy and Power
- 7.2.6. Retail
- 7.2.7. Other End Users
- 7.1. Market Analysis, Insights and Forecast - by Component
- 8. Asia Internet of Nano Things Industry Analysis, Insights and Forecast, 2019-2031
- 8.1. Market Analysis, Insights and Forecast - by Component
- 8.1.1. Hardware
- 8.1.2. Software
- 8.1.3. Connectivity/Services
- 8.2. Market Analysis, Insights and Forecast - by End User
- 8.2.1. Healthcare
- 8.2.2. Logistics
- 8.2.3. Defense and Aerospace
- 8.2.4. Manufacturing
- 8.2.5. Energy and Power
- 8.2.6. Retail
- 8.2.7. Other End Users
- 8.1. Market Analysis, Insights and Forecast - by Component
- 9. Australia and New Zealand Internet of Nano Things Industry Analysis, Insights and Forecast, 2019-2031
- 9.1. Market Analysis, Insights and Forecast - by Component
- 9.1.1. Hardware
- 9.1.2. Software
- 9.1.3. Connectivity/Services
- 9.2. Market Analysis, Insights and Forecast - by End User
- 9.2.1. Healthcare
- 9.2.2. Logistics
- 9.2.3. Defense and Aerospace
- 9.2.4. Manufacturing
- 9.2.5. Energy and Power
- 9.2.6. Retail
- 9.2.7. Other End Users
- 9.1. Market Analysis, Insights and Forecast - by Component
- 10. Latin America Internet of Nano Things Industry Analysis, Insights and Forecast, 2019-2031
- 10.1. Market Analysis, Insights and Forecast - by Component
- 10.1.1. Hardware
- 10.1.2. Software
- 10.1.3. Connectivity/Services
- 10.2. Market Analysis, Insights and Forecast - by End User
- 10.2.1. Healthcare
- 10.2.2. Logistics
- 10.2.3. Defense and Aerospace
- 10.2.4. Manufacturing
- 10.2.5. Energy and Power
- 10.2.6. Retail
- 10.2.7. Other End Users
- 10.1. Market Analysis, Insights and Forecast - by Component
- 11. Middle East and Africa Internet of Nano Things Industry Analysis, Insights and Forecast, 2019-2031
- 11.1. Market Analysis, Insights and Forecast - by Component
- 11.1.1. Hardware
- 11.1.2. Software
- 11.1.3. Connectivity/Services
- 11.2. Market Analysis, Insights and Forecast - by End User
- 11.2.1. Healthcare
- 11.2.2. Logistics
- 11.2.3. Defense and Aerospace
- 11.2.4. Manufacturing
- 11.2.5. Energy and Power
- 11.2.6. Retail
- 11.2.7. Other End Users
- 11.1. Market Analysis, Insights and Forecast - by Component
- 12. North America Internet of Nano Things Industry Analysis, Insights and Forecast, 2019-2031
- 12.1. Market Analysis, Insights and Forecast - By Country/Sub-region
- 12.1.1.
- 13. Europe Internet of Nano Things Industry Analysis, Insights and Forecast, 2019-2031
- 13.1. Market Analysis, Insights and Forecast - By Country/Sub-region
- 13.1.1.
- 14. Asia Pacific Internet of Nano Things Industry Analysis, Insights and Forecast, 2019-2031
- 14.1. Market Analysis, Insights and Forecast - By Country/Sub-region
- 14.1.1.
- 15. Latin America Internet of Nano Things Industry Analysis, Insights and Forecast, 2019-2031
- 15.1. Market Analysis, Insights and Forecast - By Country/Sub-region
- 15.1.1.
- 16. Middle East and Africa Internet of Nano Things Industry Analysis, Insights and Forecast, 2019-2031
- 16.1. Market Analysis, Insights and Forecast - By Country/Sub-region
- 16.1.1.
- 17. Competitive Analysis
- 17.1. Global Market Share Analysis 2024
- 17.2. Company Profiles
- 17.2.1 IBM Corporation
- 17.2.1.1. Overview
- 17.2.1.2. Products
- 17.2.1.3. SWOT Analysis
- 17.2.1.4. Recent Developments
- 17.2.1.5. Financials (Based on Availability)
- 17.2.2 Cisco Systems Inc
- 17.2.2.1. Overview
- 17.2.2.2. Products
- 17.2.2.3. SWOT Analysis
- 17.2.2.4. Recent Developments
- 17.2.2.5. Financials (Based on Availability)
- 17.2.3 Siemens AG
- 17.2.3.1. Overview
- 17.2.3.2. Products
- 17.2.3.3. SWOT Analysis
- 17.2.3.4. Recent Developments
- 17.2.3.5. Financials (Based on Availability)
- 17.2.4 Schneider Electric SE
- 17.2.4.1. Overview
- 17.2.4.2. Products
- 17.2.4.3. SWOT Analysis
- 17.2.4.4. Recent Developments
- 17.2.4.5. Financials (Based on Availability)
- 17.2.5 Nokia Corporation*List Not Exhaustive
- 17.2.5.1. Overview
- 17.2.5.2. Products
- 17.2.5.3. SWOT Analysis
- 17.2.5.4. Recent Developments
- 17.2.5.5. Financials (Based on Availability)
- 17.2.6 Juniper Networks Inc
- 17.2.6.1. Overview
- 17.2.6.2. Products
- 17.2.6.3. SWOT Analysis
- 17.2.6.4. Recent Developments
- 17.2.6.5. Financials (Based on Availability)
- 17.2.7 Qualcomm Inc
- 17.2.7.1. Overview
- 17.2.7.2. Products
- 17.2.7.3. SWOT Analysis
- 17.2.7.4. Recent Developments
- 17.2.7.5. Financials (Based on Availability)
- 17.2.8 SAP SE
- 17.2.8.1. Overview
- 17.2.8.2. Products
- 17.2.8.3. SWOT Analysis
- 17.2.8.4. Recent Developments
- 17.2.8.5. Financials (Based on Availability)
- 17.2.9 Intel Corporation
- 17.2.9.1. Overview
- 17.2.9.2. Products
- 17.2.9.3. SWOT Analysis
- 17.2.9.4. Recent Developments
- 17.2.9.5. Financials (Based on Availability)
- 17.2.1 IBM Corporation
List of Figures
- Figure 1: Global Internet of Nano Things Industry Revenue Breakdown (Million, %) by Region 2024 & 2032
- Figure 2: North America Internet of Nano Things Industry Revenue (Million), by Country 2024 & 2032
- Figure 3: North America Internet of Nano Things Industry Revenue Share (%), by Country 2024 & 2032
- Figure 4: Europe Internet of Nano Things Industry Revenue (Million), by Country 2024 & 2032
- Figure 5: Europe Internet of Nano Things Industry Revenue Share (%), by Country 2024 & 2032
- Figure 6: Asia Pacific Internet of Nano Things Industry Revenue (Million), by Country 2024 & 2032
- Figure 7: Asia Pacific Internet of Nano Things Industry Revenue Share (%), by Country 2024 & 2032
- Figure 8: Latin America Internet of Nano Things Industry Revenue (Million), by Country 2024 & 2032
- Figure 9: Latin America Internet of Nano Things Industry Revenue Share (%), by Country 2024 & 2032
- Figure 10: Middle East and Africa Internet of Nano Things Industry Revenue (Million), by Country 2024 & 2032
- Figure 11: Middle East and Africa Internet of Nano Things Industry Revenue Share (%), by Country 2024 & 2032
- Figure 12: North America Internet of Nano Things Industry Revenue (Million), by Component 2024 & 2032
- Figure 13: North America Internet of Nano Things Industry Revenue Share (%), by Component 2024 & 2032
- Figure 14: North America Internet of Nano Things Industry Revenue (Million), by End User 2024 & 2032
- Figure 15: North America Internet of Nano Things Industry Revenue Share (%), by End User 2024 & 2032
- Figure 16: North America Internet of Nano Things Industry Revenue (Million), by Country 2024 & 2032
- Figure 17: North America Internet of Nano Things Industry Revenue Share (%), by Country 2024 & 2032
- Figure 18: Europe Internet of Nano Things Industry Revenue (Million), by Component 2024 & 2032
- Figure 19: Europe Internet of Nano Things Industry Revenue Share (%), by Component 2024 & 2032
- Figure 20: Europe Internet of Nano Things Industry Revenue (Million), by End User 2024 & 2032
- Figure 21: Europe Internet of Nano Things Industry Revenue Share (%), by End User 2024 & 2032
- Figure 22: Europe Internet of Nano Things Industry Revenue (Million), by Country 2024 & 2032
- Figure 23: Europe Internet of Nano Things Industry Revenue Share (%), by Country 2024 & 2032
- Figure 24: Asia Internet of Nano Things Industry Revenue (Million), by Component 2024 & 2032
- Figure 25: Asia Internet of Nano Things Industry Revenue Share (%), by Component 2024 & 2032
- Figure 26: Asia Internet of Nano Things Industry Revenue (Million), by End User 2024 & 2032
- Figure 27: Asia Internet of Nano Things Industry Revenue Share (%), by End User 2024 & 2032
- Figure 28: Asia Internet of Nano Things Industry Revenue (Million), by Country 2024 & 2032
- Figure 29: Asia Internet of Nano Things Industry Revenue Share (%), by Country 2024 & 2032
- Figure 30: Australia and New Zealand Internet of Nano Things Industry Revenue (Million), by Component 2024 & 2032
- Figure 31: Australia and New Zealand Internet of Nano Things Industry Revenue Share (%), by Component 2024 & 2032
- Figure 32: Australia and New Zealand Internet of Nano Things Industry Revenue (Million), by End User 2024 & 2032
- Figure 33: Australia and New Zealand Internet of Nano Things Industry Revenue Share (%), by End User 2024 & 2032
- Figure 34: Australia and New Zealand Internet of Nano Things Industry Revenue (Million), by Country 2024 & 2032
- Figure 35: Australia and New Zealand Internet of Nano Things Industry Revenue Share (%), by Country 2024 & 2032
- Figure 36: Latin America Internet of Nano Things Industry Revenue (Million), by Component 2024 & 2032
- Figure 37: Latin America Internet of Nano Things Industry Revenue Share (%), by Component 2024 & 2032
- Figure 38: Latin America Internet of Nano Things Industry Revenue (Million), by End User 2024 & 2032
- Figure 39: Latin America Internet of Nano Things Industry Revenue Share (%), by End User 2024 & 2032
- Figure 40: Latin America Internet of Nano Things Industry Revenue (Million), by Country 2024 & 2032
- Figure 41: Latin America Internet of Nano Things Industry Revenue Share (%), by Country 2024 & 2032
- Figure 42: Middle East and Africa Internet of Nano Things Industry Revenue (Million), by Component 2024 & 2032
- Figure 43: Middle East and Africa Internet of Nano Things Industry Revenue Share (%), by Component 2024 & 2032
- Figure 44: Middle East and Africa Internet of Nano Things Industry Revenue (Million), by End User 2024 & 2032
- Figure 45: Middle East and Africa Internet of Nano Things Industry Revenue Share (%), by End User 2024 & 2032
- Figure 46: Middle East and Africa Internet of Nano Things Industry Revenue (Million), by Country 2024 & 2032
- Figure 47: Middle East and Africa Internet of Nano Things Industry Revenue Share (%), by Country 2024 & 2032
List of Tables
- Table 1: Global Internet of Nano Things Industry Revenue Million Forecast, by Region 2019 & 2032
- Table 2: Global Internet of Nano Things Industry Revenue Million Forecast, by Component 2019 & 2032
- Table 3: Global Internet of Nano Things Industry Revenue Million Forecast, by End User 2019 & 2032
- Table 4: Global Internet of Nano Things Industry Revenue Million Forecast, by Region 2019 & 2032
- Table 5: Global Internet of Nano Things Industry Revenue Million Forecast, by Country 2019 & 2032
- Table 6: Internet of Nano Things Industry Revenue (Million) Forecast, by Application 2019 & 2032
- Table 7: Global Internet of Nano Things Industry Revenue Million Forecast, by Country 2019 & 2032
- Table 8: Internet of Nano Things Industry Revenue (Million) Forecast, by Application 2019 & 2032
- Table 9: Global Internet of Nano Things Industry Revenue Million Forecast, by Country 2019 & 2032
- Table 10: Internet of Nano Things Industry Revenue (Million) Forecast, by Application 2019 & 2032
- Table 11: Global Internet of Nano Things Industry Revenue Million Forecast, by Country 2019 & 2032
- Table 12: Internet of Nano Things Industry Revenue (Million) Forecast, by Application 2019 & 2032
- Table 13: Global Internet of Nano Things Industry Revenue Million Forecast, by Country 2019 & 2032
- Table 14: Internet of Nano Things Industry Revenue (Million) Forecast, by Application 2019 & 2032
- Table 15: Global Internet of Nano Things Industry Revenue Million Forecast, by Component 2019 & 2032
- Table 16: Global Internet of Nano Things Industry Revenue Million Forecast, by End User 2019 & 2032
- Table 17: Global Internet of Nano Things Industry Revenue Million Forecast, by Country 2019 & 2032
- Table 18: Global Internet of Nano Things Industry Revenue Million Forecast, by Component 2019 & 2032
- Table 19: Global Internet of Nano Things Industry Revenue Million Forecast, by End User 2019 & 2032
- Table 20: Global Internet of Nano Things Industry Revenue Million Forecast, by Country 2019 & 2032
- Table 21: Global Internet of Nano Things Industry Revenue Million Forecast, by Component 2019 & 2032
- Table 22: Global Internet of Nano Things Industry Revenue Million Forecast, by End User 2019 & 2032
- Table 23: Global Internet of Nano Things Industry Revenue Million Forecast, by Country 2019 & 2032
- Table 24: Global Internet of Nano Things Industry Revenue Million Forecast, by Component 2019 & 2032
- Table 25: Global Internet of Nano Things Industry Revenue Million Forecast, by End User 2019 & 2032
- Table 26: Global Internet of Nano Things Industry Revenue Million Forecast, by Country 2019 & 2032
- Table 27: Global Internet of Nano Things Industry Revenue Million Forecast, by Component 2019 & 2032
- Table 28: Global Internet of Nano Things Industry Revenue Million Forecast, by End User 2019 & 2032
- Table 29: Global Internet of Nano Things Industry Revenue Million Forecast, by Country 2019 & 2032
- Table 30: Global Internet of Nano Things Industry Revenue Million Forecast, by Component 2019 & 2032
- Table 31: Global Internet of Nano Things Industry Revenue Million Forecast, by End User 2019 & 2032
- Table 32: Global Internet of Nano Things Industry Revenue Million Forecast, by Country 2019 & 2032
Frequently Asked Questions
1. What is the projected Compound Annual Growth Rate (CAGR) of the Internet of Nano Things Industry?
The projected CAGR is approximately 20.23%.
2. Which companies are prominent players in the Internet of Nano Things Industry?
Key companies in the market include IBM Corporation, Cisco Systems Inc, Siemens AG, Schneider Electric SE, Nokia Corporation*List Not Exhaustive, Juniper Networks Inc, Qualcomm Inc, SAP SE, Intel Corporation.
3. What are the main segments of the Internet of Nano Things Industry?
The market segments include Component, End User.
4. Can you provide details about the market size?
The market size is estimated to be USD 26.47 Million as of 2022.
5. What are some drivers contributing to market growth?
Wide Connectivity in Devices; Emergence of Nanotechnology.
6. What are the notable trends driving market growth?
Healthcare Industry is Expected to Hold a Significant Share.
7. Are there any restraints impacting market growth?
Security Concerns; High Costs of the Technology.
8. Can you provide examples of recent developments in the market?
February 2023: Siemens Digital Industries Software launched the latest update of its industry-leading NX software, part of the Xcelerator portfolio of software and services. The newest update of NX software leverages advanced technologies, such as artificial intelligence (AI) and advanced simulation capabilities, while continuing to invest in significant productivity and capability enhancements to enable its community of designers, engineers, and manufacturers to innovate more quickly.
9. What pricing options are available for accessing the report?
Pricing options include single-user, multi-user, and enterprise licenses priced at USD 4750, USD 5250, and USD 8750 respectively.
10. Is the market size provided in terms of value or volume?
The market size is provided in terms of value, measured in Million.
11. Are there any specific market keywords associated with the report?
Yes, the market keyword associated with the report is "Internet of Nano Things Industry," which aids in identifying and referencing the specific market segment covered.
12. How do I determine which pricing option suits my needs best?
The pricing options vary based on user requirements and access needs. Individual users may opt for single-user licenses, while businesses requiring broader access may choose multi-user or enterprise licenses for cost-effective access to the report.
13. Are there any additional resources or data provided in the Internet of Nano Things Industry report?
While the report offers comprehensive insights, it's advisable to review the specific contents or supplementary materials provided to ascertain if additional resources or data are available.
14. How can I stay updated on further developments or reports in the Internet of Nano Things Industry?
To stay informed about further developments, trends, and reports in the Internet of Nano Things Industry, consider subscribing to industry newsletters, following relevant companies and organizations, or regularly checking reputable industry news sources and publications.
Methodology
Step 1 - Identification of Relevant Samples Size from Population Database


Step 2 - Approaches for Defining Global Market Size (Value, Volume* & Price*)

Note*: In applicable scenarios
Step 3 - Data Sources
Primary Research
- Web Analytics
- Survey Reports
- Research Institute
- Latest Research Reports
- Opinion Leaders
Secondary Research
- Annual Reports
- White Paper
- Latest Press Release
- Industry Association
- Paid Database
- Investor Presentations

Step 4 - Data Triangulation
Involves using different sources of information in order to increase the validity of a study
These sources are likely to be stakeholders in a program - participants, other researchers, program staff, other community members, and so on.
Then we put all data in single framework & apply various statistical tools to find out the dynamic on the market.
During the analysis stage, feedback from the stakeholder groups would be compared to determine areas of agreement as well as areas of divergence
