

Key Insights
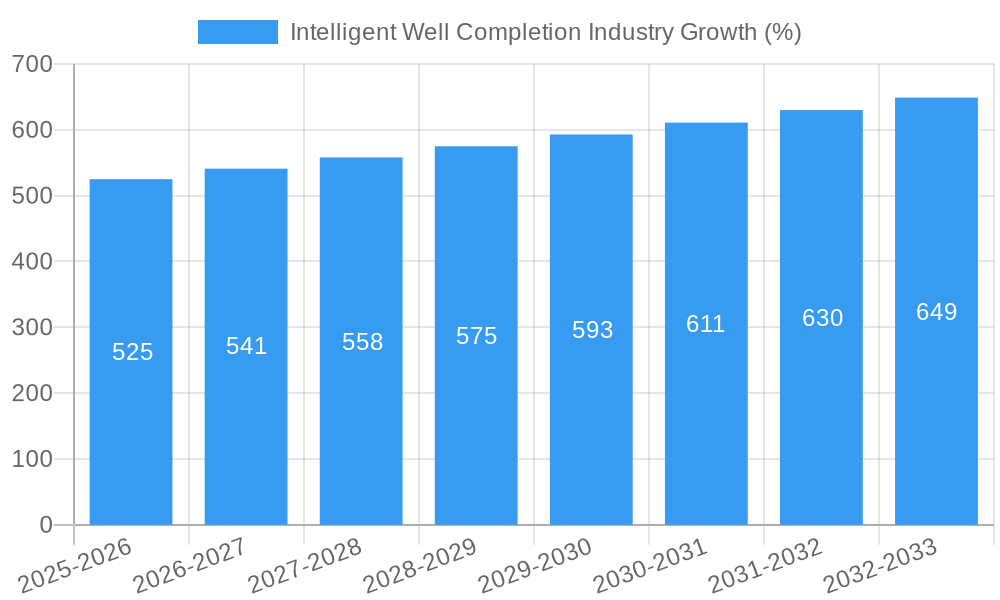
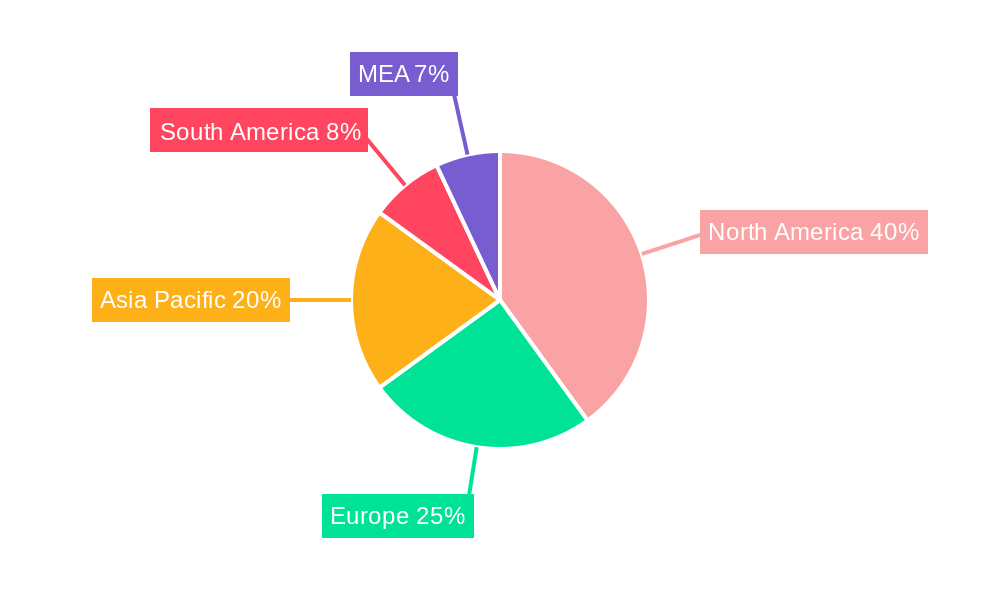
The intelligent well completion market is experiencing robust growth, driven by the increasing demand for enhanced oil and gas recovery (EOR) techniques and the need for improved well monitoring and control. The market's Compound Annual Growth Rate (CAGR) exceeding 3.50% signifies a significant upward trajectory, projected to continue throughout the forecast period (2025-2033). Key drivers include the rising adoption of digital oilfield technologies, increasing automation in well operations, and the growing focus on reducing operational costs and improving efficiency. The market is segmented by application (onshore and offshore) and component (hardware and software), with hardware currently dominating due to the need for advanced sensors and downhole equipment. However, the software segment is expected to witness faster growth, fueled by the increasing sophistication of data analytics and the development of AI-powered solutions for predictive maintenance and optimized production. The North American market holds a significant share, followed by the Asia-Pacific region, driven by robust exploration and production activities in these regions. However, the European and Middle Eastern markets are also demonstrating significant growth potential, presenting opportunities for market expansion. Restraints include the high initial investment costs associated with intelligent well completion technologies and the complexities of implementation in existing well infrastructure. Nevertheless, the long-term benefits in terms of improved production, reduced operational expenses, and enhanced reservoir management are likely to outweigh these challenges, further fueling market growth.
The competitive landscape is characterized by a mix of large multinational corporations and specialized service providers. Major players such as Schlumberger, Halliburton, Baker Hughes, and Weatherford are actively investing in research and development to enhance their product offerings and expand their market share. Smaller, specialized companies are focusing on niche applications and innovative technologies to compete effectively. Future growth will be shaped by technological advancements, particularly in areas such as artificial intelligence (AI), machine learning (ML), and advanced sensor technologies. The integration of these technologies will improve data analysis, prediction accuracy, and overall operational efficiency, further driving market expansion in the coming years. Regulatory support for sustainable oil and gas production and a focus on reducing environmental impact will also play a crucial role in shaping market dynamics.
Intelligent Well Completion Industry Market Report: 2019-2033
This comprehensive report provides an in-depth analysis of the Intelligent Well Completion industry, offering invaluable insights for stakeholders seeking to navigate this dynamic market. With a study period spanning 2019-2033, a base year of 2025, and an estimated and forecast period of 2025-2033, this report delivers a robust understanding of past performance, current trends, and future projections. The global market is projected to reach xx Million by 2033, exhibiting a significant growth trajectory.
Intelligent Well Completion Industry Market Composition & Trends
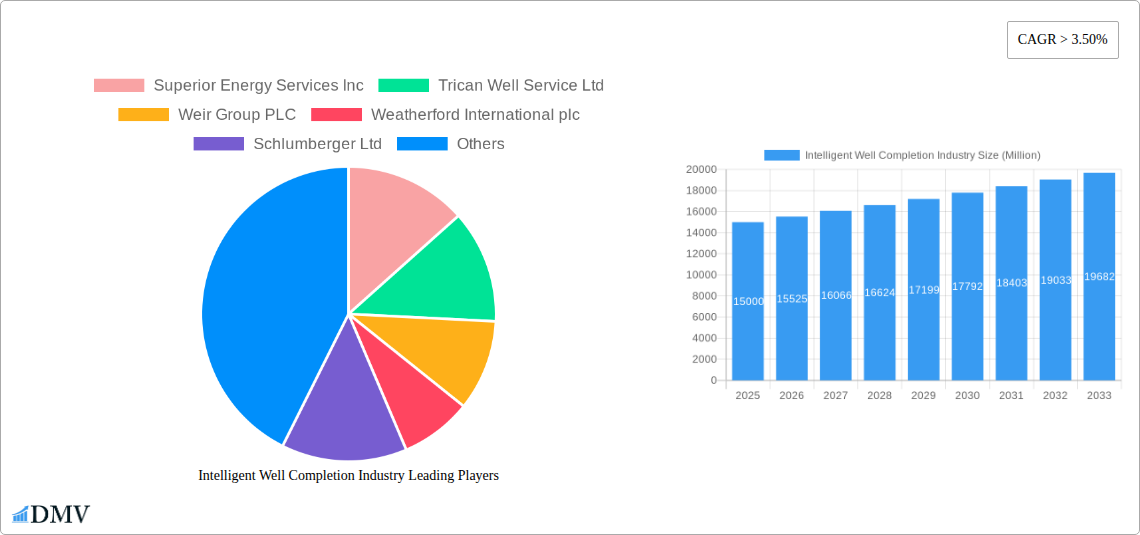
The Intelligent Well Completion market is characterized by a moderately concentrated landscape, with key players such as Schlumberger Ltd, Halliburton Company, Baker Hughes Company, and Weatherford International plc holding significant market share. However, the market is also witnessing the emergence of innovative smaller players, driving competition and fostering technological advancements. Market share distribution currently reflects a concentration amongst established players, with Schlumberger and Halliburton estimated to collectively hold approximately 40% of the market in 2025. The regulatory landscape varies across different regions, influencing operational costs and technological adoption rates. The market experiences substitution pressures from traditional well completion methods, though the advantages of intelligent completions in terms of efficiency and resource optimization are gradually mitigating this. End-users primarily comprise oil and gas exploration and production companies, with a growing interest from independent operators. M&A activity in the sector has been notable in recent years, with deal values exceeding xx Million in the past five years, mostly focused on consolidating technological capabilities and expanding geographical reach. These strategic alliances are expected to influence market dynamics and further accelerate innovation.
- Market Concentration: Moderately concentrated, with a few dominant players.
- Innovation Catalysts: Technological advancements, stringent environmental regulations, and rising operational costs.
- Regulatory Landscape: Varied across regions, impacting operational costs and adoption rates.
- Substitute Products: Traditional well completion methods, posing moderate substitution pressure.
- End-User Profile: Primarily oil and gas exploration and production companies.
- M&A Activity: Significant M&A activity with deal values exceeding xx Million in the past five years.
Intelligent Well Completion Industry Industry Evolution
The Intelligent Well Completion industry has witnessed a remarkable evolution, driven by the convergence of technological advancements and the increasing demand for enhanced oil and gas recovery. From 2019 to 2024, the market exhibited a CAGR of xx%, fueled by the growing adoption of advanced technologies such as remote monitoring, data analytics, and automation. This period also saw the introduction of several groundbreaking innovations, improving well production efficiency and minimizing environmental impact. Technological advancements, such as the development of sophisticated sensors and data analytics platforms, have been key growth drivers. The industry is also witnessing a shift towards digitalization, with increasing reliance on cloud-based platforms and the Internet of Things (IoT) for real-time data monitoring and remote control of well completion systems. The demand for improved well productivity, reduced operational costs, and minimized environmental footprint is driving the adoption of intelligent well completion technologies. This trend is expected to accelerate in the coming years, with the market projected to grow at a CAGR of xx% from 2025 to 2033, reaching an estimated value of xx Million. Adoption of intelligent completion systems is steadily rising across different segments, with an estimated xx% penetration rate in 2025, projected to reach xx% by 2033.
Leading Regions, Countries, or Segments in Intelligent Well Completion Industry
The onshore segment currently dominates the Intelligent Well Completion market, accounting for approximately xx% of the total revenue in 2025. This dominance is driven by the high concentration of oil and gas wells on land, particularly in regions like North America and the Middle East. However, the offshore segment is experiencing rapid growth, spurred by increasing investments in deepwater exploration and production activities.
- Onshore Dominance Drivers:
- High concentration of oil and gas wells.
- Established infrastructure and operational expertise.
- Favorable regulatory environment in key regions.
- Offshore Segment Growth Drivers:
- Increasing investments in deepwater exploration and production.
- Technological advancements enabling efficient operation in challenging environments.
- Growing demand for offshore oil and gas resources.
Within components, the hardware segment maintains a larger share compared to the software segment. However, the software segment is poised for rapid growth due to the increasing importance of data analytics and intelligent automation. The substantial growth in the hardware component is driven by the demand for advanced sensors, downhole tools, and control systems that enable real-time monitoring and optimization of well completion operations. North America (particularly the US) leads the market owing to significant shale gas developments and mature oil and gas infrastructure, enabling rapid adoption of advanced technologies.
Intelligent Well Completion Industry Product Innovations
Recent years have witnessed significant product innovations within the Intelligent Well Completion industry. Halliburton's StrataStar service, launched in April 2022, exemplifies this trend, offering advanced reservoir visualization capabilities for improved well contact and real-time reserve evaluation. Similarly, Baker Hughes' February 2023 software launch focuses on improving efficiency and reducing emissions, reflecting the industry's commitment to sustainability. These innovations showcase a move towards intelligent, data-driven solutions designed to optimize well performance and reduce environmental impact. Key features include improved data analytics, enhanced automation capabilities, and more efficient and durable hardware components.
Propelling Factors for Intelligent Well Completion Industry Growth
Several factors propel the growth of the Intelligent Well Completion industry. Technological advancements, such as improved sensors, data analytics, and automation, enhance well productivity and reduce operational costs. Favorable economic conditions, particularly stable or increasing oil and gas prices, drive investment in enhanced recovery technologies. Furthermore, stringent environmental regulations are encouraging the adoption of solutions that minimize emissions and environmental impact. The rising demand for sustainable oil and gas production further fuels this adoption.
Obstacles in the Intelligent Well Completion Industry Market
The Intelligent Well Completion industry faces challenges, including high initial investment costs for advanced technologies, supply chain disruptions affecting the availability of crucial components, and intense competition amongst established players and new entrants. Regulatory complexities in different regions can hinder market penetration and operational efficiency. These factors can affect project timelines and profitability, requiring strategic planning to mitigate these impacts.
Future Opportunities in Intelligent Well Completion Industry
Future opportunities lie in expanding into unconventional resources, such as shale gas and tight oil, which demand sophisticated completion technologies. Advancements in artificial intelligence (AI) and machine learning (ML) will improve data analysis and predictive modeling, leading to better decision-making and optimized well performance. Exploring new markets in developing economies and adapting technologies for specific reservoir conditions will open up new growth avenues.
Major Players in the Intelligent Well Completion Industry Ecosystem
- Superior Energy Services Inc
- Trican Well Service Ltd
- Weir Group PLC
- Weatherford International plc
- Schlumberger Ltd
- Packers Plus Energy Services Inc
- Baker Hughes Company
- Halliburton Company
- National-Oilwell Varco Inc
- Schoeller-Bleckmann Oilfield Equipment AG
- Welltec A/S
- *List Not Exhaustive
Key Developments in Intelligent Well Completion Industry Industry
- April 2022: Halliburton introduced StrataStar, a deep azimuthal resistivity service enhancing reservoir visualization and real-time reserve evaluation. This significantly improves the accuracy of reservoir characterization and well placement optimization, leading to enhanced production efficiency.
- February 2023: Baker Hughes launched new software focusing on increased efficiency and emissions reduction in well completion operations. This reflects the growing emphasis on sustainability within the industry and attracts environmentally conscious operators.
Strategic Intelligent Well Completion Industry Market Forecast
The Intelligent Well Completion market is poised for substantial growth, driven by technological innovation, increasing demand for enhanced oil recovery, and the growing focus on sustainability. The market's future trajectory will be shaped by the continued adoption of advanced technologies, expansion into new geographical regions, and the development of innovative solutions addressing specific challenges within the oil and gas industry. The market is expected to experience significant expansion in the coming years, with potential for further consolidation through mergers and acquisitions.
Intelligent Well Completion Industry Segmentation
- 1. Production Analysis
- 2. Consumption Analysis
- 3. Import Market Analysis (Value & Volume)
- 4. Export Market Analysis (Value & Volume)
- 5. Price Trend Analysis
Intelligent Well Completion Industry Segmentation By Geography
- 1. North America
- 2. Europe
- 3. Asia Pacific
- 4. South America
- 5. Middle East and Africa
Intelligent Well Completion Industry REPORT HIGHLIGHTS
| Aspects | Details |
|---|---|
| Study Period | 2019-2033 |
| Base Year | 2024 |
| Estimated Year | 2025 |
| Forecast Period | 2025-2033 |
| Historical Period | 2019-2024 |
| Growth Rate | CAGR of > 3.50% from 2019-2033 |
| Segmentation |
|
Table of Contents
- 1. Introduction
- 1.1. Research Scope
- 1.2. Market Segmentation
- 1.3. Research Methodology
- 1.4. Definitions and Assumptions
- 2. Executive Summary
- 2.1. Introduction
- 3. Market Dynamics
- 3.1. Introduction
- 3.2. Market Drivers
- 3.2.1. 4.; Global Inclination toward Renewable-based Power Generation4.; Increased Power Demand in Line with the Increasing Population
- 3.3. Market Restrains
- 3.3.1. 4.; High Initial Cost
- 3.4. Market Trends
- 3.4.1. Offshore to be the Fastest Growing Segment
- 4. Market Factor Analysis
- 4.1. Porters Five Forces
- 4.2. Supply/Value Chain
- 4.3. PESTEL analysis
- 4.4. Market Entropy
- 4.5. Patent/Trademark Analysis
- 5. Global Intelligent Well Completion Industry Analysis, Insights and Forecast, 2019-2031
- 5.1. Market Analysis, Insights and Forecast - by Production Analysis
- 5.2. Market Analysis, Insights and Forecast - by Consumption Analysis
- 5.3. Market Analysis, Insights and Forecast - by Import Market Analysis (Value & Volume)
- 5.4. Market Analysis, Insights and Forecast - by Export Market Analysis (Value & Volume)
- 5.5. Market Analysis, Insights and Forecast - by Price Trend Analysis
- 5.6. Market Analysis, Insights and Forecast - by Region
- 5.6.1. North America
- 5.6.2. Europe
- 5.6.3. Asia Pacific
- 5.6.4. South America
- 5.6.5. Middle East and Africa
- 5.1. Market Analysis, Insights and Forecast - by Production Analysis
- 6. North America Intelligent Well Completion Industry Analysis, Insights and Forecast, 2019-2031
- 6.1. Market Analysis, Insights and Forecast - by Production Analysis
- 6.2. Market Analysis, Insights and Forecast - by Consumption Analysis
- 6.3. Market Analysis, Insights and Forecast - by Import Market Analysis (Value & Volume)
- 6.4. Market Analysis, Insights and Forecast - by Export Market Analysis (Value & Volume)
- 6.5. Market Analysis, Insights and Forecast - by Price Trend Analysis
- 6.1. Market Analysis, Insights and Forecast - by Production Analysis
- 7. Europe Intelligent Well Completion Industry Analysis, Insights and Forecast, 2019-2031
- 7.1. Market Analysis, Insights and Forecast - by Production Analysis
- 7.2. Market Analysis, Insights and Forecast - by Consumption Analysis
- 7.3. Market Analysis, Insights and Forecast - by Import Market Analysis (Value & Volume)
- 7.4. Market Analysis, Insights and Forecast - by Export Market Analysis (Value & Volume)
- 7.5. Market Analysis, Insights and Forecast - by Price Trend Analysis
- 7.1. Market Analysis, Insights and Forecast - by Production Analysis
- 8. Asia Pacific Intelligent Well Completion Industry Analysis, Insights and Forecast, 2019-2031
- 8.1. Market Analysis, Insights and Forecast - by Production Analysis
- 8.2. Market Analysis, Insights and Forecast - by Consumption Analysis
- 8.3. Market Analysis, Insights and Forecast - by Import Market Analysis (Value & Volume)
- 8.4. Market Analysis, Insights and Forecast - by Export Market Analysis (Value & Volume)
- 8.5. Market Analysis, Insights and Forecast - by Price Trend Analysis
- 8.1. Market Analysis, Insights and Forecast - by Production Analysis
- 9. South America Intelligent Well Completion Industry Analysis, Insights and Forecast, 2019-2031
- 9.1. Market Analysis, Insights and Forecast - by Production Analysis
- 9.2. Market Analysis, Insights and Forecast - by Consumption Analysis
- 9.3. Market Analysis, Insights and Forecast - by Import Market Analysis (Value & Volume)
- 9.4. Market Analysis, Insights and Forecast - by Export Market Analysis (Value & Volume)
- 9.5. Market Analysis, Insights and Forecast - by Price Trend Analysis
- 9.1. Market Analysis, Insights and Forecast - by Production Analysis
- 10. Middle East and Africa Intelligent Well Completion Industry Analysis, Insights and Forecast, 2019-2031
- 10.1. Market Analysis, Insights and Forecast - by Production Analysis
- 10.2. Market Analysis, Insights and Forecast - by Consumption Analysis
- 10.3. Market Analysis, Insights and Forecast - by Import Market Analysis (Value & Volume)
- 10.4. Market Analysis, Insights and Forecast - by Export Market Analysis (Value & Volume)
- 10.5. Market Analysis, Insights and Forecast - by Price Trend Analysis
- 10.1. Market Analysis, Insights and Forecast - by Production Analysis
- 11. North America Intelligent Well Completion Industry Analysis, Insights and Forecast, 2019-2031
- 11.1. Market Analysis, Insights and Forecast - By Country/Sub-region
- 11.1.1 United States
- 11.1.2 Canada
- 11.1.3 Mexico
- 12. Europe Intelligent Well Completion Industry Analysis, Insights and Forecast, 2019-2031
- 12.1. Market Analysis, Insights and Forecast - By Country/Sub-region
- 12.1.1 Germany
- 12.1.2 United Kingdom
- 12.1.3 France
- 12.1.4 Spain
- 12.1.5 Italy
- 12.1.6 Spain
- 12.1.7 Belgium
- 12.1.8 Netherland
- 12.1.9 Nordics
- 12.1.10 Rest of Europe
- 13. Asia Pacific Intelligent Well Completion Industry Analysis, Insights and Forecast, 2019-2031
- 13.1. Market Analysis, Insights and Forecast - By Country/Sub-region
- 13.1.1 China
- 13.1.2 Japan
- 13.1.3 India
- 13.1.4 South Korea
- 13.1.5 Southeast Asia
- 13.1.6 Australia
- 13.1.7 Indonesia
- 13.1.8 Phillipes
- 13.1.9 Singapore
- 13.1.10 Thailandc
- 13.1.11 Rest of Asia Pacific
- 14. South America Intelligent Well Completion Industry Analysis, Insights and Forecast, 2019-2031
- 14.1. Market Analysis, Insights and Forecast - By Country/Sub-region
- 14.1.1 Brazil
- 14.1.2 Argentina
- 14.1.3 Peru
- 14.1.4 Chile
- 14.1.5 Colombia
- 14.1.6 Ecuador
- 14.1.7 Venezuela
- 14.1.8 Rest of South America
- 15. North America Intelligent Well Completion Industry Analysis, Insights and Forecast, 2019-2031
- 15.1. Market Analysis, Insights and Forecast - By Country/Sub-region
- 15.1.1 United States
- 15.1.2 Canada
- 15.1.3 Mexico
- 16. MEA Intelligent Well Completion Industry Analysis, Insights and Forecast, 2019-2031
- 16.1. Market Analysis, Insights and Forecast - By Country/Sub-region
- 16.1.1 United Arab Emirates
- 16.1.2 Saudi Arabia
- 16.1.3 South Africa
- 16.1.4 Rest of Middle East and Africa
- 17. Competitive Analysis
- 17.1. Global Market Share Analysis 2024
- 17.2. Company Profiles
- 17.2.1 Superior Energy Services Inc
- 17.2.1.1. Overview
- 17.2.1.2. Products
- 17.2.1.3. SWOT Analysis
- 17.2.1.4. Recent Developments
- 17.2.1.5. Financials (Based on Availability)
- 17.2.2 Trican Well Service Ltd
- 17.2.2.1. Overview
- 17.2.2.2. Products
- 17.2.2.3. SWOT Analysis
- 17.2.2.4. Recent Developments
- 17.2.2.5. Financials (Based on Availability)
- 17.2.3 Weir Group PLC
- 17.2.3.1. Overview
- 17.2.3.2. Products
- 17.2.3.3. SWOT Analysis
- 17.2.3.4. Recent Developments
- 17.2.3.5. Financials (Based on Availability)
- 17.2.4 Weatherford International plc
- 17.2.4.1. Overview
- 17.2.4.2. Products
- 17.2.4.3. SWOT Analysis
- 17.2.4.4. Recent Developments
- 17.2.4.5. Financials (Based on Availability)
- 17.2.5 Schlumberger Ltd
- 17.2.5.1. Overview
- 17.2.5.2. Products
- 17.2.5.3. SWOT Analysis
- 17.2.5.4. Recent Developments
- 17.2.5.5. Financials (Based on Availability)
- 17.2.6 Packers Plus Energy Services Inc
- 17.2.6.1. Overview
- 17.2.6.2. Products
- 17.2.6.3. SWOT Analysis
- 17.2.6.4. Recent Developments
- 17.2.6.5. Financials (Based on Availability)
- 17.2.7 Baker Hughes Company
- 17.2.7.1. Overview
- 17.2.7.2. Products
- 17.2.7.3. SWOT Analysis
- 17.2.7.4. Recent Developments
- 17.2.7.5. Financials (Based on Availability)
- 17.2.8 Halliburton Company
- 17.2.8.1. Overview
- 17.2.8.2. Products
- 17.2.8.3. SWOT Analysis
- 17.2.8.4. Recent Developments
- 17.2.8.5. Financials (Based on Availability)
- 17.2.9 National-Oilwell Varco Inc
- 17.2.9.1. Overview
- 17.2.9.2. Products
- 17.2.9.3. SWOT Analysis
- 17.2.9.4. Recent Developments
- 17.2.9.5. Financials (Based on Availability)
- 17.2.10 Schoeller-Bleckmann Oilfield Equipment AG
- 17.2.10.1. Overview
- 17.2.10.2. Products
- 17.2.10.3. SWOT Analysis
- 17.2.10.4. Recent Developments
- 17.2.10.5. Financials (Based on Availability)
- 17.2.11 Welltec A/S*List Not Exhaustive
- 17.2.11.1. Overview
- 17.2.11.2. Products
- 17.2.11.3. SWOT Analysis
- 17.2.11.4. Recent Developments
- 17.2.11.5. Financials (Based on Availability)
- 17.2.1 Superior Energy Services Inc
List of Figures
- Figure 1: Global Intelligent Well Completion Industry Revenue Breakdown (Million, %) by Region 2024 & 2032
- Figure 2: North America Intelligent Well Completion Industry Revenue (Million), by Country 2024 & 2032
- Figure 3: North America Intelligent Well Completion Industry Revenue Share (%), by Country 2024 & 2032
- Figure 4: Europe Intelligent Well Completion Industry Revenue (Million), by Country 2024 & 2032
- Figure 5: Europe Intelligent Well Completion Industry Revenue Share (%), by Country 2024 & 2032
- Figure 6: Asia Pacific Intelligent Well Completion Industry Revenue (Million), by Country 2024 & 2032
- Figure 7: Asia Pacific Intelligent Well Completion Industry Revenue Share (%), by Country 2024 & 2032
- Figure 8: South America Intelligent Well Completion Industry Revenue (Million), by Country 2024 & 2032
- Figure 9: South America Intelligent Well Completion Industry Revenue Share (%), by Country 2024 & 2032
- Figure 10: North America Intelligent Well Completion Industry Revenue (Million), by Country 2024 & 2032
- Figure 11: North America Intelligent Well Completion Industry Revenue Share (%), by Country 2024 & 2032
- Figure 12: MEA Intelligent Well Completion Industry Revenue (Million), by Country 2024 & 2032
- Figure 13: MEA Intelligent Well Completion Industry Revenue Share (%), by Country 2024 & 2032
- Figure 14: North America Intelligent Well Completion Industry Revenue (Million), by Production Analysis 2024 & 2032
- Figure 15: North America Intelligent Well Completion Industry Revenue Share (%), by Production Analysis 2024 & 2032
- Figure 16: North America Intelligent Well Completion Industry Revenue (Million), by Consumption Analysis 2024 & 2032
- Figure 17: North America Intelligent Well Completion Industry Revenue Share (%), by Consumption Analysis 2024 & 2032
- Figure 18: North America Intelligent Well Completion Industry Revenue (Million), by Import Market Analysis (Value & Volume) 2024 & 2032
- Figure 19: North America Intelligent Well Completion Industry Revenue Share (%), by Import Market Analysis (Value & Volume) 2024 & 2032
- Figure 20: North America Intelligent Well Completion Industry Revenue (Million), by Export Market Analysis (Value & Volume) 2024 & 2032
- Figure 21: North America Intelligent Well Completion Industry Revenue Share (%), by Export Market Analysis (Value & Volume) 2024 & 2032
- Figure 22: North America Intelligent Well Completion Industry Revenue (Million), by Price Trend Analysis 2024 & 2032
- Figure 23: North America Intelligent Well Completion Industry Revenue Share (%), by Price Trend Analysis 2024 & 2032
- Figure 24: North America Intelligent Well Completion Industry Revenue (Million), by Country 2024 & 2032
- Figure 25: North America Intelligent Well Completion Industry Revenue Share (%), by Country 2024 & 2032
- Figure 26: Europe Intelligent Well Completion Industry Revenue (Million), by Production Analysis 2024 & 2032
- Figure 27: Europe Intelligent Well Completion Industry Revenue Share (%), by Production Analysis 2024 & 2032
- Figure 28: Europe Intelligent Well Completion Industry Revenue (Million), by Consumption Analysis 2024 & 2032
- Figure 29: Europe Intelligent Well Completion Industry Revenue Share (%), by Consumption Analysis 2024 & 2032
- Figure 30: Europe Intelligent Well Completion Industry Revenue (Million), by Import Market Analysis (Value & Volume) 2024 & 2032
- Figure 31: Europe Intelligent Well Completion Industry Revenue Share (%), by Import Market Analysis (Value & Volume) 2024 & 2032
- Figure 32: Europe Intelligent Well Completion Industry Revenue (Million), by Export Market Analysis (Value & Volume) 2024 & 2032
- Figure 33: Europe Intelligent Well Completion Industry Revenue Share (%), by Export Market Analysis (Value & Volume) 2024 & 2032
- Figure 34: Europe Intelligent Well Completion Industry Revenue (Million), by Price Trend Analysis 2024 & 2032
- Figure 35: Europe Intelligent Well Completion Industry Revenue Share (%), by Price Trend Analysis 2024 & 2032
- Figure 36: Europe Intelligent Well Completion Industry Revenue (Million), by Country 2024 & 2032
- Figure 37: Europe Intelligent Well Completion Industry Revenue Share (%), by Country 2024 & 2032
- Figure 38: Asia Pacific Intelligent Well Completion Industry Revenue (Million), by Production Analysis 2024 & 2032
- Figure 39: Asia Pacific Intelligent Well Completion Industry Revenue Share (%), by Production Analysis 2024 & 2032
- Figure 40: Asia Pacific Intelligent Well Completion Industry Revenue (Million), by Consumption Analysis 2024 & 2032
- Figure 41: Asia Pacific Intelligent Well Completion Industry Revenue Share (%), by Consumption Analysis 2024 & 2032
- Figure 42: Asia Pacific Intelligent Well Completion Industry Revenue (Million), by Import Market Analysis (Value & Volume) 2024 & 2032
- Figure 43: Asia Pacific Intelligent Well Completion Industry Revenue Share (%), by Import Market Analysis (Value & Volume) 2024 & 2032
- Figure 44: Asia Pacific Intelligent Well Completion Industry Revenue (Million), by Export Market Analysis (Value & Volume) 2024 & 2032
- Figure 45: Asia Pacific Intelligent Well Completion Industry Revenue Share (%), by Export Market Analysis (Value & Volume) 2024 & 2032
- Figure 46: Asia Pacific Intelligent Well Completion Industry Revenue (Million), by Price Trend Analysis 2024 & 2032
- Figure 47: Asia Pacific Intelligent Well Completion Industry Revenue Share (%), by Price Trend Analysis 2024 & 2032
- Figure 48: Asia Pacific Intelligent Well Completion Industry Revenue (Million), by Country 2024 & 2032
- Figure 49: Asia Pacific Intelligent Well Completion Industry Revenue Share (%), by Country 2024 & 2032
- Figure 50: South America Intelligent Well Completion Industry Revenue (Million), by Production Analysis 2024 & 2032
- Figure 51: South America Intelligent Well Completion Industry Revenue Share (%), by Production Analysis 2024 & 2032
- Figure 52: South America Intelligent Well Completion Industry Revenue (Million), by Consumption Analysis 2024 & 2032
- Figure 53: South America Intelligent Well Completion Industry Revenue Share (%), by Consumption Analysis 2024 & 2032
- Figure 54: South America Intelligent Well Completion Industry Revenue (Million), by Import Market Analysis (Value & Volume) 2024 & 2032
- Figure 55: South America Intelligent Well Completion Industry Revenue Share (%), by Import Market Analysis (Value & Volume) 2024 & 2032
- Figure 56: South America Intelligent Well Completion Industry Revenue (Million), by Export Market Analysis (Value & Volume) 2024 & 2032
- Figure 57: South America Intelligent Well Completion Industry Revenue Share (%), by Export Market Analysis (Value & Volume) 2024 & 2032
- Figure 58: South America Intelligent Well Completion Industry Revenue (Million), by Price Trend Analysis 2024 & 2032
- Figure 59: South America Intelligent Well Completion Industry Revenue Share (%), by Price Trend Analysis 2024 & 2032
- Figure 60: South America Intelligent Well Completion Industry Revenue (Million), by Country 2024 & 2032
- Figure 61: South America Intelligent Well Completion Industry Revenue Share (%), by Country 2024 & 2032
- Figure 62: Middle East and Africa Intelligent Well Completion Industry Revenue (Million), by Production Analysis 2024 & 2032
- Figure 63: Middle East and Africa Intelligent Well Completion Industry Revenue Share (%), by Production Analysis 2024 & 2032
- Figure 64: Middle East and Africa Intelligent Well Completion Industry Revenue (Million), by Consumption Analysis 2024 & 2032
- Figure 65: Middle East and Africa Intelligent Well Completion Industry Revenue Share (%), by Consumption Analysis 2024 & 2032
- Figure 66: Middle East and Africa Intelligent Well Completion Industry Revenue (Million), by Import Market Analysis (Value & Volume) 2024 & 2032
- Figure 67: Middle East and Africa Intelligent Well Completion Industry Revenue Share (%), by Import Market Analysis (Value & Volume) 2024 & 2032
- Figure 68: Middle East and Africa Intelligent Well Completion Industry Revenue (Million), by Export Market Analysis (Value & Volume) 2024 & 2032
- Figure 69: Middle East and Africa Intelligent Well Completion Industry Revenue Share (%), by Export Market Analysis (Value & Volume) 2024 & 2032
- Figure 70: Middle East and Africa Intelligent Well Completion Industry Revenue (Million), by Price Trend Analysis 2024 & 2032
- Figure 71: Middle East and Africa Intelligent Well Completion Industry Revenue Share (%), by Price Trend Analysis 2024 & 2032
- Figure 72: Middle East and Africa Intelligent Well Completion Industry Revenue (Million), by Country 2024 & 2032
- Figure 73: Middle East and Africa Intelligent Well Completion Industry Revenue Share (%), by Country 2024 & 2032
List of Tables
- Table 1: Global Intelligent Well Completion Industry Revenue Million Forecast, by Region 2019 & 2032
- Table 2: Global Intelligent Well Completion Industry Revenue Million Forecast, by Production Analysis 2019 & 2032
- Table 3: Global Intelligent Well Completion Industry Revenue Million Forecast, by Consumption Analysis 2019 & 2032
- Table 4: Global Intelligent Well Completion Industry Revenue Million Forecast, by Import Market Analysis (Value & Volume) 2019 & 2032
- Table 5: Global Intelligent Well Completion Industry Revenue Million Forecast, by Export Market Analysis (Value & Volume) 2019 & 2032
- Table 6: Global Intelligent Well Completion Industry Revenue Million Forecast, by Price Trend Analysis 2019 & 2032
- Table 7: Global Intelligent Well Completion Industry Revenue Million Forecast, by Region 2019 & 2032
- Table 8: Global Intelligent Well Completion Industry Revenue Million Forecast, by Country 2019 & 2032
- Table 9: United States Intelligent Well Completion Industry Revenue (Million) Forecast, by Application 2019 & 2032
- Table 10: Canada Intelligent Well Completion Industry Revenue (Million) Forecast, by Application 2019 & 2032
- Table 11: Mexico Intelligent Well Completion Industry Revenue (Million) Forecast, by Application 2019 & 2032
- Table 12: Global Intelligent Well Completion Industry Revenue Million Forecast, by Country 2019 & 2032
- Table 13: Germany Intelligent Well Completion Industry Revenue (Million) Forecast, by Application 2019 & 2032
- Table 14: United Kingdom Intelligent Well Completion Industry Revenue (Million) Forecast, by Application 2019 & 2032
- Table 15: France Intelligent Well Completion Industry Revenue (Million) Forecast, by Application 2019 & 2032
- Table 16: Spain Intelligent Well Completion Industry Revenue (Million) Forecast, by Application 2019 & 2032
- Table 17: Italy Intelligent Well Completion Industry Revenue (Million) Forecast, by Application 2019 & 2032
- Table 18: Spain Intelligent Well Completion Industry Revenue (Million) Forecast, by Application 2019 & 2032
- Table 19: Belgium Intelligent Well Completion Industry Revenue (Million) Forecast, by Application 2019 & 2032
- Table 20: Netherland Intelligent Well Completion Industry Revenue (Million) Forecast, by Application 2019 & 2032
- Table 21: Nordics Intelligent Well Completion Industry Revenue (Million) Forecast, by Application 2019 & 2032
- Table 22: Rest of Europe Intelligent Well Completion Industry Revenue (Million) Forecast, by Application 2019 & 2032
- Table 23: Global Intelligent Well Completion Industry Revenue Million Forecast, by Country 2019 & 2032
- Table 24: China Intelligent Well Completion Industry Revenue (Million) Forecast, by Application 2019 & 2032
- Table 25: Japan Intelligent Well Completion Industry Revenue (Million) Forecast, by Application 2019 & 2032
- Table 26: India Intelligent Well Completion Industry Revenue (Million) Forecast, by Application 2019 & 2032
- Table 27: South Korea Intelligent Well Completion Industry Revenue (Million) Forecast, by Application 2019 & 2032
- Table 28: Southeast Asia Intelligent Well Completion Industry Revenue (Million) Forecast, by Application 2019 & 2032
- Table 29: Australia Intelligent Well Completion Industry Revenue (Million) Forecast, by Application 2019 & 2032
- Table 30: Indonesia Intelligent Well Completion Industry Revenue (Million) Forecast, by Application 2019 & 2032
- Table 31: Phillipes Intelligent Well Completion Industry Revenue (Million) Forecast, by Application 2019 & 2032
- Table 32: Singapore Intelligent Well Completion Industry Revenue (Million) Forecast, by Application 2019 & 2032
- Table 33: Thailandc Intelligent Well Completion Industry Revenue (Million) Forecast, by Application 2019 & 2032
- Table 34: Rest of Asia Pacific Intelligent Well Completion Industry Revenue (Million) Forecast, by Application 2019 & 2032
- Table 35: Global Intelligent Well Completion Industry Revenue Million Forecast, by Country 2019 & 2032
- Table 36: Brazil Intelligent Well Completion Industry Revenue (Million) Forecast, by Application 2019 & 2032
- Table 37: Argentina Intelligent Well Completion Industry Revenue (Million) Forecast, by Application 2019 & 2032
- Table 38: Peru Intelligent Well Completion Industry Revenue (Million) Forecast, by Application 2019 & 2032
- Table 39: Chile Intelligent Well Completion Industry Revenue (Million) Forecast, by Application 2019 & 2032
- Table 40: Colombia Intelligent Well Completion Industry Revenue (Million) Forecast, by Application 2019 & 2032
- Table 41: Ecuador Intelligent Well Completion Industry Revenue (Million) Forecast, by Application 2019 & 2032
- Table 42: Venezuela Intelligent Well Completion Industry Revenue (Million) Forecast, by Application 2019 & 2032
- Table 43: Rest of South America Intelligent Well Completion Industry Revenue (Million) Forecast, by Application 2019 & 2032
- Table 44: Global Intelligent Well Completion Industry Revenue Million Forecast, by Country 2019 & 2032
- Table 45: United States Intelligent Well Completion Industry Revenue (Million) Forecast, by Application 2019 & 2032
- Table 46: Canada Intelligent Well Completion Industry Revenue (Million) Forecast, by Application 2019 & 2032
- Table 47: Mexico Intelligent Well Completion Industry Revenue (Million) Forecast, by Application 2019 & 2032
- Table 48: Global Intelligent Well Completion Industry Revenue Million Forecast, by Country 2019 & 2032
- Table 49: United Arab Emirates Intelligent Well Completion Industry Revenue (Million) Forecast, by Application 2019 & 2032
- Table 50: Saudi Arabia Intelligent Well Completion Industry Revenue (Million) Forecast, by Application 2019 & 2032
- Table 51: South Africa Intelligent Well Completion Industry Revenue (Million) Forecast, by Application 2019 & 2032
- Table 52: Rest of Middle East and Africa Intelligent Well Completion Industry Revenue (Million) Forecast, by Application 2019 & 2032
- Table 53: Global Intelligent Well Completion Industry Revenue Million Forecast, by Production Analysis 2019 & 2032
- Table 54: Global Intelligent Well Completion Industry Revenue Million Forecast, by Consumption Analysis 2019 & 2032
- Table 55: Global Intelligent Well Completion Industry Revenue Million Forecast, by Import Market Analysis (Value & Volume) 2019 & 2032
- Table 56: Global Intelligent Well Completion Industry Revenue Million Forecast, by Export Market Analysis (Value & Volume) 2019 & 2032
- Table 57: Global Intelligent Well Completion Industry Revenue Million Forecast, by Price Trend Analysis 2019 & 2032
- Table 58: Global Intelligent Well Completion Industry Revenue Million Forecast, by Country 2019 & 2032
- Table 59: Global Intelligent Well Completion Industry Revenue Million Forecast, by Production Analysis 2019 & 2032
- Table 60: Global Intelligent Well Completion Industry Revenue Million Forecast, by Consumption Analysis 2019 & 2032
- Table 61: Global Intelligent Well Completion Industry Revenue Million Forecast, by Import Market Analysis (Value & Volume) 2019 & 2032
- Table 62: Global Intelligent Well Completion Industry Revenue Million Forecast, by Export Market Analysis (Value & Volume) 2019 & 2032
- Table 63: Global Intelligent Well Completion Industry Revenue Million Forecast, by Price Trend Analysis 2019 & 2032
- Table 64: Global Intelligent Well Completion Industry Revenue Million Forecast, by Country 2019 & 2032
- Table 65: Global Intelligent Well Completion Industry Revenue Million Forecast, by Production Analysis 2019 & 2032
- Table 66: Global Intelligent Well Completion Industry Revenue Million Forecast, by Consumption Analysis 2019 & 2032
- Table 67: Global Intelligent Well Completion Industry Revenue Million Forecast, by Import Market Analysis (Value & Volume) 2019 & 2032
- Table 68: Global Intelligent Well Completion Industry Revenue Million Forecast, by Export Market Analysis (Value & Volume) 2019 & 2032
- Table 69: Global Intelligent Well Completion Industry Revenue Million Forecast, by Price Trend Analysis 2019 & 2032
- Table 70: Global Intelligent Well Completion Industry Revenue Million Forecast, by Country 2019 & 2032
- Table 71: Global Intelligent Well Completion Industry Revenue Million Forecast, by Production Analysis 2019 & 2032
- Table 72: Global Intelligent Well Completion Industry Revenue Million Forecast, by Consumption Analysis 2019 & 2032
- Table 73: Global Intelligent Well Completion Industry Revenue Million Forecast, by Import Market Analysis (Value & Volume) 2019 & 2032
- Table 74: Global Intelligent Well Completion Industry Revenue Million Forecast, by Export Market Analysis (Value & Volume) 2019 & 2032
- Table 75: Global Intelligent Well Completion Industry Revenue Million Forecast, by Price Trend Analysis 2019 & 2032
- Table 76: Global Intelligent Well Completion Industry Revenue Million Forecast, by Country 2019 & 2032
- Table 77: Global Intelligent Well Completion Industry Revenue Million Forecast, by Production Analysis 2019 & 2032
- Table 78: Global Intelligent Well Completion Industry Revenue Million Forecast, by Consumption Analysis 2019 & 2032
- Table 79: Global Intelligent Well Completion Industry Revenue Million Forecast, by Import Market Analysis (Value & Volume) 2019 & 2032
- Table 80: Global Intelligent Well Completion Industry Revenue Million Forecast, by Export Market Analysis (Value & Volume) 2019 & 2032
- Table 81: Global Intelligent Well Completion Industry Revenue Million Forecast, by Price Trend Analysis 2019 & 2032
- Table 82: Global Intelligent Well Completion Industry Revenue Million Forecast, by Country 2019 & 2032
Frequently Asked Questions
1. What is the projected Compound Annual Growth Rate (CAGR) of the Intelligent Well Completion Industry?
The projected CAGR is approximately > 3.50%.
2. Which companies are prominent players in the Intelligent Well Completion Industry?
Key companies in the market include Superior Energy Services Inc, Trican Well Service Ltd, Weir Group PLC, Weatherford International plc, Schlumberger Ltd, Packers Plus Energy Services Inc, Baker Hughes Company, Halliburton Company, National-Oilwell Varco Inc, Schoeller-Bleckmann Oilfield Equipment AG, Welltec A/S*List Not Exhaustive.
3. What are the main segments of the Intelligent Well Completion Industry?
The market segments include Production Analysis, Consumption Analysis, Import Market Analysis (Value & Volume), Export Market Analysis (Value & Volume), Price Trend Analysis.
4. Can you provide details about the market size?
The market size is estimated to be USD XX Million as of 2022.
5. What are some drivers contributing to market growth?
4.; Global Inclination toward Renewable-based Power Generation4.; Increased Power Demand in Line with the Increasing Population.
6. What are the notable trends driving market growth?
Offshore to be the Fastest Growing Segment.
7. Are there any restraints impacting market growth?
4.; High Initial Cost.
8. Can you provide examples of recent developments in the market?
April 2022: Halliburton introduced StrataSta, a deep azimuthal resistivity service that provides multilayer visualization to maximize well contact with the reservoir and improve real-time reserve evaluation. The StrataStar service is an addition to Halliburton's iStar intelligent drilling and logging platform.
9. What pricing options are available for accessing the report?
Pricing options include single-user, multi-user, and enterprise licenses priced at USD 4750, USD 5250, and USD 8750 respectively.
10. Is the market size provided in terms of value or volume?
The market size is provided in terms of value, measured in Million.
11. Are there any specific market keywords associated with the report?
Yes, the market keyword associated with the report is "Intelligent Well Completion Industry," which aids in identifying and referencing the specific market segment covered.
12. How do I determine which pricing option suits my needs best?
The pricing options vary based on user requirements and access needs. Individual users may opt for single-user licenses, while businesses requiring broader access may choose multi-user or enterprise licenses for cost-effective access to the report.
13. Are there any additional resources or data provided in the Intelligent Well Completion Industry report?
While the report offers comprehensive insights, it's advisable to review the specific contents or supplementary materials provided to ascertain if additional resources or data are available.
14. How can I stay updated on further developments or reports in the Intelligent Well Completion Industry?
To stay informed about further developments, trends, and reports in the Intelligent Well Completion Industry, consider subscribing to industry newsletters, following relevant companies and organizations, or regularly checking reputable industry news sources and publications.
Methodology
Step 1 - Identification of Relevant Samples Size from Population Database


Step 2 - Approaches for Defining Global Market Size (Value, Volume* & Price*)

Note*: In applicable scenarios
Step 3 - Data Sources
Primary Research
- Web Analytics
- Survey Reports
- Research Institute
- Latest Research Reports
- Opinion Leaders
Secondary Research
- Annual Reports
- White Paper
- Latest Press Release
- Industry Association
- Paid Database
- Investor Presentations

Step 4 - Data Triangulation
Involves using different sources of information in order to increase the validity of a study
These sources are likely to be stakeholders in a program - participants, other researchers, program staff, other community members, and so on.
Then we put all data in single framework & apply various statistical tools to find out the dynamic on the market.
During the analysis stage, feedback from the stakeholder groups would be compared to determine areas of agreement as well as areas of divergence
