

Key Insights
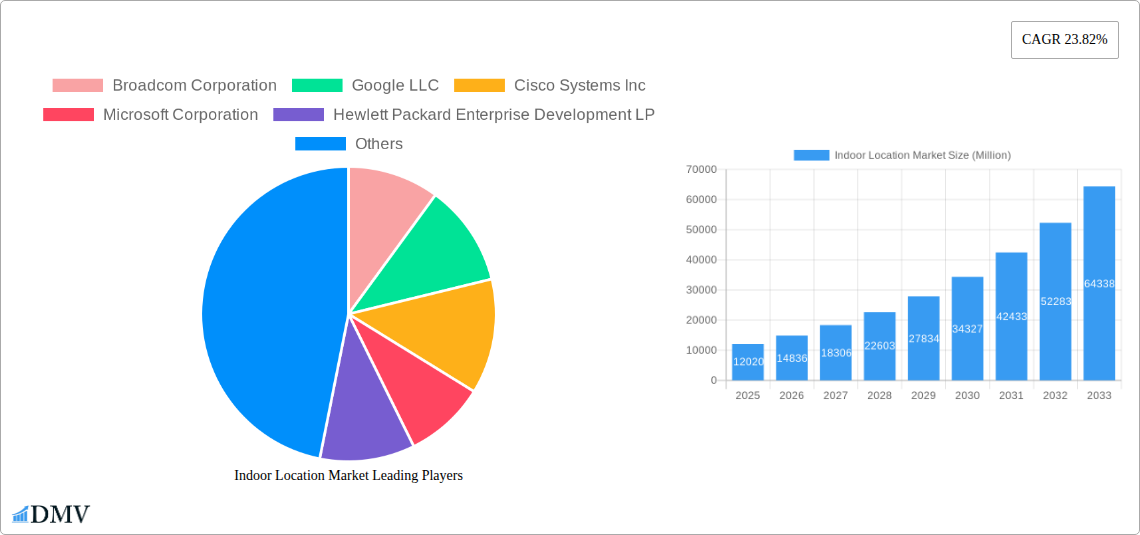
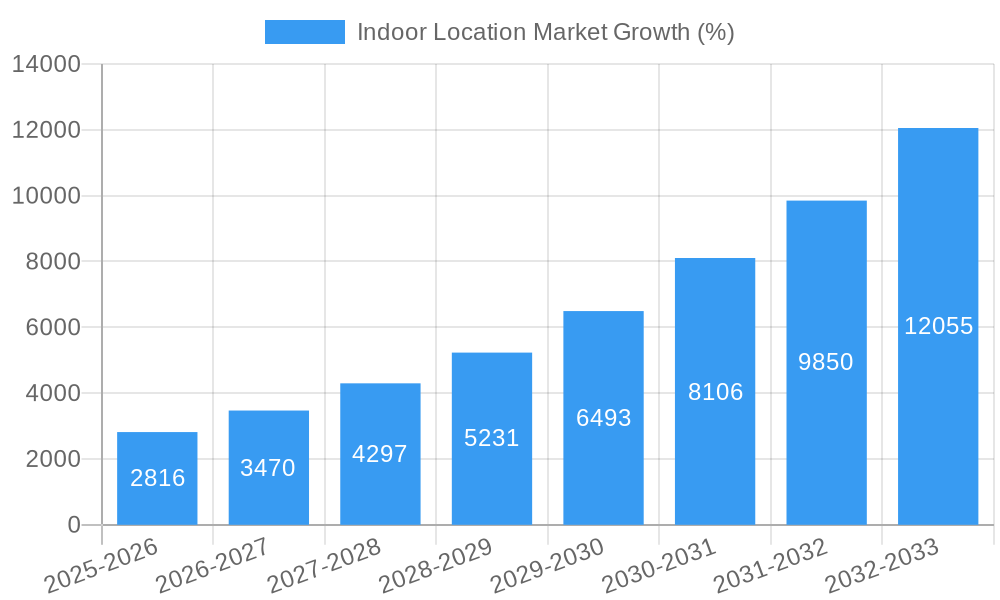
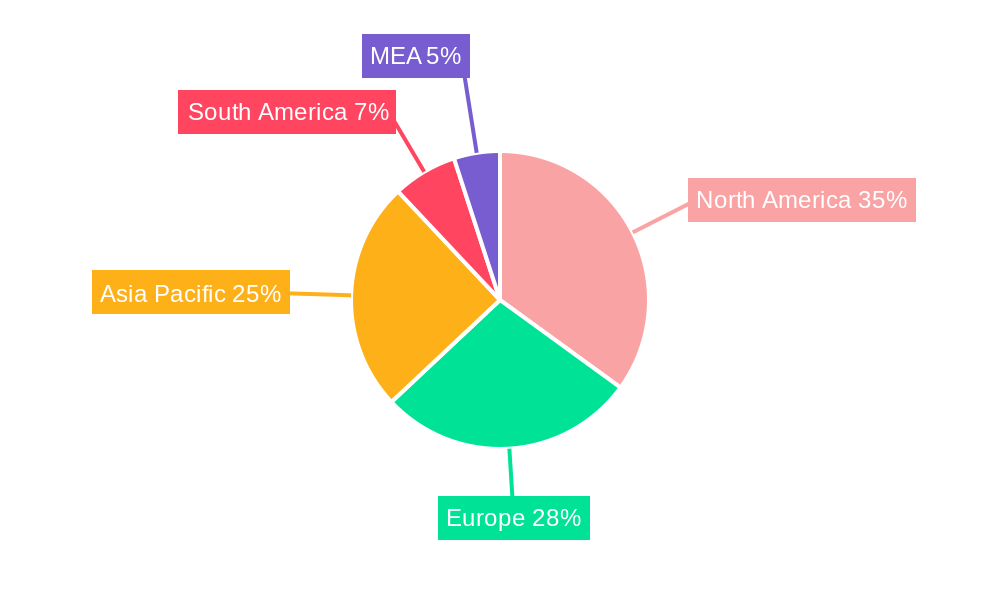
The global indoor location market is experiencing robust growth, projected to reach \$12.02 billion in 2025 and exhibiting a Compound Annual Growth Rate (CAGR) of 23.82% from 2025 to 2033. This expansion is driven by several key factors. The increasing adoption of smart devices and the Internet of Things (IoT) is fueling demand for precise indoor positioning technologies across diverse sectors. Furthermore, the rising need for enhanced security and safety measures, particularly in retail environments and public spaces, is driving the integration of indoor location solutions for asset tracking, personnel management, and emergency response. The development of sophisticated mapping and navigation systems within buildings also contributes significantly to market growth. Growth is particularly strong in sectors like retail, where indoor location services improve customer experience and operational efficiency through targeted advertising and inventory management. Similarly, the healthcare sector benefits from improved patient tracking and workflow optimization. The market is segmented by component (solutions and services), application (indoor navigation & maps, tracking and tracing, remote monitoring, and others), and end-user industry (retail, transportation & logistics, healthcare, and more). North America currently holds a significant market share, but the Asia-Pacific region is poised for rapid growth due to increasing infrastructure development and technological advancements.
The competitive landscape is characterized by a mix of established technology companies and specialized indoor location solution providers. Companies like Broadcom, Google, Cisco, and Microsoft leverage their existing infrastructure and expertise to offer integrated solutions. Meanwhile, specialized vendors like Inpixon, HID Global, and Sonitor focus on providing innovative technologies and services tailored to specific market needs. The market's future growth depends on ongoing technological advancements, such as the improvement of accuracy and reliability of indoor positioning systems using technologies like Bluetooth beacons, Wi-Fi positioning, and Ultra-Wideband (UWB). Overcoming challenges related to interoperability between different systems and addressing data privacy concerns will be crucial for sustained market expansion. The increasing adoption of cloud-based solutions and the integration of artificial intelligence (AI) and machine learning (ML) for advanced analytics are expected to shape the market's evolution in the coming years.
Indoor Location Market: A Comprehensive Report (2019-2033)
This insightful report provides a detailed analysis of the Indoor Location Market, offering a comprehensive overview of its current state, future trajectory, and key players. With a study period spanning from 2019 to 2033, a base year of 2025, and a forecast period from 2025 to 2033, this report is an invaluable resource for stakeholders seeking to understand and capitalize on this rapidly evolving market. The market is projected to reach xx Million by 2033, exhibiting a robust CAGR of xx% during the forecast period.
Indoor Location Market Market Composition & Trends
The Indoor Location Market is characterized by a moderately concentrated competitive landscape, with several major players vying for market share. The market's evolution is fueled by technological advancements in areas like AI, IoT, and BLE, alongside increasing demand for enhanced location-based services across diverse sectors. Regulatory landscapes vary across regions, influencing market adoption rates and impacting the development of new solutions. Substitute technologies, such as GPS and cellular triangulation, pose some competition, but the unique requirements for precise indoor positioning ensure continued demand for specialized indoor location solutions. End-user profiles reveal a diversified customer base, including retail giants, logistics companies, healthcare providers, and government agencies. The market has witnessed significant M&A activity in recent years, with deal values exceeding xx Million in aggregate, signaling the strategic importance of this technology sector.
- Market Share Distribution (2024): Google LLC (xx%), Broadcom Corporation (xx%), Cisco Systems Inc. (xx%), Others (xx%).
- M&A Deal Values (2019-2024): Total value exceeding xx Million.
- Key M&A Activities: Several strategic acquisitions have consolidated market share and expanded product portfolios.
Indoor Location Market Industry Evolution
The Indoor Location Market has experienced substantial growth over the historical period (2019-2024), driven by increasing adoption across various sectors. The market has witnessed a consistent growth rate of xx% during the historical period. Technological advancements, such as the proliferation of Wi-Fi, Bluetooth Low Energy (BLE), Ultra-Wideband (UWB), and improvements in sensor fusion techniques, have been key catalysts for innovation and market expansion. Simultaneously, shifting consumer demands for enhanced convenience, safety, and personalized experiences have fueled the growth of indoor location-based services. The retail sector, for example, has seen widespread adoption of indoor navigation and proximity marketing solutions to improve the customer experience. Similarly, the healthcare sector has leveraged these technologies for asset tracking and patient location monitoring. The forecast period (2025-2033) anticipates continued robust growth, driven by the emergence of AI-powered solutions and the expansion of 5G networks. This growth is estimated to reach xx Million by 2033.
Leading Regions, Countries, or Segments in Indoor Location Market
North America currently dominates the Indoor Location Market, driven by early adoption of advanced technologies and a robust investment landscape in both private and public sectors. Within North America, the United States is the leading country in market size and technological advancement.
- By Component: The Solutions segment holds the largest market share, followed by Services, reflecting the substantial demand for integrated systems and ongoing support.
- By Application: Indoor Navigation & Maps currently dominates the application segment, while the Tracking and Tracing Application segment is projected to experience the highest growth rate over the forecast period.
- By End-user Industry: The Retail sector demonstrates the highest market penetration, driven by the need for enhanced customer experience and improved operational efficiency. Healthcare and Transportation & Logistics sectors are expected to witness significant growth in the coming years.
Key Drivers:
- Significant investments in research and development of innovative indoor location technologies.
- Favorable regulatory environments in key regions, promoting innovation and adoption.
- Increased demand for location-based services across diverse end-user industries.
Indoor Location Market Product Innovations
Recent innovations focus on improving accuracy, reducing power consumption, and enhancing the seamless integration of indoor and outdoor location data. This includes the development of hybrid positioning systems combining multiple technologies (e.g., Wi-Fi, BLE, and UWB) and AI-powered algorithms for precise location tracking, even in challenging environments. The emergence of cloud-based platforms simplifies deployment and management while also providing enhanced analytics capabilities. Unique selling propositions include superior accuracy, ease of implementation, and robust scalability, making these solutions attractive to a wide range of clients.
Propelling Factors for Indoor Location Market Growth
Several factors are propelling the growth of the Indoor Location Market. Technological advancements, like improved sensor technology and AI-powered analytics, are continuously enhancing the accuracy and capabilities of indoor positioning systems. Economic factors, such as the increasing ROI on improved operational efficiency and enhanced customer experiences, are driving investment. Moreover, favorable government regulations and initiatives supporting the adoption of smart technologies further accelerate market growth. For instance, the increasing focus on safety and security, particularly in public spaces and healthcare settings, necessitates precise indoor location systems, promoting market adoption.
Obstacles in the Indoor Location Market Market
Despite its growth trajectory, several obstacles impede the Indoor Location Market's progress. Regulatory hurdles and varying standards across regions can hinder the seamless deployment of indoor positioning systems. Supply chain disruptions, particularly impacting sensor component availability, can constrain production and affect market growth. Furthermore, intense competition among established players and the emergence of new entrants create challenges for maintaining profitability and market share. For example, the high initial investment costs associated with implementing comprehensive indoor location solutions can deter some organizations.
Future Opportunities in Indoor Location Market
Future opportunities lie in the expansion of the market into new sectors, such as smart agriculture and industrial automation, where real-time location data can significantly improve processes. Advancements in technologies like 5G and IoT will further enhance the capabilities and applications of indoor location systems. The increasing adoption of AI-powered solutions and analytics will unlock new insights and applications in areas like predictive maintenance and personalized experiences, driving market expansion. The development of interoperable systems and open standards will facilitate greater collaboration and streamline deployment across various industries.
Major Players in the Indoor Location Market Ecosystem
- Broadcom Corporation
- Google LLC
- Cisco Systems Inc
- Microsoft Corporation
- Hewlett Packard Enterprise Development LP
- Inpixon
- HID Global Corporation
- Sonitor Technologies AS
- Acuity Brands Inc
- AiRISTA
- Mist Systems Inc
- Zebra Technologies Corporation
- Ubisense Limited
- CenTrak
- HERE Global BV
- Tack On
Key Developments in Indoor Location Market Industry
- October 2023: Sensative and Combain announced a strategic collaboration for AI-powered indoor/outdoor location solutions. This partnership significantly advances the capabilities of location services, particularly for seamless transitions between indoor and outdoor environments.
- March 2024: GeoComm and ELi Technology partnered to enhance school safety with the ATLS Location Service, improving indoor mapping accuracy via Wi-Fi access points. This development highlights the growing focus on safety and security applications within the Indoor Location Market.
Strategic Indoor Location Market Market Forecast
The Indoor Location Market is poised for continued robust growth, driven by technological advancements, increasing demand across diverse sectors, and supportive regulatory environments. The market’s expansion into new applications and geographical regions will further fuel this growth. The convergence of technologies like AI, IoT, and 5G will unlock significant opportunities, leading to a substantial increase in market value in the coming years. The potential for improved operational efficiency, enhanced customer experiences, and increased safety and security will continue to drive market adoption, making this a highly attractive sector for investment and innovation.
Indoor Location Market Segmentation
-
1. Component
- 1.1. Solutions
- 1.2. Services
-
2. Application
- 2.1. Indoor Navigation & Maps
- 2.2. Tracking and Tracing Application
- 2.3. Remote Monitoring and Emergency Management
- 2.4. Other Applications
-
3. End-user Industry
- 3.1. Retail
- 3.2. Transportation and Logistics
- 3.3. Healthcare
- 3.4. Telecom
- 3.5. Oil and Gas and Mining
- 3.6. Government and Public Sector
- 3.7. Manufacturing
- 3.8. Other End-user Industries
Indoor Location Market Segmentation By Geography
- 1. North America
- 2. Europe
- 3. Asia
- 4. Australia and New Zealand
- 5. Latin America
- 6. Middle East and Africa
Indoor Location Market REPORT HIGHLIGHTS
| Aspects | Details |
|---|---|
| Study Period | 2019-2033 |
| Base Year | 2024 |
| Estimated Year | 2025 |
| Forecast Period | 2025-2033 |
| Historical Period | 2019-2024 |
| Growth Rate | CAGR of 23.82% from 2019-2033 |
| Segmentation |
|
Table of Contents
- 1. Introduction
- 1.1. Research Scope
- 1.2. Market Segmentation
- 1.3. Research Methodology
- 1.4. Definitions and Assumptions
- 2. Executive Summary
- 2.1. Introduction
- 3. Market Dynamics
- 3.1. Introduction
- 3.2. Market Drivers
- 3.2.1 Growing Number of Applications Powered by Beacons and BLE Tags; Inefficiency of the GPS Technology in Indoor Premises; Growth of Connected Devices
- 3.2.2 Smartphones
- 3.2.3 and Location-based Applications
- 3.3. Market Restrains
- 3.3.1. Data and security related Issues; Deployment and Maintenance Challenges; Strict Rules and Regulations by Government
- 3.4. Market Trends
- 3.4.1. Transportation and Logistics Vertical to Hold a Dominant Market Share
- 4. Market Factor Analysis
- 4.1. Porters Five Forces
- 4.2. Supply/Value Chain
- 4.3. PESTEL analysis
- 4.4. Market Entropy
- 4.5. Patent/Trademark Analysis
- 5. Global Indoor Location Market Analysis, Insights and Forecast, 2019-2031
- 5.1. Market Analysis, Insights and Forecast - by Component
- 5.1.1. Solutions
- 5.1.2. Services
- 5.2. Market Analysis, Insights and Forecast - by Application
- 5.2.1. Indoor Navigation & Maps
- 5.2.2. Tracking and Tracing Application
- 5.2.3. Remote Monitoring and Emergency Management
- 5.2.4. Other Applications
- 5.3. Market Analysis, Insights and Forecast - by End-user Industry
- 5.3.1. Retail
- 5.3.2. Transportation and Logistics
- 5.3.3. Healthcare
- 5.3.4. Telecom
- 5.3.5. Oil and Gas and Mining
- 5.3.6. Government and Public Sector
- 5.3.7. Manufacturing
- 5.3.8. Other End-user Industries
- 5.4. Market Analysis, Insights and Forecast - by Region
- 5.4.1. North America
- 5.4.2. Europe
- 5.4.3. Asia
- 5.4.4. Australia and New Zealand
- 5.4.5. Latin America
- 5.4.6. Middle East and Africa
- 5.1. Market Analysis, Insights and Forecast - by Component
- 6. North America Indoor Location Market Analysis, Insights and Forecast, 2019-2031
- 6.1. Market Analysis, Insights and Forecast - by Component
- 6.1.1. Solutions
- 6.1.2. Services
- 6.2. Market Analysis, Insights and Forecast - by Application
- 6.2.1. Indoor Navigation & Maps
- 6.2.2. Tracking and Tracing Application
- 6.2.3. Remote Monitoring and Emergency Management
- 6.2.4. Other Applications
- 6.3. Market Analysis, Insights and Forecast - by End-user Industry
- 6.3.1. Retail
- 6.3.2. Transportation and Logistics
- 6.3.3. Healthcare
- 6.3.4. Telecom
- 6.3.5. Oil and Gas and Mining
- 6.3.6. Government and Public Sector
- 6.3.7. Manufacturing
- 6.3.8. Other End-user Industries
- 6.1. Market Analysis, Insights and Forecast - by Component
- 7. Europe Indoor Location Market Analysis, Insights and Forecast, 2019-2031
- 7.1. Market Analysis, Insights and Forecast - by Component
- 7.1.1. Solutions
- 7.1.2. Services
- 7.2. Market Analysis, Insights and Forecast - by Application
- 7.2.1. Indoor Navigation & Maps
- 7.2.2. Tracking and Tracing Application
- 7.2.3. Remote Monitoring and Emergency Management
- 7.2.4. Other Applications
- 7.3. Market Analysis, Insights and Forecast - by End-user Industry
- 7.3.1. Retail
- 7.3.2. Transportation and Logistics
- 7.3.3. Healthcare
- 7.3.4. Telecom
- 7.3.5. Oil and Gas and Mining
- 7.3.6. Government and Public Sector
- 7.3.7. Manufacturing
- 7.3.8. Other End-user Industries
- 7.1. Market Analysis, Insights and Forecast - by Component
- 8. Asia Indoor Location Market Analysis, Insights and Forecast, 2019-2031
- 8.1. Market Analysis, Insights and Forecast - by Component
- 8.1.1. Solutions
- 8.1.2. Services
- 8.2. Market Analysis, Insights and Forecast - by Application
- 8.2.1. Indoor Navigation & Maps
- 8.2.2. Tracking and Tracing Application
- 8.2.3. Remote Monitoring and Emergency Management
- 8.2.4. Other Applications
- 8.3. Market Analysis, Insights and Forecast - by End-user Industry
- 8.3.1. Retail
- 8.3.2. Transportation and Logistics
- 8.3.3. Healthcare
- 8.3.4. Telecom
- 8.3.5. Oil and Gas and Mining
- 8.3.6. Government and Public Sector
- 8.3.7. Manufacturing
- 8.3.8. Other End-user Industries
- 8.1. Market Analysis, Insights and Forecast - by Component
- 9. Australia and New Zealand Indoor Location Market Analysis, Insights and Forecast, 2019-2031
- 9.1. Market Analysis, Insights and Forecast - by Component
- 9.1.1. Solutions
- 9.1.2. Services
- 9.2. Market Analysis, Insights and Forecast - by Application
- 9.2.1. Indoor Navigation & Maps
- 9.2.2. Tracking and Tracing Application
- 9.2.3. Remote Monitoring and Emergency Management
- 9.2.4. Other Applications
- 9.3. Market Analysis, Insights and Forecast - by End-user Industry
- 9.3.1. Retail
- 9.3.2. Transportation and Logistics
- 9.3.3. Healthcare
- 9.3.4. Telecom
- 9.3.5. Oil and Gas and Mining
- 9.3.6. Government and Public Sector
- 9.3.7. Manufacturing
- 9.3.8. Other End-user Industries
- 9.1. Market Analysis, Insights and Forecast - by Component
- 10. Latin America Indoor Location Market Analysis, Insights and Forecast, 2019-2031
- 10.1. Market Analysis, Insights and Forecast - by Component
- 10.1.1. Solutions
- 10.1.2. Services
- 10.2. Market Analysis, Insights and Forecast - by Application
- 10.2.1. Indoor Navigation & Maps
- 10.2.2. Tracking and Tracing Application
- 10.2.3. Remote Monitoring and Emergency Management
- 10.2.4. Other Applications
- 10.3. Market Analysis, Insights and Forecast - by End-user Industry
- 10.3.1. Retail
- 10.3.2. Transportation and Logistics
- 10.3.3. Healthcare
- 10.3.4. Telecom
- 10.3.5. Oil and Gas and Mining
- 10.3.6. Government and Public Sector
- 10.3.7. Manufacturing
- 10.3.8. Other End-user Industries
- 10.1. Market Analysis, Insights and Forecast - by Component
- 11. Middle East and Africa Indoor Location Market Analysis, Insights and Forecast, 2019-2031
- 11.1. Market Analysis, Insights and Forecast - by Component
- 11.1.1. Solutions
- 11.1.2. Services
- 11.2. Market Analysis, Insights and Forecast - by Application
- 11.2.1. Indoor Navigation & Maps
- 11.2.2. Tracking and Tracing Application
- 11.2.3. Remote Monitoring and Emergency Management
- 11.2.4. Other Applications
- 11.3. Market Analysis, Insights and Forecast - by End-user Industry
- 11.3.1. Retail
- 11.3.2. Transportation and Logistics
- 11.3.3. Healthcare
- 11.3.4. Telecom
- 11.3.5. Oil and Gas and Mining
- 11.3.6. Government and Public Sector
- 11.3.7. Manufacturing
- 11.3.8. Other End-user Industries
- 11.1. Market Analysis, Insights and Forecast - by Component
- 12. North America Indoor Location Market Analysis, Insights and Forecast, 2019-2031
- 12.1. Market Analysis, Insights and Forecast - By Country/Sub-region
- 12.1.1 United States
- 12.1.2 Canada
- 12.1.3 Mexico
- 13. Europe Indoor Location Market Analysis, Insights and Forecast, 2019-2031
- 13.1. Market Analysis, Insights and Forecast - By Country/Sub-region
- 13.1.1 Germany
- 13.1.2 United Kingdom
- 13.1.3 France
- 13.1.4 Spain
- 13.1.5 Italy
- 13.1.6 Spain
- 13.1.7 Belgium
- 13.1.8 Netherland
- 13.1.9 Nordics
- 13.1.10 Rest of Europe
- 14. Asia Pacific Indoor Location Market Analysis, Insights and Forecast, 2019-2031
- 14.1. Market Analysis, Insights and Forecast - By Country/Sub-region
- 14.1.1 China
- 14.1.2 Japan
- 14.1.3 India
- 14.1.4 South Korea
- 14.1.5 Southeast Asia
- 14.1.6 Australia
- 14.1.7 Indonesia
- 14.1.8 Phillipes
- 14.1.9 Singapore
- 14.1.10 Thailandc
- 14.1.11 Rest of Asia Pacific
- 15. South America Indoor Location Market Analysis, Insights and Forecast, 2019-2031
- 15.1. Market Analysis, Insights and Forecast - By Country/Sub-region
- 15.1.1 Brazil
- 15.1.2 Argentina
- 15.1.3 Peru
- 15.1.4 Chile
- 15.1.5 Colombia
- 15.1.6 Ecuador
- 15.1.7 Venezuela
- 15.1.8 Rest of South America
- 16. North America Indoor Location Market Analysis, Insights and Forecast, 2019-2031
- 16.1. Market Analysis, Insights and Forecast - By Country/Sub-region
- 16.1.1 United States
- 16.1.2 Canada
- 16.1.3 Mexico
- 17. MEA Indoor Location Market Analysis, Insights and Forecast, 2019-2031
- 17.1. Market Analysis, Insights and Forecast - By Country/Sub-region
- 17.1.1 United Arab Emirates
- 17.1.2 Saudi Arabia
- 17.1.3 South Africa
- 17.1.4 Rest of Middle East and Africa
- 18. Competitive Analysis
- 18.1. Global Market Share Analysis 2024
- 18.2. Company Profiles
- 18.2.1 Broadcom Corporation
- 18.2.1.1. Overview
- 18.2.1.2. Products
- 18.2.1.3. SWOT Analysis
- 18.2.1.4. Recent Developments
- 18.2.1.5. Financials (Based on Availability)
- 18.2.2 Google LLC
- 18.2.2.1. Overview
- 18.2.2.2. Products
- 18.2.2.3. SWOT Analysis
- 18.2.2.4. Recent Developments
- 18.2.2.5. Financials (Based on Availability)
- 18.2.3 Cisco Systems Inc
- 18.2.3.1. Overview
- 18.2.3.2. Products
- 18.2.3.3. SWOT Analysis
- 18.2.3.4. Recent Developments
- 18.2.3.5. Financials (Based on Availability)
- 18.2.4 Microsoft Corporation
- 18.2.4.1. Overview
- 18.2.4.2. Products
- 18.2.4.3. SWOT Analysis
- 18.2.4.4. Recent Developments
- 18.2.4.5. Financials (Based on Availability)
- 18.2.5 Hewlett Packard Enterprise Development LP
- 18.2.5.1. Overview
- 18.2.5.2. Products
- 18.2.5.3. SWOT Analysis
- 18.2.5.4. Recent Developments
- 18.2.5.5. Financials (Based on Availability)
- 18.2.6 Inpixon
- 18.2.6.1. Overview
- 18.2.6.2. Products
- 18.2.6.3. SWOT Analysis
- 18.2.6.4. Recent Developments
- 18.2.6.5. Financials (Based on Availability)
- 18.2.7 HID Global Corporation
- 18.2.7.1. Overview
- 18.2.7.2. Products
- 18.2.7.3. SWOT Analysis
- 18.2.7.4. Recent Developments
- 18.2.7.5. Financials (Based on Availability)
- 18.2.8 Sonitor Technologies AS
- 18.2.8.1. Overview
- 18.2.8.2. Products
- 18.2.8.3. SWOT Analysis
- 18.2.8.4. Recent Developments
- 18.2.8.5. Financials (Based on Availability)
- 18.2.9 Acuity Brands Inc
- 18.2.9.1. Overview
- 18.2.9.2. Products
- 18.2.9.3. SWOT Analysis
- 18.2.9.4. Recent Developments
- 18.2.9.5. Financials (Based on Availability)
- 18.2.10 AiRISTA
- 18.2.10.1. Overview
- 18.2.10.2. Products
- 18.2.10.3. SWOT Analysis
- 18.2.10.4. Recent Developments
- 18.2.10.5. Financials (Based on Availability)
- 18.2.11 Mist Systems Inc
- 18.2.11.1. Overview
- 18.2.11.2. Products
- 18.2.11.3. SWOT Analysis
- 18.2.11.4. Recent Developments
- 18.2.11.5. Financials (Based on Availability)
- 18.2.12 Zebra Technologies Corporation
- 18.2.12.1. Overview
- 18.2.12.2. Products
- 18.2.12.3. SWOT Analysis
- 18.2.12.4. Recent Developments
- 18.2.12.5. Financials (Based on Availability)
- 18.2.13 Ubisense Limited
- 18.2.13.1. Overview
- 18.2.13.2. Products
- 18.2.13.3. SWOT Analysis
- 18.2.13.4. Recent Developments
- 18.2.13.5. Financials (Based on Availability)
- 18.2.14 CenTrak
- 18.2.14.1. Overview
- 18.2.14.2. Products
- 18.2.14.3. SWOT Analysis
- 18.2.14.4. Recent Developments
- 18.2.14.5. Financials (Based on Availability)
- 18.2.15 HERE Global BV
- 18.2.15.1. Overview
- 18.2.15.2. Products
- 18.2.15.3. SWOT Analysis
- 18.2.15.4. Recent Developments
- 18.2.15.5. Financials (Based on Availability)
- 18.2.16 Tack On
- 18.2.16.1. Overview
- 18.2.16.2. Products
- 18.2.16.3. SWOT Analysis
- 18.2.16.4. Recent Developments
- 18.2.16.5. Financials (Based on Availability)
- 18.2.1 Broadcom Corporation
List of Figures
- Figure 1: Global Indoor Location Market Revenue Breakdown (Million, %) by Region 2024 & 2032
- Figure 2: North America Indoor Location Market Revenue (Million), by Country 2024 & 2032
- Figure 3: North America Indoor Location Market Revenue Share (%), by Country 2024 & 2032
- Figure 4: Europe Indoor Location Market Revenue (Million), by Country 2024 & 2032
- Figure 5: Europe Indoor Location Market Revenue Share (%), by Country 2024 & 2032
- Figure 6: Asia Pacific Indoor Location Market Revenue (Million), by Country 2024 & 2032
- Figure 7: Asia Pacific Indoor Location Market Revenue Share (%), by Country 2024 & 2032
- Figure 8: South America Indoor Location Market Revenue (Million), by Country 2024 & 2032
- Figure 9: South America Indoor Location Market Revenue Share (%), by Country 2024 & 2032
- Figure 10: North America Indoor Location Market Revenue (Million), by Country 2024 & 2032
- Figure 11: North America Indoor Location Market Revenue Share (%), by Country 2024 & 2032
- Figure 12: MEA Indoor Location Market Revenue (Million), by Country 2024 & 2032
- Figure 13: MEA Indoor Location Market Revenue Share (%), by Country 2024 & 2032
- Figure 14: North America Indoor Location Market Revenue (Million), by Component 2024 & 2032
- Figure 15: North America Indoor Location Market Revenue Share (%), by Component 2024 & 2032
- Figure 16: North America Indoor Location Market Revenue (Million), by Application 2024 & 2032
- Figure 17: North America Indoor Location Market Revenue Share (%), by Application 2024 & 2032
- Figure 18: North America Indoor Location Market Revenue (Million), by End-user Industry 2024 & 2032
- Figure 19: North America Indoor Location Market Revenue Share (%), by End-user Industry 2024 & 2032
- Figure 20: North America Indoor Location Market Revenue (Million), by Country 2024 & 2032
- Figure 21: North America Indoor Location Market Revenue Share (%), by Country 2024 & 2032
- Figure 22: Europe Indoor Location Market Revenue (Million), by Component 2024 & 2032
- Figure 23: Europe Indoor Location Market Revenue Share (%), by Component 2024 & 2032
- Figure 24: Europe Indoor Location Market Revenue (Million), by Application 2024 & 2032
- Figure 25: Europe Indoor Location Market Revenue Share (%), by Application 2024 & 2032
- Figure 26: Europe Indoor Location Market Revenue (Million), by End-user Industry 2024 & 2032
- Figure 27: Europe Indoor Location Market Revenue Share (%), by End-user Industry 2024 & 2032
- Figure 28: Europe Indoor Location Market Revenue (Million), by Country 2024 & 2032
- Figure 29: Europe Indoor Location Market Revenue Share (%), by Country 2024 & 2032
- Figure 30: Asia Indoor Location Market Revenue (Million), by Component 2024 & 2032
- Figure 31: Asia Indoor Location Market Revenue Share (%), by Component 2024 & 2032
- Figure 32: Asia Indoor Location Market Revenue (Million), by Application 2024 & 2032
- Figure 33: Asia Indoor Location Market Revenue Share (%), by Application 2024 & 2032
- Figure 34: Asia Indoor Location Market Revenue (Million), by End-user Industry 2024 & 2032
- Figure 35: Asia Indoor Location Market Revenue Share (%), by End-user Industry 2024 & 2032
- Figure 36: Asia Indoor Location Market Revenue (Million), by Country 2024 & 2032
- Figure 37: Asia Indoor Location Market Revenue Share (%), by Country 2024 & 2032
- Figure 38: Australia and New Zealand Indoor Location Market Revenue (Million), by Component 2024 & 2032
- Figure 39: Australia and New Zealand Indoor Location Market Revenue Share (%), by Component 2024 & 2032
- Figure 40: Australia and New Zealand Indoor Location Market Revenue (Million), by Application 2024 & 2032
- Figure 41: Australia and New Zealand Indoor Location Market Revenue Share (%), by Application 2024 & 2032
- Figure 42: Australia and New Zealand Indoor Location Market Revenue (Million), by End-user Industry 2024 & 2032
- Figure 43: Australia and New Zealand Indoor Location Market Revenue Share (%), by End-user Industry 2024 & 2032
- Figure 44: Australia and New Zealand Indoor Location Market Revenue (Million), by Country 2024 & 2032
- Figure 45: Australia and New Zealand Indoor Location Market Revenue Share (%), by Country 2024 & 2032
- Figure 46: Latin America Indoor Location Market Revenue (Million), by Component 2024 & 2032
- Figure 47: Latin America Indoor Location Market Revenue Share (%), by Component 2024 & 2032
- Figure 48: Latin America Indoor Location Market Revenue (Million), by Application 2024 & 2032
- Figure 49: Latin America Indoor Location Market Revenue Share (%), by Application 2024 & 2032
- Figure 50: Latin America Indoor Location Market Revenue (Million), by End-user Industry 2024 & 2032
- Figure 51: Latin America Indoor Location Market Revenue Share (%), by End-user Industry 2024 & 2032
- Figure 52: Latin America Indoor Location Market Revenue (Million), by Country 2024 & 2032
- Figure 53: Latin America Indoor Location Market Revenue Share (%), by Country 2024 & 2032
- Figure 54: Middle East and Africa Indoor Location Market Revenue (Million), by Component 2024 & 2032
- Figure 55: Middle East and Africa Indoor Location Market Revenue Share (%), by Component 2024 & 2032
- Figure 56: Middle East and Africa Indoor Location Market Revenue (Million), by Application 2024 & 2032
- Figure 57: Middle East and Africa Indoor Location Market Revenue Share (%), by Application 2024 & 2032
- Figure 58: Middle East and Africa Indoor Location Market Revenue (Million), by End-user Industry 2024 & 2032
- Figure 59: Middle East and Africa Indoor Location Market Revenue Share (%), by End-user Industry 2024 & 2032
- Figure 60: Middle East and Africa Indoor Location Market Revenue (Million), by Country 2024 & 2032
- Figure 61: Middle East and Africa Indoor Location Market Revenue Share (%), by Country 2024 & 2032
List of Tables
- Table 1: Global Indoor Location Market Revenue Million Forecast, by Region 2019 & 2032
- Table 2: Global Indoor Location Market Revenue Million Forecast, by Component 2019 & 2032
- Table 3: Global Indoor Location Market Revenue Million Forecast, by Application 2019 & 2032
- Table 4: Global Indoor Location Market Revenue Million Forecast, by End-user Industry 2019 & 2032
- Table 5: Global Indoor Location Market Revenue Million Forecast, by Region 2019 & 2032
- Table 6: Global Indoor Location Market Revenue Million Forecast, by Country 2019 & 2032
- Table 7: United States Indoor Location Market Revenue (Million) Forecast, by Application 2019 & 2032
- Table 8: Canada Indoor Location Market Revenue (Million) Forecast, by Application 2019 & 2032
- Table 9: Mexico Indoor Location Market Revenue (Million) Forecast, by Application 2019 & 2032
- Table 10: Global Indoor Location Market Revenue Million Forecast, by Country 2019 & 2032
- Table 11: Germany Indoor Location Market Revenue (Million) Forecast, by Application 2019 & 2032
- Table 12: United Kingdom Indoor Location Market Revenue (Million) Forecast, by Application 2019 & 2032
- Table 13: France Indoor Location Market Revenue (Million) Forecast, by Application 2019 & 2032
- Table 14: Spain Indoor Location Market Revenue (Million) Forecast, by Application 2019 & 2032
- Table 15: Italy Indoor Location Market Revenue (Million) Forecast, by Application 2019 & 2032
- Table 16: Spain Indoor Location Market Revenue (Million) Forecast, by Application 2019 & 2032
- Table 17: Belgium Indoor Location Market Revenue (Million) Forecast, by Application 2019 & 2032
- Table 18: Netherland Indoor Location Market Revenue (Million) Forecast, by Application 2019 & 2032
- Table 19: Nordics Indoor Location Market Revenue (Million) Forecast, by Application 2019 & 2032
- Table 20: Rest of Europe Indoor Location Market Revenue (Million) Forecast, by Application 2019 & 2032
- Table 21: Global Indoor Location Market Revenue Million Forecast, by Country 2019 & 2032
- Table 22: China Indoor Location Market Revenue (Million) Forecast, by Application 2019 & 2032
- Table 23: Japan Indoor Location Market Revenue (Million) Forecast, by Application 2019 & 2032
- Table 24: India Indoor Location Market Revenue (Million) Forecast, by Application 2019 & 2032
- Table 25: South Korea Indoor Location Market Revenue (Million) Forecast, by Application 2019 & 2032
- Table 26: Southeast Asia Indoor Location Market Revenue (Million) Forecast, by Application 2019 & 2032
- Table 27: Australia Indoor Location Market Revenue (Million) Forecast, by Application 2019 & 2032
- Table 28: Indonesia Indoor Location Market Revenue (Million) Forecast, by Application 2019 & 2032
- Table 29: Phillipes Indoor Location Market Revenue (Million) Forecast, by Application 2019 & 2032
- Table 30: Singapore Indoor Location Market Revenue (Million) Forecast, by Application 2019 & 2032
- Table 31: Thailandc Indoor Location Market Revenue (Million) Forecast, by Application 2019 & 2032
- Table 32: Rest of Asia Pacific Indoor Location Market Revenue (Million) Forecast, by Application 2019 & 2032
- Table 33: Global Indoor Location Market Revenue Million Forecast, by Country 2019 & 2032
- Table 34: Brazil Indoor Location Market Revenue (Million) Forecast, by Application 2019 & 2032
- Table 35: Argentina Indoor Location Market Revenue (Million) Forecast, by Application 2019 & 2032
- Table 36: Peru Indoor Location Market Revenue (Million) Forecast, by Application 2019 & 2032
- Table 37: Chile Indoor Location Market Revenue (Million) Forecast, by Application 2019 & 2032
- Table 38: Colombia Indoor Location Market Revenue (Million) Forecast, by Application 2019 & 2032
- Table 39: Ecuador Indoor Location Market Revenue (Million) Forecast, by Application 2019 & 2032
- Table 40: Venezuela Indoor Location Market Revenue (Million) Forecast, by Application 2019 & 2032
- Table 41: Rest of South America Indoor Location Market Revenue (Million) Forecast, by Application 2019 & 2032
- Table 42: Global Indoor Location Market Revenue Million Forecast, by Country 2019 & 2032
- Table 43: United States Indoor Location Market Revenue (Million) Forecast, by Application 2019 & 2032
- Table 44: Canada Indoor Location Market Revenue (Million) Forecast, by Application 2019 & 2032
- Table 45: Mexico Indoor Location Market Revenue (Million) Forecast, by Application 2019 & 2032
- Table 46: Global Indoor Location Market Revenue Million Forecast, by Country 2019 & 2032
- Table 47: United Arab Emirates Indoor Location Market Revenue (Million) Forecast, by Application 2019 & 2032
- Table 48: Saudi Arabia Indoor Location Market Revenue (Million) Forecast, by Application 2019 & 2032
- Table 49: South Africa Indoor Location Market Revenue (Million) Forecast, by Application 2019 & 2032
- Table 50: Rest of Middle East and Africa Indoor Location Market Revenue (Million) Forecast, by Application 2019 & 2032
- Table 51: Global Indoor Location Market Revenue Million Forecast, by Component 2019 & 2032
- Table 52: Global Indoor Location Market Revenue Million Forecast, by Application 2019 & 2032
- Table 53: Global Indoor Location Market Revenue Million Forecast, by End-user Industry 2019 & 2032
- Table 54: Global Indoor Location Market Revenue Million Forecast, by Country 2019 & 2032
- Table 55: Global Indoor Location Market Revenue Million Forecast, by Component 2019 & 2032
- Table 56: Global Indoor Location Market Revenue Million Forecast, by Application 2019 & 2032
- Table 57: Global Indoor Location Market Revenue Million Forecast, by End-user Industry 2019 & 2032
- Table 58: Global Indoor Location Market Revenue Million Forecast, by Country 2019 & 2032
- Table 59: Global Indoor Location Market Revenue Million Forecast, by Component 2019 & 2032
- Table 60: Global Indoor Location Market Revenue Million Forecast, by Application 2019 & 2032
- Table 61: Global Indoor Location Market Revenue Million Forecast, by End-user Industry 2019 & 2032
- Table 62: Global Indoor Location Market Revenue Million Forecast, by Country 2019 & 2032
- Table 63: Global Indoor Location Market Revenue Million Forecast, by Component 2019 & 2032
- Table 64: Global Indoor Location Market Revenue Million Forecast, by Application 2019 & 2032
- Table 65: Global Indoor Location Market Revenue Million Forecast, by End-user Industry 2019 & 2032
- Table 66: Global Indoor Location Market Revenue Million Forecast, by Country 2019 & 2032
- Table 67: Global Indoor Location Market Revenue Million Forecast, by Component 2019 & 2032
- Table 68: Global Indoor Location Market Revenue Million Forecast, by Application 2019 & 2032
- Table 69: Global Indoor Location Market Revenue Million Forecast, by End-user Industry 2019 & 2032
- Table 70: Global Indoor Location Market Revenue Million Forecast, by Country 2019 & 2032
- Table 71: Global Indoor Location Market Revenue Million Forecast, by Component 2019 & 2032
- Table 72: Global Indoor Location Market Revenue Million Forecast, by Application 2019 & 2032
- Table 73: Global Indoor Location Market Revenue Million Forecast, by End-user Industry 2019 & 2032
- Table 74: Global Indoor Location Market Revenue Million Forecast, by Country 2019 & 2032
Frequently Asked Questions
1. What is the projected Compound Annual Growth Rate (CAGR) of the Indoor Location Market?
The projected CAGR is approximately 23.82%.
2. Which companies are prominent players in the Indoor Location Market?
Key companies in the market include Broadcom Corporation, Google LLC, Cisco Systems Inc, Microsoft Corporation, Hewlett Packard Enterprise Development LP, Inpixon, HID Global Corporation, Sonitor Technologies AS, Acuity Brands Inc, AiRISTA, Mist Systems Inc, Zebra Technologies Corporation, Ubisense Limited, CenTrak, HERE Global BV, Tack On.
3. What are the main segments of the Indoor Location Market?
The market segments include Component, Application, End-user Industry.
4. Can you provide details about the market size?
The market size is estimated to be USD 12.02 Million as of 2022.
5. What are some drivers contributing to market growth?
Growing Number of Applications Powered by Beacons and BLE Tags; Inefficiency of the GPS Technology in Indoor Premises; Growth of Connected Devices. Smartphones. and Location-based Applications.
6. What are the notable trends driving market growth?
Transportation and Logistics Vertical to Hold a Dominant Market Share.
7. Are there any restraints impacting market growth?
Data and security related Issues; Deployment and Maintenance Challenges; Strict Rules and Regulations by Government.
8. Can you provide examples of recent developments in the market?
March 2024: GeoComm and ELi Technology announced their partnership, which aims at enhancing school safety with the ATLS Location Service, where ATLS is an innovative, easily integrated location and mapping service, combining ELi Technology's patented EML with GeoComm's technology, enabling accurate indoor location mapping via Wi-Fi access points.
9. What pricing options are available for accessing the report?
Pricing options include single-user, multi-user, and enterprise licenses priced at USD 4750, USD 5250, and USD 8750 respectively.
10. Is the market size provided in terms of value or volume?
The market size is provided in terms of value, measured in Million.
11. Are there any specific market keywords associated with the report?
Yes, the market keyword associated with the report is "Indoor Location Market," which aids in identifying and referencing the specific market segment covered.
12. How do I determine which pricing option suits my needs best?
The pricing options vary based on user requirements and access needs. Individual users may opt for single-user licenses, while businesses requiring broader access may choose multi-user or enterprise licenses for cost-effective access to the report.
13. Are there any additional resources or data provided in the Indoor Location Market report?
While the report offers comprehensive insights, it's advisable to review the specific contents or supplementary materials provided to ascertain if additional resources or data are available.
14. How can I stay updated on further developments or reports in the Indoor Location Market?
To stay informed about further developments, trends, and reports in the Indoor Location Market, consider subscribing to industry newsletters, following relevant companies and organizations, or regularly checking reputable industry news sources and publications.
Methodology
Step 1 - Identification of Relevant Samples Size from Population Database


Step 2 - Approaches for Defining Global Market Size (Value, Volume* & Price*)

Note*: In applicable scenarios
Step 3 - Data Sources
Primary Research
- Web Analytics
- Survey Reports
- Research Institute
- Latest Research Reports
- Opinion Leaders
Secondary Research
- Annual Reports
- White Paper
- Latest Press Release
- Industry Association
- Paid Database
- Investor Presentations

Step 4 - Data Triangulation
Involves using different sources of information in order to increase the validity of a study
These sources are likely to be stakeholders in a program - participants, other researchers, program staff, other community members, and so on.
Then we put all data in single framework & apply various statistical tools to find out the dynamic on the market.
During the analysis stage, feedback from the stakeholder groups would be compared to determine areas of agreement as well as areas of divergence
