

Key Insights
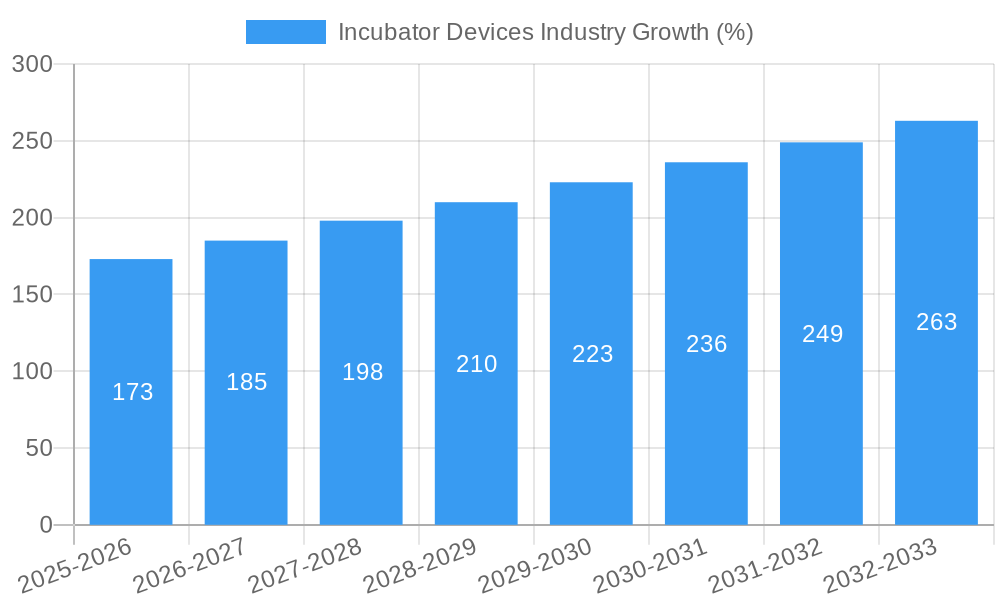
The global incubator devices market, encompassing neonatal incubators, microbiological incubators, and other related products, is experiencing robust growth, projected at a 6.90% CAGR from 2019 to 2033. This expansion is driven primarily by the increasing prevalence of premature births and the rising demand for advanced neonatal care, coupled with technological advancements leading to more sophisticated and efficient incubator designs. Hospitals and birthing centers remain the largest end-users, reflecting the critical role of incubators in neonatal intensive care units (NICUs). Furthermore, the growing adoption of microbiological incubators in research and diagnostic laboratories contributes significantly to market growth. Geographical expansion is also a key driver, with developing economies in Asia-Pacific and other regions experiencing rapid infrastructure development and increased healthcare spending. However, high initial investment costs for advanced incubators and stringent regulatory approvals can act as restraints on market expansion, particularly in resource-constrained settings. Leading players like GE Healthcare, Thermo Fisher Scientific, and others are investing heavily in research and development to introduce innovative products with enhanced features, such as improved temperature control, humidity regulation, and built-in monitoring systems, which are fueling market competitiveness.
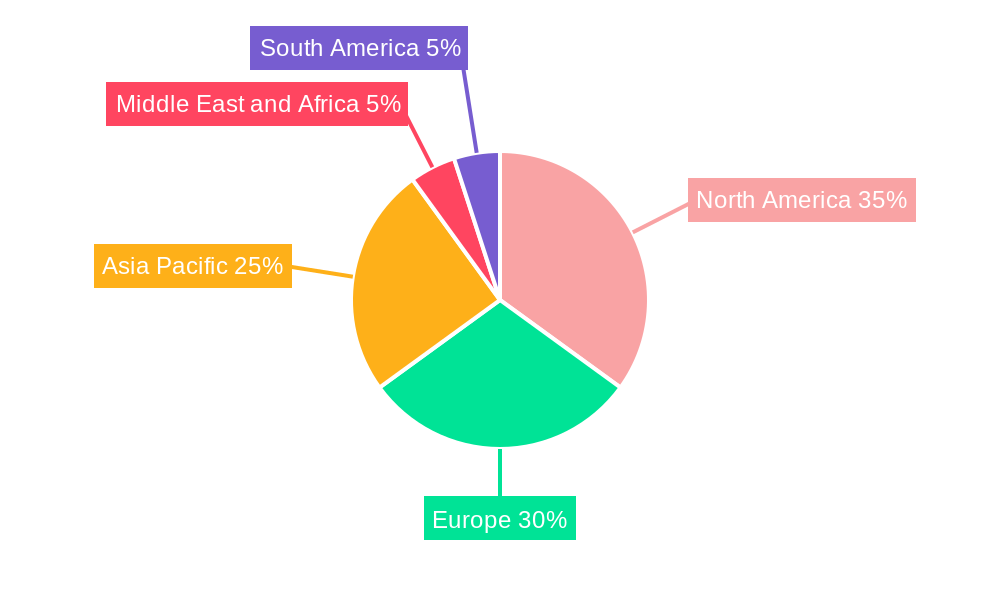
The market segmentation highlights the significant contribution of neonatal incubators to the overall market value. The prevalence of preterm births and the necessity for specialized care significantly impact the demand for these products. The geographical distribution of market share likely reflects the varying levels of healthcare infrastructure and economic development across regions. North America and Europe currently hold substantial market share due to advanced healthcare systems and higher per capita healthcare expenditure, but the Asia-Pacific region is expected to witness significant growth in the forecast period driven by population growth and increasing healthcare investments. Competitive landscape analysis suggests a mix of established multinational corporations and specialized medical device manufacturers, driving innovation and shaping market dynamics. Future growth will hinge on continuous technological improvements, expansion into emerging markets, and strategic partnerships to ensure wider accessibility of these life-saving devices.
Incubator Devices Industry: A Comprehensive Market Report (2019-2033)
This insightful report provides a detailed analysis of the global incubator devices market, encompassing historical data (2019-2024), the base year (2025), and a comprehensive forecast (2025-2033). The study covers key market segments, leading players, and emerging trends, offering valuable insights for stakeholders seeking to navigate this dynamic sector. The market is projected to reach xx Million by 2033, presenting significant opportunities for growth and investment.
Incubator Devices Industry Market Composition & Trends
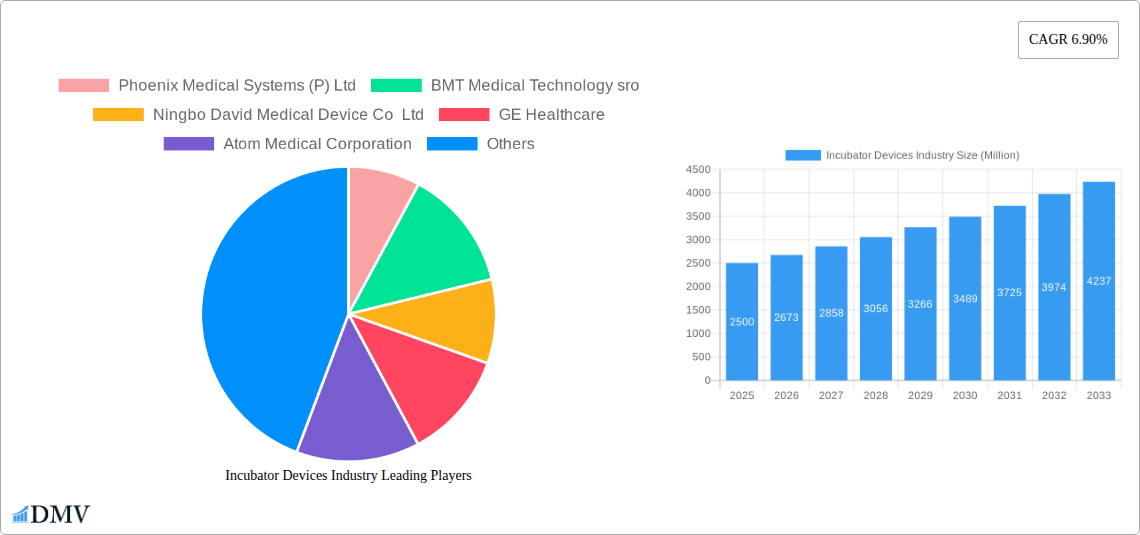
The global incubator devices market, valued at $xx Million in 2025, exhibits a moderately concentrated landscape with key players holding significant market share. Market leaders such as GE Healthcare and Thermo Fisher Scientific Inc. dominate specific segments, while regional players like Phoenix Medical Systems (P) Ltd and Ningbo David Medical Device Co Ltd cater to niche markets. The market share distribution among the top 5 players is approximately xx%, highlighting the competitive intensity. Innovation in areas such as precision temperature control, remote monitoring capabilities, and advanced sterilization techniques are pivotal drivers. The regulatory landscape, varying across regions, significantly impacts market entry and product approval timelines. Substitute products, such as specialized warming devices, pose a competitive challenge. End users, primarily hospitals and birthing centers, diagnostic labs, and research institutions, drive market demand. M&A activity in the past five years has involved deals valued at approximately $xx Million, with a focus on expanding product portfolios and geographical reach.
- Market Concentration: Moderately concentrated, with top 5 players holding xx% market share.
- Innovation Catalysts: Advanced temperature control, remote monitoring, and sterilization technologies.
- Regulatory Landscape: Varies across regions, impacting product approvals.
- Substitute Products: Specialized warming devices pose a competitive threat.
- End-User Profile: Primarily hospitals, birthing centers, diagnostic labs, and research facilities.
- M&A Activity: xx Million in deal values over the past 5 years.
Incubator Devices Industry Industry Evolution
The incubator devices market has witnessed substantial growth over the past five years (2019-2024), with a CAGR of xx%. This growth is primarily attributed to technological advancements, increasing healthcare infrastructure investment, and rising prevalence of diseases requiring incubation. The adoption of neonatal incubators, particularly in developing nations, has fueled market expansion. Technological innovations, such as the introduction of smart incubators with integrated monitoring systems and improved energy efficiency, have significantly impacted market dynamics. Growing demand for sophisticated microbiological incubators in research and diagnostic applications further contributes to market growth. Consumer demand is shifting towards user-friendly, cost-effective, and technologically advanced devices, leading manufacturers to focus on innovation and product differentiation. The market is projected to maintain a strong growth trajectory in the forecast period (2025-2033), driven by factors such as increasing birth rates, rising healthcare expenditure, and the development of new applications for incubator devices.
Leading Regions, Countries, or Segments in Incubator Devices Industry
North America currently holds the largest market share in the incubator devices industry, driven by robust healthcare infrastructure, high adoption rates of advanced technologies, and favorable regulatory environments. Within product types, Neonatal Incubators represent the largest segment, fueled by rising birth rates and increasing neonatal intensive care unit (NICU) capacity. Hospitals and Birthing Centers constitute the largest end-user segment.
- Key Drivers for North America: High healthcare expenditure, advanced technological adoption, and robust regulatory support.
- Key Drivers for Neonatal Incubators: Rising birth rates and increasing NICU capacity.
- Key Drivers for Hospitals and Birthing Centers: High concentration of patients requiring incubation services.
Incubator Devices Industry Product Innovations
Recent years have witnessed significant advancements in incubator device technology, including the introduction of smart incubators with integrated monitoring systems, improved temperature control mechanisms, and enhanced safety features. These innovations enhance the accuracy, efficiency, and overall performance of incubators, improving patient outcomes and reducing operational costs. Unique selling propositions include features such as remote monitoring capabilities, automated data logging, and user-friendly interfaces.
Propelling Factors for Incubator Devices Industry Growth
Technological advancements, such as the development of smart incubators with remote monitoring capabilities and improved temperature control, are a major growth driver. Rising healthcare spending globally, coupled with expanding healthcare infrastructure, particularly in developing economies, is another significant factor. Favorable regulatory environments and supportive government initiatives in several countries promote market growth.
Obstacles in the Incubator Devices Industry Market
Stringent regulatory approvals and compliance requirements can delay product launches and increase development costs. Supply chain disruptions, particularly concerning essential components, can impact production and delivery timelines. Intense competition among established players and emerging market entrants creates pricing pressures.
Future Opportunities in Incubator Devices Industry
The emergence of new applications for incubator devices in research and biotechnology presents significant growth opportunities. The development of more compact, portable, and energy-efficient incubators caters to diverse settings. Expansion into untapped markets in developing countries presents substantial growth potential.
Major Players in the Incubator Devices Industry Ecosystem
- GE Healthcare
- Thermo Fisher Scientific Inc
- Phoenix Medical Systems (P) Ltd
- BMT Medical Technology sro
- Ningbo David Medical Device Co Ltd
- Atom Medical Corporation
- Andreas Hettich GmbH & Co KG
- Zhengzhou Dison Instrument and Meter Co Ltd
- Medhold Medical (PTY) Ltd
- Dragerwerk AG & Co KGaA
- Archimed (Natus Medical Incorporated)
- PHC Corporation
Key Developments in Incubator Devices Industry Industry
- May 2022: Cook Medical launched the MINC+ benchtop incubator for IVF clinics, representing a significant advancement in assisted reproductive technology.
- October 2022: The launch of Unit-9, a medical technology incubator in Birmingham, UK, fosters innovation and accelerates the development of new medical devices.
Strategic Incubator Devices Industry Market Forecast
The incubator devices market is poised for robust growth in the forecast period (2025-2033), driven by technological innovations, increasing healthcare expenditure, and expansion into new markets. The market's potential is significant, with opportunities arising from new applications, improved product features, and expanding global healthcare infrastructure.
Incubator Devices Industry Segmentation
-
1. Product Type
-
1.1. Neonatal Incubators
- 1.1.1. Portable or Transport Incubator
- 1.1.2. Open Box Incubator
- 1.1.3. Close Box Incubator
- 1.1.4. Double Walled Incubator
- 1.2. Microbiological Incubators
- 1.3. Other Product Types
-
1.1. Neonatal Incubators
-
2. End User
- 2.1. Hospitals and Birthing Centers
- 2.2. Diagnostic Labs
- 2.3. Other End Users
Incubator Devices Industry Segmentation By Geography
-
1. North America
- 1.1. United States
- 1.2. Canada
- 1.3. Mexico
-
2. Europe
- 2.1. Germany
- 2.2. United Kingdom
- 2.3. France
- 2.4. Italy
- 2.5. Spain
- 2.6. Rest of Europe
-
3. Asia Pacific
- 3.1. China
- 3.2. Japan
- 3.3. India
- 3.4. Australia
- 3.5. South Korea
- 3.6. Rest of Asia Pacific
-
4. Middle East and Africa
- 4.1. GCC
- 4.2. South Africa
- 4.3. Rest of Middle East and Africa
-
5. South America
- 5.1. Brazil
- 5.2. Argentina
- 5.3. Rest of South America
Incubator Devices Industry REPORT HIGHLIGHTS
| Aspects | Details |
|---|---|
| Study Period | 2019-2033 |
| Base Year | 2024 |
| Estimated Year | 2025 |
| Forecast Period | 2025-2033 |
| Historical Period | 2019-2024 |
| Growth Rate | CAGR of 6.90% from 2019-2033 |
| Segmentation |
|
Table of Contents
- 1. Introduction
- 1.1. Research Scope
- 1.2. Market Segmentation
- 1.3. Research Methodology
- 1.4. Definitions and Assumptions
- 2. Executive Summary
- 2.1. Introduction
- 3. Market Dynamics
- 3.1. Introduction
- 3.2. Market Drivers
- 3.2.1. Rising Prevalence of Premature Babies; Low Birth Weight of Babies; Growing R&D in Healthcare
- 3.3. Market Restrains
- 3.3.1. High Cost of Incubators; Lack of Awareness in Emerging Economies
- 3.4. Market Trends
- 3.4.1. The Hospitals and Birthing Centers Segment is Expected to Witness a Healthy Growth Over the Forecast Period
- 4. Market Factor Analysis
- 4.1. Porters Five Forces
- 4.2. Supply/Value Chain
- 4.3. PESTEL analysis
- 4.4. Market Entropy
- 4.5. Patent/Trademark Analysis
- 5. Global Incubator Devices Industry Analysis, Insights and Forecast, 2019-2031
- 5.1. Market Analysis, Insights and Forecast - by Product Type
- 5.1.1. Neonatal Incubators
- 5.1.1.1. Portable or Transport Incubator
- 5.1.1.2. Open Box Incubator
- 5.1.1.3. Close Box Incubator
- 5.1.1.4. Double Walled Incubator
- 5.1.2. Microbiological Incubators
- 5.1.3. Other Product Types
- 5.1.1. Neonatal Incubators
- 5.2. Market Analysis, Insights and Forecast - by End User
- 5.2.1. Hospitals and Birthing Centers
- 5.2.2. Diagnostic Labs
- 5.2.3. Other End Users
- 5.3. Market Analysis, Insights and Forecast - by Region
- 5.3.1. North America
- 5.3.2. Europe
- 5.3.3. Asia Pacific
- 5.3.4. Middle East and Africa
- 5.3.5. South America
- 5.1. Market Analysis, Insights and Forecast - by Product Type
- 6. North America Incubator Devices Industry Analysis, Insights and Forecast, 2019-2031
- 6.1. Market Analysis, Insights and Forecast - by Product Type
- 6.1.1. Neonatal Incubators
- 6.1.1.1. Portable or Transport Incubator
- 6.1.1.2. Open Box Incubator
- 6.1.1.3. Close Box Incubator
- 6.1.1.4. Double Walled Incubator
- 6.1.2. Microbiological Incubators
- 6.1.3. Other Product Types
- 6.1.1. Neonatal Incubators
- 6.2. Market Analysis, Insights and Forecast - by End User
- 6.2.1. Hospitals and Birthing Centers
- 6.2.2. Diagnostic Labs
- 6.2.3. Other End Users
- 6.1. Market Analysis, Insights and Forecast - by Product Type
- 7. Europe Incubator Devices Industry Analysis, Insights and Forecast, 2019-2031
- 7.1. Market Analysis, Insights and Forecast - by Product Type
- 7.1.1. Neonatal Incubators
- 7.1.1.1. Portable or Transport Incubator
- 7.1.1.2. Open Box Incubator
- 7.1.1.3. Close Box Incubator
- 7.1.1.4. Double Walled Incubator
- 7.1.2. Microbiological Incubators
- 7.1.3. Other Product Types
- 7.1.1. Neonatal Incubators
- 7.2. Market Analysis, Insights and Forecast - by End User
- 7.2.1. Hospitals and Birthing Centers
- 7.2.2. Diagnostic Labs
- 7.2.3. Other End Users
- 7.1. Market Analysis, Insights and Forecast - by Product Type
- 8. Asia Pacific Incubator Devices Industry Analysis, Insights and Forecast, 2019-2031
- 8.1. Market Analysis, Insights and Forecast - by Product Type
- 8.1.1. Neonatal Incubators
- 8.1.1.1. Portable or Transport Incubator
- 8.1.1.2. Open Box Incubator
- 8.1.1.3. Close Box Incubator
- 8.1.1.4. Double Walled Incubator
- 8.1.2. Microbiological Incubators
- 8.1.3. Other Product Types
- 8.1.1. Neonatal Incubators
- 8.2. Market Analysis, Insights and Forecast - by End User
- 8.2.1. Hospitals and Birthing Centers
- 8.2.2. Diagnostic Labs
- 8.2.3. Other End Users
- 8.1. Market Analysis, Insights and Forecast - by Product Type
- 9. Middle East and Africa Incubator Devices Industry Analysis, Insights and Forecast, 2019-2031
- 9.1. Market Analysis, Insights and Forecast - by Product Type
- 9.1.1. Neonatal Incubators
- 9.1.1.1. Portable or Transport Incubator
- 9.1.1.2. Open Box Incubator
- 9.1.1.3. Close Box Incubator
- 9.1.1.4. Double Walled Incubator
- 9.1.2. Microbiological Incubators
- 9.1.3. Other Product Types
- 9.1.1. Neonatal Incubators
- 9.2. Market Analysis, Insights and Forecast - by End User
- 9.2.1. Hospitals and Birthing Centers
- 9.2.2. Diagnostic Labs
- 9.2.3. Other End Users
- 9.1. Market Analysis, Insights and Forecast - by Product Type
- 10. South America Incubator Devices Industry Analysis, Insights and Forecast, 2019-2031
- 10.1. Market Analysis, Insights and Forecast - by Product Type
- 10.1.1. Neonatal Incubators
- 10.1.1.1. Portable or Transport Incubator
- 10.1.1.2. Open Box Incubator
- 10.1.1.3. Close Box Incubator
- 10.1.1.4. Double Walled Incubator
- 10.1.2. Microbiological Incubators
- 10.1.3. Other Product Types
- 10.1.1. Neonatal Incubators
- 10.2. Market Analysis, Insights and Forecast - by End User
- 10.2.1. Hospitals and Birthing Centers
- 10.2.2. Diagnostic Labs
- 10.2.3. Other End Users
- 10.1. Market Analysis, Insights and Forecast - by Product Type
- 11. North America Incubator Devices Industry Analysis, Insights and Forecast, 2019-2031
- 11.1. Market Analysis, Insights and Forecast - By Country/Sub-region
- 11.1.1 United States
- 11.1.2 Canada
- 11.1.3 Mexico
- 12. Europe Incubator Devices Industry Analysis, Insights and Forecast, 2019-2031
- 12.1. Market Analysis, Insights and Forecast - By Country/Sub-region
- 12.1.1 Germany
- 12.1.2 United Kingdom
- 12.1.3 France
- 12.1.4 Italy
- 12.1.5 Spain
- 12.1.6 Rest of Europe
- 13. Asia Pacific Incubator Devices Industry Analysis, Insights and Forecast, 2019-2031
- 13.1. Market Analysis, Insights and Forecast - By Country/Sub-region
- 13.1.1 China
- 13.1.2 Japan
- 13.1.3 India
- 13.1.4 Australia
- 13.1.5 South Korea
- 13.1.6 Rest of Asia Pacific
- 14. Middle East and Africa Incubator Devices Industry Analysis, Insights and Forecast, 2019-2031
- 14.1. Market Analysis, Insights and Forecast - By Country/Sub-region
- 14.1.1 GCC
- 14.1.2 South Africa
- 14.1.3 Rest of Middle East and Africa
- 15. South America Incubator Devices Industry Analysis, Insights and Forecast, 2019-2031
- 15.1. Market Analysis, Insights and Forecast - By Country/Sub-region
- 15.1.1 Brazil
- 15.1.2 Argentina
- 15.1.3 Rest of South America
- 16. Competitive Analysis
- 16.1. Global Market Share Analysis 2024
- 16.2. Company Profiles
- 16.2.1 Phoenix Medical Systems (P) Ltd
- 16.2.1.1. Overview
- 16.2.1.2. Products
- 16.2.1.3. SWOT Analysis
- 16.2.1.4. Recent Developments
- 16.2.1.5. Financials (Based on Availability)
- 16.2.2 BMT Medical Technology sro
- 16.2.2.1. Overview
- 16.2.2.2. Products
- 16.2.2.3. SWOT Analysis
- 16.2.2.4. Recent Developments
- 16.2.2.5. Financials (Based on Availability)
- 16.2.3 Ningbo David Medical Device Co Ltd
- 16.2.3.1. Overview
- 16.2.3.2. Products
- 16.2.3.3. SWOT Analysis
- 16.2.3.4. Recent Developments
- 16.2.3.5. Financials (Based on Availability)
- 16.2.4 GE Healthcare
- 16.2.4.1. Overview
- 16.2.4.2. Products
- 16.2.4.3. SWOT Analysis
- 16.2.4.4. Recent Developments
- 16.2.4.5. Financials (Based on Availability)
- 16.2.5 Atom Medical Corporation
- 16.2.5.1. Overview
- 16.2.5.2. Products
- 16.2.5.3. SWOT Analysis
- 16.2.5.4. Recent Developments
- 16.2.5.5. Financials (Based on Availability)
- 16.2.6 Thermo Fisher Scientific Inc
- 16.2.6.1. Overview
- 16.2.6.2. Products
- 16.2.6.3. SWOT Analysis
- 16.2.6.4. Recent Developments
- 16.2.6.5. Financials (Based on Availability)
- 16.2.7 Andreas Hettich GmbH & Co KG
- 16.2.7.1. Overview
- 16.2.7.2. Products
- 16.2.7.3. SWOT Analysis
- 16.2.7.4. Recent Developments
- 16.2.7.5. Financials (Based on Availability)
- 16.2.8 Zhengzhou Dison Instrument and Meter Co Ltd
- 16.2.8.1. Overview
- 16.2.8.2. Products
- 16.2.8.3. SWOT Analysis
- 16.2.8.4. Recent Developments
- 16.2.8.5. Financials (Based on Availability)
- 16.2.9 Medhold Medical (PTY) Ltd
- 16.2.9.1. Overview
- 16.2.9.2. Products
- 16.2.9.3. SWOT Analysis
- 16.2.9.4. Recent Developments
- 16.2.9.5. Financials (Based on Availability)
- 16.2.10 Dragerwerk AG & Co KGaA
- 16.2.10.1. Overview
- 16.2.10.2. Products
- 16.2.10.3. SWOT Analysis
- 16.2.10.4. Recent Developments
- 16.2.10.5. Financials (Based on Availability)
- 16.2.11 Archimed (Natus Medical Incorporated)
- 16.2.11.1. Overview
- 16.2.11.2. Products
- 16.2.11.3. SWOT Analysis
- 16.2.11.4. Recent Developments
- 16.2.11.5. Financials (Based on Availability)
- 16.2.12 PHC Corporation
- 16.2.12.1. Overview
- 16.2.12.2. Products
- 16.2.12.3. SWOT Analysis
- 16.2.12.4. Recent Developments
- 16.2.12.5. Financials (Based on Availability)
- 16.2.1 Phoenix Medical Systems (P) Ltd
List of Figures
- Figure 1: Global Incubator Devices Industry Revenue Breakdown (Million, %) by Region 2024 & 2032
- Figure 2: Global Incubator Devices Industry Volume Breakdown (K Unit, %) by Region 2024 & 2032
- Figure 3: North America Incubator Devices Industry Revenue (Million), by Country 2024 & 2032
- Figure 4: North America Incubator Devices Industry Volume (K Unit), by Country 2024 & 2032
- Figure 5: North America Incubator Devices Industry Revenue Share (%), by Country 2024 & 2032
- Figure 6: North America Incubator Devices Industry Volume Share (%), by Country 2024 & 2032
- Figure 7: Europe Incubator Devices Industry Revenue (Million), by Country 2024 & 2032
- Figure 8: Europe Incubator Devices Industry Volume (K Unit), by Country 2024 & 2032
- Figure 9: Europe Incubator Devices Industry Revenue Share (%), by Country 2024 & 2032
- Figure 10: Europe Incubator Devices Industry Volume Share (%), by Country 2024 & 2032
- Figure 11: Asia Pacific Incubator Devices Industry Revenue (Million), by Country 2024 & 2032
- Figure 12: Asia Pacific Incubator Devices Industry Volume (K Unit), by Country 2024 & 2032
- Figure 13: Asia Pacific Incubator Devices Industry Revenue Share (%), by Country 2024 & 2032
- Figure 14: Asia Pacific Incubator Devices Industry Volume Share (%), by Country 2024 & 2032
- Figure 15: Middle East and Africa Incubator Devices Industry Revenue (Million), by Country 2024 & 2032
- Figure 16: Middle East and Africa Incubator Devices Industry Volume (K Unit), by Country 2024 & 2032
- Figure 17: Middle East and Africa Incubator Devices Industry Revenue Share (%), by Country 2024 & 2032
- Figure 18: Middle East and Africa Incubator Devices Industry Volume Share (%), by Country 2024 & 2032
- Figure 19: South America Incubator Devices Industry Revenue (Million), by Country 2024 & 2032
- Figure 20: South America Incubator Devices Industry Volume (K Unit), by Country 2024 & 2032
- Figure 21: South America Incubator Devices Industry Revenue Share (%), by Country 2024 & 2032
- Figure 22: South America Incubator Devices Industry Volume Share (%), by Country 2024 & 2032
- Figure 23: North America Incubator Devices Industry Revenue (Million), by Product Type 2024 & 2032
- Figure 24: North America Incubator Devices Industry Volume (K Unit), by Product Type 2024 & 2032
- Figure 25: North America Incubator Devices Industry Revenue Share (%), by Product Type 2024 & 2032
- Figure 26: North America Incubator Devices Industry Volume Share (%), by Product Type 2024 & 2032
- Figure 27: North America Incubator Devices Industry Revenue (Million), by End User 2024 & 2032
- Figure 28: North America Incubator Devices Industry Volume (K Unit), by End User 2024 & 2032
- Figure 29: North America Incubator Devices Industry Revenue Share (%), by End User 2024 & 2032
- Figure 30: North America Incubator Devices Industry Volume Share (%), by End User 2024 & 2032
- Figure 31: North America Incubator Devices Industry Revenue (Million), by Country 2024 & 2032
- Figure 32: North America Incubator Devices Industry Volume (K Unit), by Country 2024 & 2032
- Figure 33: North America Incubator Devices Industry Revenue Share (%), by Country 2024 & 2032
- Figure 34: North America Incubator Devices Industry Volume Share (%), by Country 2024 & 2032
- Figure 35: Europe Incubator Devices Industry Revenue (Million), by Product Type 2024 & 2032
- Figure 36: Europe Incubator Devices Industry Volume (K Unit), by Product Type 2024 & 2032
- Figure 37: Europe Incubator Devices Industry Revenue Share (%), by Product Type 2024 & 2032
- Figure 38: Europe Incubator Devices Industry Volume Share (%), by Product Type 2024 & 2032
- Figure 39: Europe Incubator Devices Industry Revenue (Million), by End User 2024 & 2032
- Figure 40: Europe Incubator Devices Industry Volume (K Unit), by End User 2024 & 2032
- Figure 41: Europe Incubator Devices Industry Revenue Share (%), by End User 2024 & 2032
- Figure 42: Europe Incubator Devices Industry Volume Share (%), by End User 2024 & 2032
- Figure 43: Europe Incubator Devices Industry Revenue (Million), by Country 2024 & 2032
- Figure 44: Europe Incubator Devices Industry Volume (K Unit), by Country 2024 & 2032
- Figure 45: Europe Incubator Devices Industry Revenue Share (%), by Country 2024 & 2032
- Figure 46: Europe Incubator Devices Industry Volume Share (%), by Country 2024 & 2032
- Figure 47: Asia Pacific Incubator Devices Industry Revenue (Million), by Product Type 2024 & 2032
- Figure 48: Asia Pacific Incubator Devices Industry Volume (K Unit), by Product Type 2024 & 2032
- Figure 49: Asia Pacific Incubator Devices Industry Revenue Share (%), by Product Type 2024 & 2032
- Figure 50: Asia Pacific Incubator Devices Industry Volume Share (%), by Product Type 2024 & 2032
- Figure 51: Asia Pacific Incubator Devices Industry Revenue (Million), by End User 2024 & 2032
- Figure 52: Asia Pacific Incubator Devices Industry Volume (K Unit), by End User 2024 & 2032
- Figure 53: Asia Pacific Incubator Devices Industry Revenue Share (%), by End User 2024 & 2032
- Figure 54: Asia Pacific Incubator Devices Industry Volume Share (%), by End User 2024 & 2032
- Figure 55: Asia Pacific Incubator Devices Industry Revenue (Million), by Country 2024 & 2032
- Figure 56: Asia Pacific Incubator Devices Industry Volume (K Unit), by Country 2024 & 2032
- Figure 57: Asia Pacific Incubator Devices Industry Revenue Share (%), by Country 2024 & 2032
- Figure 58: Asia Pacific Incubator Devices Industry Volume Share (%), by Country 2024 & 2032
- Figure 59: Middle East and Africa Incubator Devices Industry Revenue (Million), by Product Type 2024 & 2032
- Figure 60: Middle East and Africa Incubator Devices Industry Volume (K Unit), by Product Type 2024 & 2032
- Figure 61: Middle East and Africa Incubator Devices Industry Revenue Share (%), by Product Type 2024 & 2032
- Figure 62: Middle East and Africa Incubator Devices Industry Volume Share (%), by Product Type 2024 & 2032
- Figure 63: Middle East and Africa Incubator Devices Industry Revenue (Million), by End User 2024 & 2032
- Figure 64: Middle East and Africa Incubator Devices Industry Volume (K Unit), by End User 2024 & 2032
- Figure 65: Middle East and Africa Incubator Devices Industry Revenue Share (%), by End User 2024 & 2032
- Figure 66: Middle East and Africa Incubator Devices Industry Volume Share (%), by End User 2024 & 2032
- Figure 67: Middle East and Africa Incubator Devices Industry Revenue (Million), by Country 2024 & 2032
- Figure 68: Middle East and Africa Incubator Devices Industry Volume (K Unit), by Country 2024 & 2032
- Figure 69: Middle East and Africa Incubator Devices Industry Revenue Share (%), by Country 2024 & 2032
- Figure 70: Middle East and Africa Incubator Devices Industry Volume Share (%), by Country 2024 & 2032
- Figure 71: South America Incubator Devices Industry Revenue (Million), by Product Type 2024 & 2032
- Figure 72: South America Incubator Devices Industry Volume (K Unit), by Product Type 2024 & 2032
- Figure 73: South America Incubator Devices Industry Revenue Share (%), by Product Type 2024 & 2032
- Figure 74: South America Incubator Devices Industry Volume Share (%), by Product Type 2024 & 2032
- Figure 75: South America Incubator Devices Industry Revenue (Million), by End User 2024 & 2032
- Figure 76: South America Incubator Devices Industry Volume (K Unit), by End User 2024 & 2032
- Figure 77: South America Incubator Devices Industry Revenue Share (%), by End User 2024 & 2032
- Figure 78: South America Incubator Devices Industry Volume Share (%), by End User 2024 & 2032
- Figure 79: South America Incubator Devices Industry Revenue (Million), by Country 2024 & 2032
- Figure 80: South America Incubator Devices Industry Volume (K Unit), by Country 2024 & 2032
- Figure 81: South America Incubator Devices Industry Revenue Share (%), by Country 2024 & 2032
- Figure 82: South America Incubator Devices Industry Volume Share (%), by Country 2024 & 2032
List of Tables
- Table 1: Global Incubator Devices Industry Revenue Million Forecast, by Region 2019 & 2032
- Table 2: Global Incubator Devices Industry Volume K Unit Forecast, by Region 2019 & 2032
- Table 3: Global Incubator Devices Industry Revenue Million Forecast, by Product Type 2019 & 2032
- Table 4: Global Incubator Devices Industry Volume K Unit Forecast, by Product Type 2019 & 2032
- Table 5: Global Incubator Devices Industry Revenue Million Forecast, by End User 2019 & 2032
- Table 6: Global Incubator Devices Industry Volume K Unit Forecast, by End User 2019 & 2032
- Table 7: Global Incubator Devices Industry Revenue Million Forecast, by Region 2019 & 2032
- Table 8: Global Incubator Devices Industry Volume K Unit Forecast, by Region 2019 & 2032
- Table 9: Global Incubator Devices Industry Revenue Million Forecast, by Country 2019 & 2032
- Table 10: Global Incubator Devices Industry Volume K Unit Forecast, by Country 2019 & 2032
- Table 11: United States Incubator Devices Industry Revenue (Million) Forecast, by Application 2019 & 2032
- Table 12: United States Incubator Devices Industry Volume (K Unit) Forecast, by Application 2019 & 2032
- Table 13: Canada Incubator Devices Industry Revenue (Million) Forecast, by Application 2019 & 2032
- Table 14: Canada Incubator Devices Industry Volume (K Unit) Forecast, by Application 2019 & 2032
- Table 15: Mexico Incubator Devices Industry Revenue (Million) Forecast, by Application 2019 & 2032
- Table 16: Mexico Incubator Devices Industry Volume (K Unit) Forecast, by Application 2019 & 2032
- Table 17: Global Incubator Devices Industry Revenue Million Forecast, by Country 2019 & 2032
- Table 18: Global Incubator Devices Industry Volume K Unit Forecast, by Country 2019 & 2032
- Table 19: Germany Incubator Devices Industry Revenue (Million) Forecast, by Application 2019 & 2032
- Table 20: Germany Incubator Devices Industry Volume (K Unit) Forecast, by Application 2019 & 2032
- Table 21: United Kingdom Incubator Devices Industry Revenue (Million) Forecast, by Application 2019 & 2032
- Table 22: United Kingdom Incubator Devices Industry Volume (K Unit) Forecast, by Application 2019 & 2032
- Table 23: France Incubator Devices Industry Revenue (Million) Forecast, by Application 2019 & 2032
- Table 24: France Incubator Devices Industry Volume (K Unit) Forecast, by Application 2019 & 2032
- Table 25: Italy Incubator Devices Industry Revenue (Million) Forecast, by Application 2019 & 2032
- Table 26: Italy Incubator Devices Industry Volume (K Unit) Forecast, by Application 2019 & 2032
- Table 27: Spain Incubator Devices Industry Revenue (Million) Forecast, by Application 2019 & 2032
- Table 28: Spain Incubator Devices Industry Volume (K Unit) Forecast, by Application 2019 & 2032
- Table 29: Rest of Europe Incubator Devices Industry Revenue (Million) Forecast, by Application 2019 & 2032
- Table 30: Rest of Europe Incubator Devices Industry Volume (K Unit) Forecast, by Application 2019 & 2032
- Table 31: Global Incubator Devices Industry Revenue Million Forecast, by Country 2019 & 2032
- Table 32: Global Incubator Devices Industry Volume K Unit Forecast, by Country 2019 & 2032
- Table 33: China Incubator Devices Industry Revenue (Million) Forecast, by Application 2019 & 2032
- Table 34: China Incubator Devices Industry Volume (K Unit) Forecast, by Application 2019 & 2032
- Table 35: Japan Incubator Devices Industry Revenue (Million) Forecast, by Application 2019 & 2032
- Table 36: Japan Incubator Devices Industry Volume (K Unit) Forecast, by Application 2019 & 2032
- Table 37: India Incubator Devices Industry Revenue (Million) Forecast, by Application 2019 & 2032
- Table 38: India Incubator Devices Industry Volume (K Unit) Forecast, by Application 2019 & 2032
- Table 39: Australia Incubator Devices Industry Revenue (Million) Forecast, by Application 2019 & 2032
- Table 40: Australia Incubator Devices Industry Volume (K Unit) Forecast, by Application 2019 & 2032
- Table 41: South Korea Incubator Devices Industry Revenue (Million) Forecast, by Application 2019 & 2032
- Table 42: South Korea Incubator Devices Industry Volume (K Unit) Forecast, by Application 2019 & 2032
- Table 43: Rest of Asia Pacific Incubator Devices Industry Revenue (Million) Forecast, by Application 2019 & 2032
- Table 44: Rest of Asia Pacific Incubator Devices Industry Volume (K Unit) Forecast, by Application 2019 & 2032
- Table 45: Global Incubator Devices Industry Revenue Million Forecast, by Country 2019 & 2032
- Table 46: Global Incubator Devices Industry Volume K Unit Forecast, by Country 2019 & 2032
- Table 47: GCC Incubator Devices Industry Revenue (Million) Forecast, by Application 2019 & 2032
- Table 48: GCC Incubator Devices Industry Volume (K Unit) Forecast, by Application 2019 & 2032
- Table 49: South Africa Incubator Devices Industry Revenue (Million) Forecast, by Application 2019 & 2032
- Table 50: South Africa Incubator Devices Industry Volume (K Unit) Forecast, by Application 2019 & 2032
- Table 51: Rest of Middle East and Africa Incubator Devices Industry Revenue (Million) Forecast, by Application 2019 & 2032
- Table 52: Rest of Middle East and Africa Incubator Devices Industry Volume (K Unit) Forecast, by Application 2019 & 2032
- Table 53: Global Incubator Devices Industry Revenue Million Forecast, by Country 2019 & 2032
- Table 54: Global Incubator Devices Industry Volume K Unit Forecast, by Country 2019 & 2032
- Table 55: Brazil Incubator Devices Industry Revenue (Million) Forecast, by Application 2019 & 2032
- Table 56: Brazil Incubator Devices Industry Volume (K Unit) Forecast, by Application 2019 & 2032
- Table 57: Argentina Incubator Devices Industry Revenue (Million) Forecast, by Application 2019 & 2032
- Table 58: Argentina Incubator Devices Industry Volume (K Unit) Forecast, by Application 2019 & 2032
- Table 59: Rest of South America Incubator Devices Industry Revenue (Million) Forecast, by Application 2019 & 2032
- Table 60: Rest of South America Incubator Devices Industry Volume (K Unit) Forecast, by Application 2019 & 2032
- Table 61: Global Incubator Devices Industry Revenue Million Forecast, by Product Type 2019 & 2032
- Table 62: Global Incubator Devices Industry Volume K Unit Forecast, by Product Type 2019 & 2032
- Table 63: Global Incubator Devices Industry Revenue Million Forecast, by End User 2019 & 2032
- Table 64: Global Incubator Devices Industry Volume K Unit Forecast, by End User 2019 & 2032
- Table 65: Global Incubator Devices Industry Revenue Million Forecast, by Country 2019 & 2032
- Table 66: Global Incubator Devices Industry Volume K Unit Forecast, by Country 2019 & 2032
- Table 67: United States Incubator Devices Industry Revenue (Million) Forecast, by Application 2019 & 2032
- Table 68: United States Incubator Devices Industry Volume (K Unit) Forecast, by Application 2019 & 2032
- Table 69: Canada Incubator Devices Industry Revenue (Million) Forecast, by Application 2019 & 2032
- Table 70: Canada Incubator Devices Industry Volume (K Unit) Forecast, by Application 2019 & 2032
- Table 71: Mexico Incubator Devices Industry Revenue (Million) Forecast, by Application 2019 & 2032
- Table 72: Mexico Incubator Devices Industry Volume (K Unit) Forecast, by Application 2019 & 2032
- Table 73: Global Incubator Devices Industry Revenue Million Forecast, by Product Type 2019 & 2032
- Table 74: Global Incubator Devices Industry Volume K Unit Forecast, by Product Type 2019 & 2032
- Table 75: Global Incubator Devices Industry Revenue Million Forecast, by End User 2019 & 2032
- Table 76: Global Incubator Devices Industry Volume K Unit Forecast, by End User 2019 & 2032
- Table 77: Global Incubator Devices Industry Revenue Million Forecast, by Country 2019 & 2032
- Table 78: Global Incubator Devices Industry Volume K Unit Forecast, by Country 2019 & 2032
- Table 79: Germany Incubator Devices Industry Revenue (Million) Forecast, by Application 2019 & 2032
- Table 80: Germany Incubator Devices Industry Volume (K Unit) Forecast, by Application 2019 & 2032
- Table 81: United Kingdom Incubator Devices Industry Revenue (Million) Forecast, by Application 2019 & 2032
- Table 82: United Kingdom Incubator Devices Industry Volume (K Unit) Forecast, by Application 2019 & 2032
- Table 83: France Incubator Devices Industry Revenue (Million) Forecast, by Application 2019 & 2032
- Table 84: France Incubator Devices Industry Volume (K Unit) Forecast, by Application 2019 & 2032
- Table 85: Italy Incubator Devices Industry Revenue (Million) Forecast, by Application 2019 & 2032
- Table 86: Italy Incubator Devices Industry Volume (K Unit) Forecast, by Application 2019 & 2032
- Table 87: Spain Incubator Devices Industry Revenue (Million) Forecast, by Application 2019 & 2032
- Table 88: Spain Incubator Devices Industry Volume (K Unit) Forecast, by Application 2019 & 2032
- Table 89: Rest of Europe Incubator Devices Industry Revenue (Million) Forecast, by Application 2019 & 2032
- Table 90: Rest of Europe Incubator Devices Industry Volume (K Unit) Forecast, by Application 2019 & 2032
- Table 91: Global Incubator Devices Industry Revenue Million Forecast, by Product Type 2019 & 2032
- Table 92: Global Incubator Devices Industry Volume K Unit Forecast, by Product Type 2019 & 2032
- Table 93: Global Incubator Devices Industry Revenue Million Forecast, by End User 2019 & 2032
- Table 94: Global Incubator Devices Industry Volume K Unit Forecast, by End User 2019 & 2032
- Table 95: Global Incubator Devices Industry Revenue Million Forecast, by Country 2019 & 2032
- Table 96: Global Incubator Devices Industry Volume K Unit Forecast, by Country 2019 & 2032
- Table 97: China Incubator Devices Industry Revenue (Million) Forecast, by Application 2019 & 2032
- Table 98: China Incubator Devices Industry Volume (K Unit) Forecast, by Application 2019 & 2032
- Table 99: Japan Incubator Devices Industry Revenue (Million) Forecast, by Application 2019 & 2032
- Table 100: Japan Incubator Devices Industry Volume (K Unit) Forecast, by Application 2019 & 2032
- Table 101: India Incubator Devices Industry Revenue (Million) Forecast, by Application 2019 & 2032
- Table 102: India Incubator Devices Industry Volume (K Unit) Forecast, by Application 2019 & 2032
- Table 103: Australia Incubator Devices Industry Revenue (Million) Forecast, by Application 2019 & 2032
- Table 104: Australia Incubator Devices Industry Volume (K Unit) Forecast, by Application 2019 & 2032
- Table 105: South Korea Incubator Devices Industry Revenue (Million) Forecast, by Application 2019 & 2032
- Table 106: South Korea Incubator Devices Industry Volume (K Unit) Forecast, by Application 2019 & 2032
- Table 107: Rest of Asia Pacific Incubator Devices Industry Revenue (Million) Forecast, by Application 2019 & 2032
- Table 108: Rest of Asia Pacific Incubator Devices Industry Volume (K Unit) Forecast, by Application 2019 & 2032
- Table 109: Global Incubator Devices Industry Revenue Million Forecast, by Product Type 2019 & 2032
- Table 110: Global Incubator Devices Industry Volume K Unit Forecast, by Product Type 2019 & 2032
- Table 111: Global Incubator Devices Industry Revenue Million Forecast, by End User 2019 & 2032
- Table 112: Global Incubator Devices Industry Volume K Unit Forecast, by End User 2019 & 2032
- Table 113: Global Incubator Devices Industry Revenue Million Forecast, by Country 2019 & 2032
- Table 114: Global Incubator Devices Industry Volume K Unit Forecast, by Country 2019 & 2032
- Table 115: GCC Incubator Devices Industry Revenue (Million) Forecast, by Application 2019 & 2032
- Table 116: GCC Incubator Devices Industry Volume (K Unit) Forecast, by Application 2019 & 2032
- Table 117: South Africa Incubator Devices Industry Revenue (Million) Forecast, by Application 2019 & 2032
- Table 118: South Africa Incubator Devices Industry Volume (K Unit) Forecast, by Application 2019 & 2032
- Table 119: Rest of Middle East and Africa Incubator Devices Industry Revenue (Million) Forecast, by Application 2019 & 2032
- Table 120: Rest of Middle East and Africa Incubator Devices Industry Volume (K Unit) Forecast, by Application 2019 & 2032
- Table 121: Global Incubator Devices Industry Revenue Million Forecast, by Product Type 2019 & 2032
- Table 122: Global Incubator Devices Industry Volume K Unit Forecast, by Product Type 2019 & 2032
- Table 123: Global Incubator Devices Industry Revenue Million Forecast, by End User 2019 & 2032
- Table 124: Global Incubator Devices Industry Volume K Unit Forecast, by End User 2019 & 2032
- Table 125: Global Incubator Devices Industry Revenue Million Forecast, by Country 2019 & 2032
- Table 126: Global Incubator Devices Industry Volume K Unit Forecast, by Country 2019 & 2032
- Table 127: Brazil Incubator Devices Industry Revenue (Million) Forecast, by Application 2019 & 2032
- Table 128: Brazil Incubator Devices Industry Volume (K Unit) Forecast, by Application 2019 & 2032
- Table 129: Argentina Incubator Devices Industry Revenue (Million) Forecast, by Application 2019 & 2032
- Table 130: Argentina Incubator Devices Industry Volume (K Unit) Forecast, by Application 2019 & 2032
- Table 131: Rest of South America Incubator Devices Industry Revenue (Million) Forecast, by Application 2019 & 2032
- Table 132: Rest of South America Incubator Devices Industry Volume (K Unit) Forecast, by Application 2019 & 2032
Frequently Asked Questions
1. What is the projected Compound Annual Growth Rate (CAGR) of the Incubator Devices Industry?
The projected CAGR is approximately 6.90%.
2. Which companies are prominent players in the Incubator Devices Industry?
Key companies in the market include Phoenix Medical Systems (P) Ltd, BMT Medical Technology sro, Ningbo David Medical Device Co Ltd, GE Healthcare, Atom Medical Corporation, Thermo Fisher Scientific Inc, Andreas Hettich GmbH & Co KG, Zhengzhou Dison Instrument and Meter Co Ltd, Medhold Medical (PTY) Ltd, Dragerwerk AG & Co KGaA, Archimed (Natus Medical Incorporated), PHC Corporation.
3. What are the main segments of the Incubator Devices Industry?
The market segments include Product Type, End User.
4. Can you provide details about the market size?
The market size is estimated to be USD XX Million as of 2022.
5. What are some drivers contributing to market growth?
Rising Prevalence of Premature Babies; Low Birth Weight of Babies; Growing R&D in Healthcare.
6. What are the notable trends driving market growth?
The Hospitals and Birthing Centers Segment is Expected to Witness a Healthy Growth Over the Forecast Period.
7. Are there any restraints impacting market growth?
High Cost of Incubators; Lack of Awareness in Emerging Economies.
8. Can you provide examples of recent developments in the market?
October 2022: the University of Birmingham Enterprise, Greater Birmingham and Solihull Local Enterprise, and West mainlands Combined Authority launched Unit - 9, a medical technology incubator that facilitates medical research, proof of concept, and prototyping activity.
9. What pricing options are available for accessing the report?
Pricing options include single-user, multi-user, and enterprise licenses priced at USD 4750, USD 5250, and USD 8750 respectively.
10. Is the market size provided in terms of value or volume?
The market size is provided in terms of value, measured in Million and volume, measured in K Unit.
11. Are there any specific market keywords associated with the report?
Yes, the market keyword associated with the report is "Incubator Devices Industry," which aids in identifying and referencing the specific market segment covered.
12. How do I determine which pricing option suits my needs best?
The pricing options vary based on user requirements and access needs. Individual users may opt for single-user licenses, while businesses requiring broader access may choose multi-user or enterprise licenses for cost-effective access to the report.
13. Are there any additional resources or data provided in the Incubator Devices Industry report?
While the report offers comprehensive insights, it's advisable to review the specific contents or supplementary materials provided to ascertain if additional resources or data are available.
14. How can I stay updated on further developments or reports in the Incubator Devices Industry?
To stay informed about further developments, trends, and reports in the Incubator Devices Industry, consider subscribing to industry newsletters, following relevant companies and organizations, or regularly checking reputable industry news sources and publications.
Methodology
Step 1 - Identification of Relevant Samples Size from Population Database


Step 2 - Approaches for Defining Global Market Size (Value, Volume* & Price*)

Note*: In applicable scenarios
Step 3 - Data Sources
Primary Research
- Web Analytics
- Survey Reports
- Research Institute
- Latest Research Reports
- Opinion Leaders
Secondary Research
- Annual Reports
- White Paper
- Latest Press Release
- Industry Association
- Paid Database
- Investor Presentations

Step 4 - Data Triangulation
Involves using different sources of information in order to increase the validity of a study
These sources are likely to be stakeholders in a program - participants, other researchers, program staff, other community members, and so on.
Then we put all data in single framework & apply various statistical tools to find out the dynamic on the market.
During the analysis stage, feedback from the stakeholder groups would be compared to determine areas of agreement as well as areas of divergence
