

Key Insights
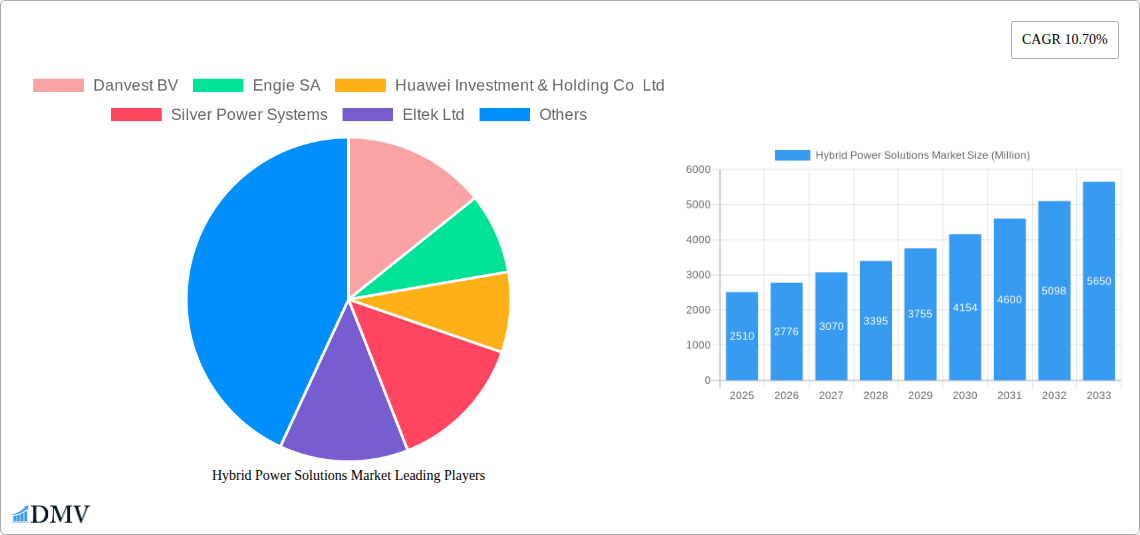
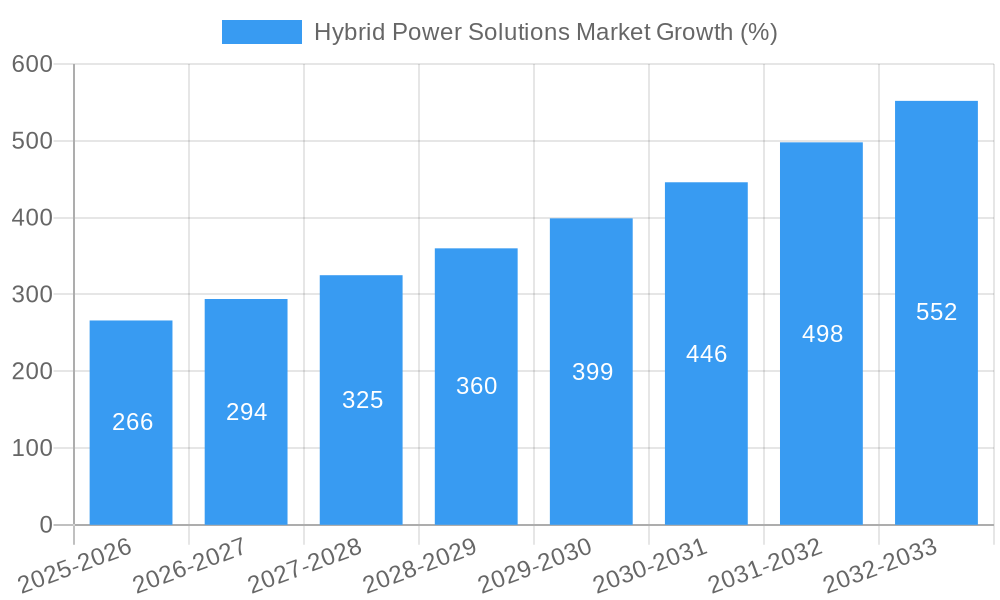
The Hybrid Power Solutions market is experiencing robust growth, projected to reach $2.51 billion in 2025 and exhibiting a Compound Annual Growth Rate (CAGR) of 10.70% from 2025 to 2033. This expansion is driven by increasing demand for reliable and sustainable energy sources, particularly in remote areas and regions with unreliable grid infrastructure. The rising adoption of renewable energy technologies, coupled with concerns about energy security and climate change, fuels market growth across diverse sectors. Commercial and industrial users are significant drivers, seeking resilient power solutions to maintain operations during grid failures. Residential adoption is also increasing, driven by off-grid living trends and the desire for energy independence. The market is segmented by configuration (Solar Plus Generator, Wind Plus Generator, Solar Plus Wind Plus Generator, Other Types) and end-user (Commercial and Industrial, Residential, Utility), offering various solutions tailored to specific needs. Technological advancements in battery storage, inverter technology, and renewable energy sources are further enhancing the efficiency and cost-effectiveness of hybrid power systems, promoting market penetration.
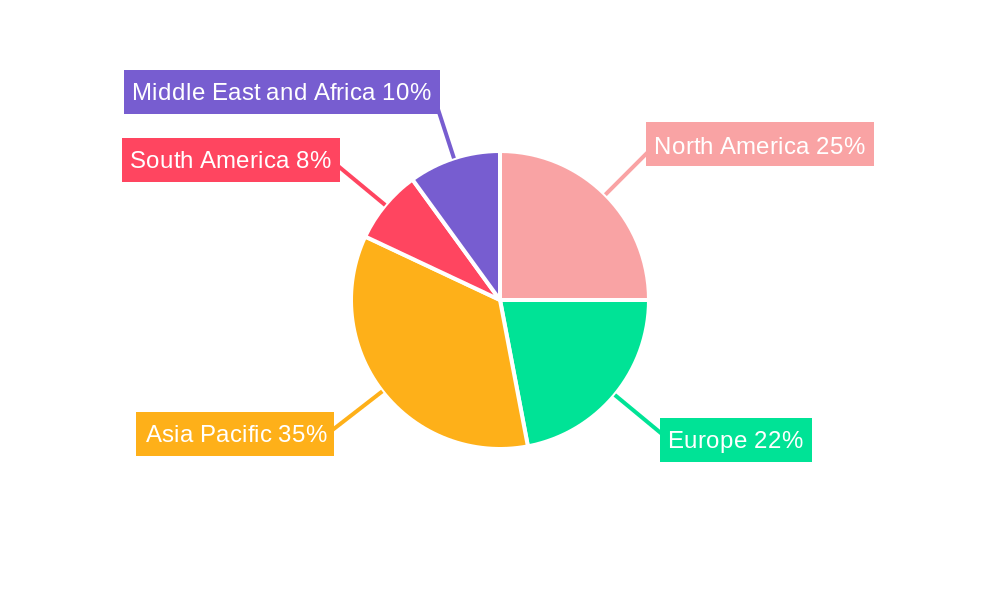
Growth is expected to be particularly strong in regions experiencing rapid economic development and increasing energy demands, such as Asia Pacific and Middle East & Africa. However, high initial investment costs and the complex nature of hybrid system integration present challenges. Nevertheless, government incentives, supportive regulations promoting renewable energy integration, and decreasing component costs are gradually mitigating these constraints. The competitive landscape is dynamic, with major players like Danvest BV, Engie SA, Huawei, and Siemens Gamesa actively innovating and expanding their market presence. The future of the hybrid power solutions market appears promising, characterized by continuous technological innovation, increasing adoption across various sectors, and sustained expansion into new geographical markets. This trend reflects a global shift toward decarbonization and energy resilience.
Hybrid Power Solutions Market: A Comprehensive Report (2019-2033)
This insightful report provides a comprehensive analysis of the Hybrid Power Solutions market, offering valuable insights for stakeholders seeking to understand market dynamics, future trends, and investment opportunities. With a study period spanning 2019-2033, a base year of 2025, and a forecast period of 2025-2033, this report leverages extensive data analysis to provide a clear picture of this rapidly evolving sector. The market is expected to reach xx Million by 2033, demonstrating significant growth potential.
Hybrid Power Solutions Market Composition & Trends
This section delves into the intricate composition of the Hybrid Power Solutions market, analyzing key aspects such as market concentration, innovation drivers, regulatory landscapes, and competitive activities. We examine the market share distribution among key players, revealing a moderately fragmented landscape with several significant players vying for dominance. The market share of the top 5 players is estimated to be approximately xx%, while smaller players constitute the remaining xx%. Innovation is driven by advancements in renewable energy technologies, coupled with increasing demand for energy independence and sustainability. Regulatory frameworks, including government incentives and emission reduction targets, play a pivotal role in shaping market growth. The rise of substitute products, such as battery storage solutions, presents both opportunities and challenges for hybrid power solution providers. Furthermore, we analyze mergers and acquisitions (M&A) activities, including deal values, to highlight strategic shifts and consolidation within the market. Significant M&A activity is expected, with an estimated xx Million in deal values projected for the forecast period.
- Market Concentration: Moderately fragmented, with top 5 players holding approximately xx% market share.
- Innovation Catalysts: Advancements in solar, wind, and battery technologies.
- Regulatory Landscape: Government incentives and emission reduction targets are key drivers.
- Substitute Products: Battery storage solutions pose both opportunities and threats.
- End-User Profiles: A diverse range including commercial, industrial, residential, and utility sectors.
- M&A Activities: Significant activity anticipated, with projected deal values reaching xx Million during 2025-2033.
Hybrid Power Solutions Market Industry Evolution
This section traces the evolution of the Hybrid Power Solutions market, examining growth trajectories, technological advancements, and evolving consumer preferences. The market has witnessed robust growth during the historical period (2019-2024), with a Compound Annual Growth Rate (CAGR) of xx%. This growth is propelled by the increasing adoption of renewable energy sources and the need for reliable and sustainable power solutions, especially in remote areas and developing economies. Technological advancements, such as improved energy storage systems and smart grid integration, are continuously enhancing the efficiency and affordability of hybrid power systems. Consumer demand is shifting towards more sustainable and cost-effective solutions, with a particular emphasis on reduced carbon footprint and long-term operational reliability. We project a continued growth trajectory for the forecast period (2025-2033), with a CAGR of xx%, driven by ongoing technological innovation and supportive government policies.
Leading Regions, Countries, or Segments in Hybrid Power Solutions Market
This section identifies the leading regions, countries, and segments within the Hybrid Power Solutions market. Analysis reveals that the [Dominant Region, e.g., North America] currently holds the largest market share, driven by robust government support for renewable energy initiatives and a high concentration of commercial and industrial end-users. [Dominant Country, e.g., the United States] is a key driver within this region. The "Solar Plus Generator" configuration segment currently dominates the market, owing to its relatively lower upfront cost and ease of implementation compared to other configurations.
- Key Drivers for Dominant Region/Country:
- Strong government support for renewable energy adoption.
- High concentration of commercial and industrial end-users.
- Favorable regulatory environment and investment incentives.
- Key Drivers for Dominant Segment (Solar Plus Generator):
- Lower initial investment costs compared to other configurations.
- Ease of deployment and integration.
- Wide availability of solar technology and components.
Hybrid Power Solutions Market Product Innovations
Recent years have witnessed significant product innovations in the Hybrid Power Solutions market, focusing on enhanced energy storage capacity, improved power management systems, and optimized energy efficiency. Advancements in battery technology, such as lithium-ion batteries, have significantly boosted the performance and lifespan of hybrid systems. Smart grid integration capabilities enable seamless interaction with existing power grids, enabling better power distribution and optimized energy consumption. These innovations have led to more efficient, reliable, and cost-effective hybrid power solutions, particularly suited for remote locations and off-grid applications. Unique selling propositions include improved energy storage, enhanced system reliability, and reduced maintenance requirements.
Propelling Factors for Hybrid Power Solutions Market Growth
Several factors are driving the growth of the Hybrid Power Solutions market. These include increasing concerns over climate change and the push for renewable energy adoption, coupled with government regulations and incentives designed to promote sustainable energy solutions. Furthermore, the declining cost of renewable energy technologies, including solar and wind power, is making hybrid systems more economically viable for a wider range of applications. The growing need for reliable power in remote locations and developing economies is also stimulating market growth.
Obstacles in the Hybrid Power Solutions Market
Despite the significant growth potential, the Hybrid Power Solutions market faces certain challenges. Regulatory uncertainties and inconsistent policies across different regions can hinder market expansion. Supply chain disruptions, particularly concerning critical components like batteries and inverters, can impact production and increase costs. Intense competition from established players and new entrants can put pressure on profit margins. These factors, although not insurmountable, pose considerable obstacles to market growth.
Future Opportunities in Hybrid Power Solutions Market
The Hybrid Power Solutions market is poised for significant growth in the coming years, with several promising opportunities on the horizon. The expansion of microgrids and off-grid power solutions presents a significant market opportunity, particularly in remote areas lacking access to conventional power grids. Further technological advancements in energy storage, power management, and grid integration will drive market innovation and enhance the efficiency and cost-effectiveness of hybrid systems. Emerging markets in developing economies represent a vast potential for market expansion.
Major Players in the Hybrid Power Solutions Market Ecosystem
- Danvest BV
- Engie SA
- Huawei Investment & Holding Co Ltd
- Silver Power Systems
- Eltek Ltd
- Siemens Gamesa Renewable Energy SA
- Vergnet SA
- General Electric Company
- SMA Solar Technology AG
Key Developments in Hybrid Power Solutions Market Industry
- February 2023: Prolectric Services Ltd launched the ProPower 3-Phase Solar Hybrid Power unit, a 60 kW system for remote locations, reducing carbon emissions and diesel use.
- September 2022: Shell acquired Daystar Power, expanding its hybrid power solutions offerings in West Africa, particularly for commercial and industrial clients.
Strategic Hybrid Power Solutions Market Forecast
The Hybrid Power Solutions market is projected to experience sustained growth over the forecast period, driven by the increasing adoption of renewable energy sources, technological advancements, and favorable government policies. The market's expansion into new geographic regions and application areas, coupled with ongoing product innovations, will further fuel this growth trajectory, creating substantial market potential for stakeholders.
Hybrid Power Solutions Market Segmentation
-
1. Configuration
- 1.1. Solar Plus Generator
- 1.2. Wind Plus Generator
- 1.3. Solar Plus Wind Plus Generator
- 1.4. Other Types
-
2. End-User
- 2.1. Commercial and Industrial
- 2.2. Residential
- 2.3. Utility
Hybrid Power Solutions Market Segmentation By Geography
-
1. North America
- 1.1. United States
- 1.2. Canada
- 1.3. Rest of North America
-
2. Europe
- 2.1. Germany
- 2.2. United Kingdom
- 2.3. Italy
- 2.4. France
- 2.5. Rest of Europe
-
3. Asia Pacific
- 3.1. China
- 3.2. India
- 3.3. Australia
- 3.4. Japan
- 3.5. South Korea
- 3.6. Rest of Asia Pacific
-
4. South America
- 4.1. Brazil
- 4.2. Argentina
- 4.3. Rest of South America
-
5. Middle East and Africa
- 5.1. Saudi Arabia
- 5.2. United Arab Emirates
- 5.3. Egypt
- 5.4. South Afrcia
- 5.5. Rest of Middle East and Africa
Hybrid Power Solutions Market REPORT HIGHLIGHTS
| Aspects | Details |
|---|---|
| Study Period | 2019-2033 |
| Base Year | 2024 |
| Estimated Year | 2025 |
| Forecast Period | 2025-2033 |
| Historical Period | 2019-2024 |
| Growth Rate | CAGR of 10.70% from 2019-2033 |
| Segmentation |
|
Table of Contents
- 1. Introduction
- 1.1. Research Scope
- 1.2. Market Segmentation
- 1.3. Research Methodology
- 1.4. Definitions and Assumptions
- 2. Executive Summary
- 2.1. Introduction
- 3. Market Dynamics
- 3.1. Introduction
- 3.2. Market Drivers
- 3.2.1. 4.; Growing Environmental Concerns4.; Supportive Government Policies
- 3.3. Market Restrains
- 3.3.1. 4.; High Initial Capital Investment
- 3.4. Market Trends
- 3.4.1. Solar Generator Hybrid Segment to Dominate the Market
- 4. Market Factor Analysis
- 4.1. Porters Five Forces
- 4.2. Supply/Value Chain
- 4.3. PESTEL analysis
- 4.4. Market Entropy
- 4.5. Patent/Trademark Analysis
- 5. Global Hybrid Power Solutions Market Analysis, Insights and Forecast, 2019-2031
- 5.1. Market Analysis, Insights and Forecast - by Configuration
- 5.1.1. Solar Plus Generator
- 5.1.2. Wind Plus Generator
- 5.1.3. Solar Plus Wind Plus Generator
- 5.1.4. Other Types
- 5.2. Market Analysis, Insights and Forecast - by End-User
- 5.2.1. Commercial and Industrial
- 5.2.2. Residential
- 5.2.3. Utility
- 5.3. Market Analysis, Insights and Forecast - by Region
- 5.3.1. North America
- 5.3.2. Europe
- 5.3.3. Asia Pacific
- 5.3.4. South America
- 5.3.5. Middle East and Africa
- 5.1. Market Analysis, Insights and Forecast - by Configuration
- 6. North America Hybrid Power Solutions Market Analysis, Insights and Forecast, 2019-2031
- 6.1. Market Analysis, Insights and Forecast - by Configuration
- 6.1.1. Solar Plus Generator
- 6.1.2. Wind Plus Generator
- 6.1.3. Solar Plus Wind Plus Generator
- 6.1.4. Other Types
- 6.2. Market Analysis, Insights and Forecast - by End-User
- 6.2.1. Commercial and Industrial
- 6.2.2. Residential
- 6.2.3. Utility
- 6.1. Market Analysis, Insights and Forecast - by Configuration
- 7. Europe Hybrid Power Solutions Market Analysis, Insights and Forecast, 2019-2031
- 7.1. Market Analysis, Insights and Forecast - by Configuration
- 7.1.1. Solar Plus Generator
- 7.1.2. Wind Plus Generator
- 7.1.3. Solar Plus Wind Plus Generator
- 7.1.4. Other Types
- 7.2. Market Analysis, Insights and Forecast - by End-User
- 7.2.1. Commercial and Industrial
- 7.2.2. Residential
- 7.2.3. Utility
- 7.1. Market Analysis, Insights and Forecast - by Configuration
- 8. Asia Pacific Hybrid Power Solutions Market Analysis, Insights and Forecast, 2019-2031
- 8.1. Market Analysis, Insights and Forecast - by Configuration
- 8.1.1. Solar Plus Generator
- 8.1.2. Wind Plus Generator
- 8.1.3. Solar Plus Wind Plus Generator
- 8.1.4. Other Types
- 8.2. Market Analysis, Insights and Forecast - by End-User
- 8.2.1. Commercial and Industrial
- 8.2.2. Residential
- 8.2.3. Utility
- 8.1. Market Analysis, Insights and Forecast - by Configuration
- 9. South America Hybrid Power Solutions Market Analysis, Insights and Forecast, 2019-2031
- 9.1. Market Analysis, Insights and Forecast - by Configuration
- 9.1.1. Solar Plus Generator
- 9.1.2. Wind Plus Generator
- 9.1.3. Solar Plus Wind Plus Generator
- 9.1.4. Other Types
- 9.2. Market Analysis, Insights and Forecast - by End-User
- 9.2.1. Commercial and Industrial
- 9.2.2. Residential
- 9.2.3. Utility
- 9.1. Market Analysis, Insights and Forecast - by Configuration
- 10. Middle East and Africa Hybrid Power Solutions Market Analysis, Insights and Forecast, 2019-2031
- 10.1. Market Analysis, Insights and Forecast - by Configuration
- 10.1.1. Solar Plus Generator
- 10.1.2. Wind Plus Generator
- 10.1.3. Solar Plus Wind Plus Generator
- 10.1.4. Other Types
- 10.2. Market Analysis, Insights and Forecast - by End-User
- 10.2.1. Commercial and Industrial
- 10.2.2. Residential
- 10.2.3. Utility
- 10.1. Market Analysis, Insights and Forecast - by Configuration
- 11. North America Hybrid Power Solutions Market Analysis, Insights and Forecast, 2019-2031
- 11.1. Market Analysis, Insights and Forecast - By Country/Sub-region
- 11.1.1 United States
- 11.1.2 Canada
- 11.1.3 Rest of North America
- 12. Europe Hybrid Power Solutions Market Analysis, Insights and Forecast, 2019-2031
- 12.1. Market Analysis, Insights and Forecast - By Country/Sub-region
- 12.1.1 Germany
- 12.1.2 United Kingdom
- 12.1.3 Italy
- 12.1.4 France
- 12.1.5 Rest of Europe
- 13. Asia Pacific Hybrid Power Solutions Market Analysis, Insights and Forecast, 2019-2031
- 13.1. Market Analysis, Insights and Forecast - By Country/Sub-region
- 13.1.1 China
- 13.1.2 India
- 13.1.3 Australia
- 13.1.4 Japan
- 13.1.5 South Korea
- 13.1.6 Rest of Asia Pacific
- 14. South America Hybrid Power Solutions Market Analysis, Insights and Forecast, 2019-2031
- 14.1. Market Analysis, Insights and Forecast - By Country/Sub-region
- 14.1.1 Brazil
- 14.1.2 Argentina
- 14.1.3 Rest of South America
- 15. Middle East and Africa Hybrid Power Solutions Market Analysis, Insights and Forecast, 2019-2031
- 15.1. Market Analysis, Insights and Forecast - By Country/Sub-region
- 15.1.1 Saudi Arabia
- 15.1.2 United Arab Emirates
- 15.1.3 Egypt
- 15.1.4 South Afrcia
- 15.1.5 Rest of Middle East and Africa
- 16. Competitive Analysis
- 16.1. Global Market Share Analysis 2024
- 16.2. Company Profiles
- 16.2.1 Danvest BV
- 16.2.1.1. Overview
- 16.2.1.2. Products
- 16.2.1.3. SWOT Analysis
- 16.2.1.4. Recent Developments
- 16.2.1.5. Financials (Based on Availability)
- 16.2.2 Engie SA
- 16.2.2.1. Overview
- 16.2.2.2. Products
- 16.2.2.3. SWOT Analysis
- 16.2.2.4. Recent Developments
- 16.2.2.5. Financials (Based on Availability)
- 16.2.3 Huawei Investment & Holding Co Ltd
- 16.2.3.1. Overview
- 16.2.3.2. Products
- 16.2.3.3. SWOT Analysis
- 16.2.3.4. Recent Developments
- 16.2.3.5. Financials (Based on Availability)
- 16.2.4 Silver Power Systems
- 16.2.4.1. Overview
- 16.2.4.2. Products
- 16.2.4.3. SWOT Analysis
- 16.2.4.4. Recent Developments
- 16.2.4.5. Financials (Based on Availability)
- 16.2.5 Eltek Ltd
- 16.2.5.1. Overview
- 16.2.5.2. Products
- 16.2.5.3. SWOT Analysis
- 16.2.5.4. Recent Developments
- 16.2.5.5. Financials (Based on Availability)
- 16.2.6 Siemens Gamesa Renewable Energy SA
- 16.2.6.1. Overview
- 16.2.6.2. Products
- 16.2.6.3. SWOT Analysis
- 16.2.6.4. Recent Developments
- 16.2.6.5. Financials (Based on Availability)
- 16.2.7 Vergnet SA*List Not Exhaustive
- 16.2.7.1. Overview
- 16.2.7.2. Products
- 16.2.7.3. SWOT Analysis
- 16.2.7.4. Recent Developments
- 16.2.7.5. Financials (Based on Availability)
- 16.2.8 General Electric Company
- 16.2.8.1. Overview
- 16.2.8.2. Products
- 16.2.8.3. SWOT Analysis
- 16.2.8.4. Recent Developments
- 16.2.8.5. Financials (Based on Availability)
- 16.2.9 SMA Solar Technology AG
- 16.2.9.1. Overview
- 16.2.9.2. Products
- 16.2.9.3. SWOT Analysis
- 16.2.9.4. Recent Developments
- 16.2.9.5. Financials (Based on Availability)
- 16.2.1 Danvest BV
List of Figures
- Figure 1: Global Hybrid Power Solutions Market Revenue Breakdown (Million, %) by Region 2024 & 2032
- Figure 2: North America Hybrid Power Solutions Market Revenue (Million), by Country 2024 & 2032
- Figure 3: North America Hybrid Power Solutions Market Revenue Share (%), by Country 2024 & 2032
- Figure 4: Europe Hybrid Power Solutions Market Revenue (Million), by Country 2024 & 2032
- Figure 5: Europe Hybrid Power Solutions Market Revenue Share (%), by Country 2024 & 2032
- Figure 6: Asia Pacific Hybrid Power Solutions Market Revenue (Million), by Country 2024 & 2032
- Figure 7: Asia Pacific Hybrid Power Solutions Market Revenue Share (%), by Country 2024 & 2032
- Figure 8: South America Hybrid Power Solutions Market Revenue (Million), by Country 2024 & 2032
- Figure 9: South America Hybrid Power Solutions Market Revenue Share (%), by Country 2024 & 2032
- Figure 10: Middle East and Africa Hybrid Power Solutions Market Revenue (Million), by Country 2024 & 2032
- Figure 11: Middle East and Africa Hybrid Power Solutions Market Revenue Share (%), by Country 2024 & 2032
- Figure 12: North America Hybrid Power Solutions Market Revenue (Million), by Configuration 2024 & 2032
- Figure 13: North America Hybrid Power Solutions Market Revenue Share (%), by Configuration 2024 & 2032
- Figure 14: North America Hybrid Power Solutions Market Revenue (Million), by End-User 2024 & 2032
- Figure 15: North America Hybrid Power Solutions Market Revenue Share (%), by End-User 2024 & 2032
- Figure 16: North America Hybrid Power Solutions Market Revenue (Million), by Country 2024 & 2032
- Figure 17: North America Hybrid Power Solutions Market Revenue Share (%), by Country 2024 & 2032
- Figure 18: Europe Hybrid Power Solutions Market Revenue (Million), by Configuration 2024 & 2032
- Figure 19: Europe Hybrid Power Solutions Market Revenue Share (%), by Configuration 2024 & 2032
- Figure 20: Europe Hybrid Power Solutions Market Revenue (Million), by End-User 2024 & 2032
- Figure 21: Europe Hybrid Power Solutions Market Revenue Share (%), by End-User 2024 & 2032
- Figure 22: Europe Hybrid Power Solutions Market Revenue (Million), by Country 2024 & 2032
- Figure 23: Europe Hybrid Power Solutions Market Revenue Share (%), by Country 2024 & 2032
- Figure 24: Asia Pacific Hybrid Power Solutions Market Revenue (Million), by Configuration 2024 & 2032
- Figure 25: Asia Pacific Hybrid Power Solutions Market Revenue Share (%), by Configuration 2024 & 2032
- Figure 26: Asia Pacific Hybrid Power Solutions Market Revenue (Million), by End-User 2024 & 2032
- Figure 27: Asia Pacific Hybrid Power Solutions Market Revenue Share (%), by End-User 2024 & 2032
- Figure 28: Asia Pacific Hybrid Power Solutions Market Revenue (Million), by Country 2024 & 2032
- Figure 29: Asia Pacific Hybrid Power Solutions Market Revenue Share (%), by Country 2024 & 2032
- Figure 30: South America Hybrid Power Solutions Market Revenue (Million), by Configuration 2024 & 2032
- Figure 31: South America Hybrid Power Solutions Market Revenue Share (%), by Configuration 2024 & 2032
- Figure 32: South America Hybrid Power Solutions Market Revenue (Million), by End-User 2024 & 2032
- Figure 33: South America Hybrid Power Solutions Market Revenue Share (%), by End-User 2024 & 2032
- Figure 34: South America Hybrid Power Solutions Market Revenue (Million), by Country 2024 & 2032
- Figure 35: South America Hybrid Power Solutions Market Revenue Share (%), by Country 2024 & 2032
- Figure 36: Middle East and Africa Hybrid Power Solutions Market Revenue (Million), by Configuration 2024 & 2032
- Figure 37: Middle East and Africa Hybrid Power Solutions Market Revenue Share (%), by Configuration 2024 & 2032
- Figure 38: Middle East and Africa Hybrid Power Solutions Market Revenue (Million), by End-User 2024 & 2032
- Figure 39: Middle East and Africa Hybrid Power Solutions Market Revenue Share (%), by End-User 2024 & 2032
- Figure 40: Middle East and Africa Hybrid Power Solutions Market Revenue (Million), by Country 2024 & 2032
- Figure 41: Middle East and Africa Hybrid Power Solutions Market Revenue Share (%), by Country 2024 & 2032
List of Tables
- Table 1: Global Hybrid Power Solutions Market Revenue Million Forecast, by Region 2019 & 2032
- Table 2: Global Hybrid Power Solutions Market Revenue Million Forecast, by Configuration 2019 & 2032
- Table 3: Global Hybrid Power Solutions Market Revenue Million Forecast, by End-User 2019 & 2032
- Table 4: Global Hybrid Power Solutions Market Revenue Million Forecast, by Region 2019 & 2032
- Table 5: Global Hybrid Power Solutions Market Revenue Million Forecast, by Country 2019 & 2032
- Table 6: United States Hybrid Power Solutions Market Revenue (Million) Forecast, by Application 2019 & 2032
- Table 7: Canada Hybrid Power Solutions Market Revenue (Million) Forecast, by Application 2019 & 2032
- Table 8: Rest of North America Hybrid Power Solutions Market Revenue (Million) Forecast, by Application 2019 & 2032
- Table 9: Global Hybrid Power Solutions Market Revenue Million Forecast, by Country 2019 & 2032
- Table 10: Germany Hybrid Power Solutions Market Revenue (Million) Forecast, by Application 2019 & 2032
- Table 11: United Kingdom Hybrid Power Solutions Market Revenue (Million) Forecast, by Application 2019 & 2032
- Table 12: Italy Hybrid Power Solutions Market Revenue (Million) Forecast, by Application 2019 & 2032
- Table 13: France Hybrid Power Solutions Market Revenue (Million) Forecast, by Application 2019 & 2032
- Table 14: Rest of Europe Hybrid Power Solutions Market Revenue (Million) Forecast, by Application 2019 & 2032
- Table 15: Global Hybrid Power Solutions Market Revenue Million Forecast, by Country 2019 & 2032
- Table 16: China Hybrid Power Solutions Market Revenue (Million) Forecast, by Application 2019 & 2032
- Table 17: India Hybrid Power Solutions Market Revenue (Million) Forecast, by Application 2019 & 2032
- Table 18: Australia Hybrid Power Solutions Market Revenue (Million) Forecast, by Application 2019 & 2032
- Table 19: Japan Hybrid Power Solutions Market Revenue (Million) Forecast, by Application 2019 & 2032
- Table 20: South Korea Hybrid Power Solutions Market Revenue (Million) Forecast, by Application 2019 & 2032
- Table 21: Rest of Asia Pacific Hybrid Power Solutions Market Revenue (Million) Forecast, by Application 2019 & 2032
- Table 22: Global Hybrid Power Solutions Market Revenue Million Forecast, by Country 2019 & 2032
- Table 23: Brazil Hybrid Power Solutions Market Revenue (Million) Forecast, by Application 2019 & 2032
- Table 24: Argentina Hybrid Power Solutions Market Revenue (Million) Forecast, by Application 2019 & 2032
- Table 25: Rest of South America Hybrid Power Solutions Market Revenue (Million) Forecast, by Application 2019 & 2032
- Table 26: Global Hybrid Power Solutions Market Revenue Million Forecast, by Country 2019 & 2032
- Table 27: Saudi Arabia Hybrid Power Solutions Market Revenue (Million) Forecast, by Application 2019 & 2032
- Table 28: United Arab Emirates Hybrid Power Solutions Market Revenue (Million) Forecast, by Application 2019 & 2032
- Table 29: Egypt Hybrid Power Solutions Market Revenue (Million) Forecast, by Application 2019 & 2032
- Table 30: South Afrcia Hybrid Power Solutions Market Revenue (Million) Forecast, by Application 2019 & 2032
- Table 31: Rest of Middle East and Africa Hybrid Power Solutions Market Revenue (Million) Forecast, by Application 2019 & 2032
- Table 32: Global Hybrid Power Solutions Market Revenue Million Forecast, by Configuration 2019 & 2032
- Table 33: Global Hybrid Power Solutions Market Revenue Million Forecast, by End-User 2019 & 2032
- Table 34: Global Hybrid Power Solutions Market Revenue Million Forecast, by Country 2019 & 2032
- Table 35: United States Hybrid Power Solutions Market Revenue (Million) Forecast, by Application 2019 & 2032
- Table 36: Canada Hybrid Power Solutions Market Revenue (Million) Forecast, by Application 2019 & 2032
- Table 37: Rest of North America Hybrid Power Solutions Market Revenue (Million) Forecast, by Application 2019 & 2032
- Table 38: Global Hybrid Power Solutions Market Revenue Million Forecast, by Configuration 2019 & 2032
- Table 39: Global Hybrid Power Solutions Market Revenue Million Forecast, by End-User 2019 & 2032
- Table 40: Global Hybrid Power Solutions Market Revenue Million Forecast, by Country 2019 & 2032
- Table 41: Germany Hybrid Power Solutions Market Revenue (Million) Forecast, by Application 2019 & 2032
- Table 42: United Kingdom Hybrid Power Solutions Market Revenue (Million) Forecast, by Application 2019 & 2032
- Table 43: Italy Hybrid Power Solutions Market Revenue (Million) Forecast, by Application 2019 & 2032
- Table 44: France Hybrid Power Solutions Market Revenue (Million) Forecast, by Application 2019 & 2032
- Table 45: Rest of Europe Hybrid Power Solutions Market Revenue (Million) Forecast, by Application 2019 & 2032
- Table 46: Global Hybrid Power Solutions Market Revenue Million Forecast, by Configuration 2019 & 2032
- Table 47: Global Hybrid Power Solutions Market Revenue Million Forecast, by End-User 2019 & 2032
- Table 48: Global Hybrid Power Solutions Market Revenue Million Forecast, by Country 2019 & 2032
- Table 49: China Hybrid Power Solutions Market Revenue (Million) Forecast, by Application 2019 & 2032
- Table 50: India Hybrid Power Solutions Market Revenue (Million) Forecast, by Application 2019 & 2032
- Table 51: Australia Hybrid Power Solutions Market Revenue (Million) Forecast, by Application 2019 & 2032
- Table 52: Japan Hybrid Power Solutions Market Revenue (Million) Forecast, by Application 2019 & 2032
- Table 53: South Korea Hybrid Power Solutions Market Revenue (Million) Forecast, by Application 2019 & 2032
- Table 54: Rest of Asia Pacific Hybrid Power Solutions Market Revenue (Million) Forecast, by Application 2019 & 2032
- Table 55: Global Hybrid Power Solutions Market Revenue Million Forecast, by Configuration 2019 & 2032
- Table 56: Global Hybrid Power Solutions Market Revenue Million Forecast, by End-User 2019 & 2032
- Table 57: Global Hybrid Power Solutions Market Revenue Million Forecast, by Country 2019 & 2032
- Table 58: Brazil Hybrid Power Solutions Market Revenue (Million) Forecast, by Application 2019 & 2032
- Table 59: Argentina Hybrid Power Solutions Market Revenue (Million) Forecast, by Application 2019 & 2032
- Table 60: Rest of South America Hybrid Power Solutions Market Revenue (Million) Forecast, by Application 2019 & 2032
- Table 61: Global Hybrid Power Solutions Market Revenue Million Forecast, by Configuration 2019 & 2032
- Table 62: Global Hybrid Power Solutions Market Revenue Million Forecast, by End-User 2019 & 2032
- Table 63: Global Hybrid Power Solutions Market Revenue Million Forecast, by Country 2019 & 2032
- Table 64: Saudi Arabia Hybrid Power Solutions Market Revenue (Million) Forecast, by Application 2019 & 2032
- Table 65: United Arab Emirates Hybrid Power Solutions Market Revenue (Million) Forecast, by Application 2019 & 2032
- Table 66: Egypt Hybrid Power Solutions Market Revenue (Million) Forecast, by Application 2019 & 2032
- Table 67: South Afrcia Hybrid Power Solutions Market Revenue (Million) Forecast, by Application 2019 & 2032
- Table 68: Rest of Middle East and Africa Hybrid Power Solutions Market Revenue (Million) Forecast, by Application 2019 & 2032
Frequently Asked Questions
1. What is the projected Compound Annual Growth Rate (CAGR) of the Hybrid Power Solutions Market?
The projected CAGR is approximately 10.70%.
2. Which companies are prominent players in the Hybrid Power Solutions Market?
Key companies in the market include Danvest BV, Engie SA, Huawei Investment & Holding Co Ltd, Silver Power Systems, Eltek Ltd, Siemens Gamesa Renewable Energy SA, Vergnet SA*List Not Exhaustive, General Electric Company, SMA Solar Technology AG.
3. What are the main segments of the Hybrid Power Solutions Market?
The market segments include Configuration, End-User.
4. Can you provide details about the market size?
The market size is estimated to be USD 2.51 Million as of 2022.
5. What are some drivers contributing to market growth?
4.; Growing Environmental Concerns4.; Supportive Government Policies.
6. What are the notable trends driving market growth?
Solar Generator Hybrid Segment to Dominate the Market.
7. Are there any restraints impacting market growth?
4.; High Initial Capital Investment.
8. Can you provide examples of recent developments in the market?
February 2023: Prolectric Services Ltd launched its latest solar energy hybrid power systems that can be deployed in remote locations. The power system ProPower 3-Phase Solar Hybrid Power unit is a high-performance system that brings 60 kw of hybrid (pass-through) power output to worksites, helping cut carbon emissions and reduce diesel use.
9. What pricing options are available for accessing the report?
Pricing options include single-user, multi-user, and enterprise licenses priced at USD 4750, USD 5250, and USD 8750 respectively.
10. Is the market size provided in terms of value or volume?
The market size is provided in terms of value, measured in Million.
11. Are there any specific market keywords associated with the report?
Yes, the market keyword associated with the report is "Hybrid Power Solutions Market," which aids in identifying and referencing the specific market segment covered.
12. How do I determine which pricing option suits my needs best?
The pricing options vary based on user requirements and access needs. Individual users may opt for single-user licenses, while businesses requiring broader access may choose multi-user or enterprise licenses for cost-effective access to the report.
13. Are there any additional resources or data provided in the Hybrid Power Solutions Market report?
While the report offers comprehensive insights, it's advisable to review the specific contents or supplementary materials provided to ascertain if additional resources or data are available.
14. How can I stay updated on further developments or reports in the Hybrid Power Solutions Market?
To stay informed about further developments, trends, and reports in the Hybrid Power Solutions Market, consider subscribing to industry newsletters, following relevant companies and organizations, or regularly checking reputable industry news sources and publications.
Methodology
Step 1 - Identification of Relevant Samples Size from Population Database


Step 2 - Approaches for Defining Global Market Size (Value, Volume* & Price*)

Note*: In applicable scenarios
Step 3 - Data Sources
Primary Research
- Web Analytics
- Survey Reports
- Research Institute
- Latest Research Reports
- Opinion Leaders
Secondary Research
- Annual Reports
- White Paper
- Latest Press Release
- Industry Association
- Paid Database
- Investor Presentations

Step 4 - Data Triangulation
Involves using different sources of information in order to increase the validity of a study
These sources are likely to be stakeholders in a program - participants, other researchers, program staff, other community members, and so on.
Then we put all data in single framework & apply various statistical tools to find out the dynamic on the market.
During the analysis stage, feedback from the stakeholder groups would be compared to determine areas of agreement as well as areas of divergence
