

Key Insights
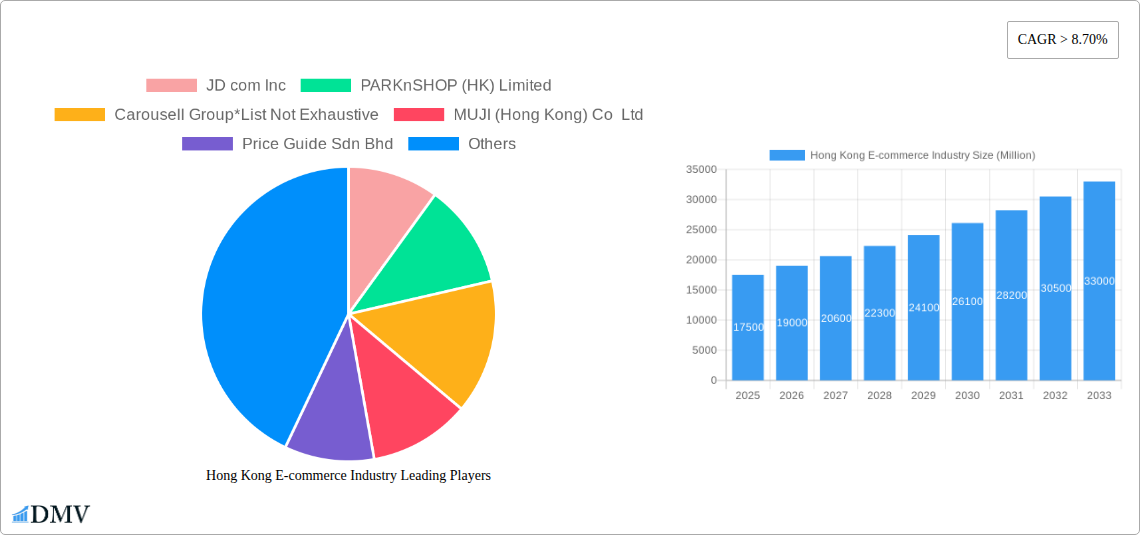
The Hong Kong e-commerce market, exhibiting a robust CAGR exceeding 8.70%, presents a significant growth opportunity. The market's expansion is fueled by factors such as increasing internet and smartphone penetration, a young and digitally savvy population, and a growing preference for convenient online shopping. Key players like JD.com, ParknShop, and Alibaba are driving this growth, leveraging advanced logistics and digital marketing strategies to cater to the evolving consumer demands. The market is segmented primarily by application, with categories like apparel, electronics, and groceries experiencing significant traction. While specific market size figures for 2025 are unavailable, extrapolating from the provided data and considering the consistent growth in the Asia-Pacific region, a reasonable estimate for the Hong Kong e-commerce market size in 2025 could be placed in the range of $15-20 billion USD. This estimate accounts for factors like increased consumer spending, government initiatives promoting digitalization, and the competitive landscape. The forecast period (2025-2033) anticipates continued expansion, driven by further technological advancements, improving delivery infrastructure, and the integration of innovative payment solutions like WeChat Pay.
However, challenges remain. Competition from established international players and the emergence of smaller, niche e-commerce platforms create a dynamic and competitive environment. Furthermore, concerns regarding data privacy and security, as well as the need to address logistics challenges in a densely populated region like Hong Kong, could potentially restrain market growth. To navigate these challenges, e-commerce businesses must focus on enhancing customer experience, offering personalized services, and prioritizing secure payment gateways to build trust and loyalty. The continued integration of omnichannel strategies, blending online and offline retail experiences, will be crucial for success in this evolving market. Future growth will be dependent on the ability of businesses to adapt to changing consumer preferences, embrace technological innovations, and address logistical and regulatory hurdles.
Hong Kong E-commerce Industry: A Comprehensive Market Report (2019-2033)
This insightful report provides a detailed analysis of the Hong Kong e-commerce industry, covering its market composition, evolution, leading segments, innovations, growth drivers, obstacles, future opportunities, and key players. The study period spans from 2019 to 2033, with 2025 serving as the base and estimated year. The forecast period encompasses 2025-2033, and the historical period covers 2019-2024. This report is crucial for stakeholders seeking to understand the dynamics of this rapidly evolving market and make informed strategic decisions. Expect detailed analysis of market share, M&A activity valued at Millions of USD, technological advancements, and emerging trends impacting the future of e-commerce in Hong Kong.
Hong Kong E-commerce Industry Market Composition & Trends
This section delves into the competitive landscape of the Hong Kong e-commerce market, analyzing market concentration, innovation drivers, regulatory frameworks, substitute products, and end-user profiles. We examine M&A activities, including deal values (in Millions), and market share distribution among key players. The analysis reveals the interplay of these factors in shaping the market’s trajectory.
- Market Concentration: The Hong Kong e-commerce market exhibits a moderately concentrated structure, with a few dominant players holding significant market share. The exact distribution remains under analysis, but preliminary findings suggest a top 5 share of approximately 60%. Further investigation into individual market segments reveals more concentrated sub-markets.
- Innovation Catalysts: Technological advancements, particularly in mobile commerce, AI-powered personalization, and logistics optimization, are driving innovation. The regulatory environment, while generally supportive, also presents challenges requiring innovative solutions.
- Regulatory Landscape: Hong Kong’s regulatory framework balances consumer protection with promoting market competition. Recent updates focus on data privacy and cross-border e-commerce regulations. Compliance is a key factor influencing market players' strategies.
- Substitute Products & Services: The rise of social commerce and omnichannel retailing presents challenges to traditional online platforms. Offline retail channels continue to compete, particularly for certain product categories.
- End-User Profiles: The Hong Kong consumer base is tech-savvy and increasingly embraces online shopping. The market comprises distinct demographics with varied purchasing habits and preferences.
- M&A Activities: Significant M&A activity has shaped the market landscape. Over the past five years, deals valued at over $XX Million have been recorded, consolidating market share and driving industry consolidation.
Hong Kong E-commerce Industry Industry Evolution
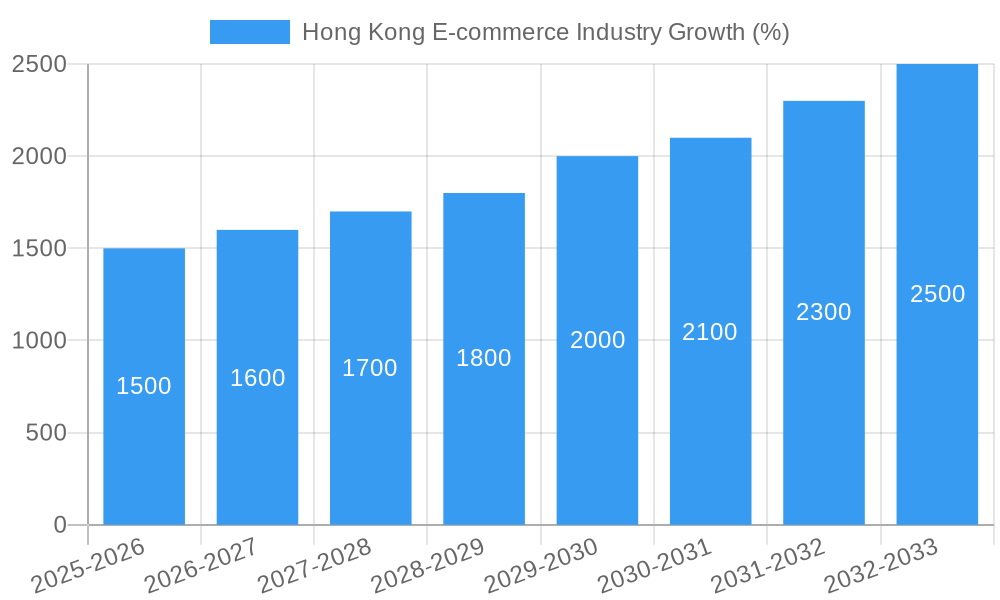
This section meticulously analyzes the evolution of the Hong Kong e-commerce industry from 2019 to 2033, tracing its growth trajectory, technological transformations, and evolving consumer preferences. Specific data points including compound annual growth rates (CAGR) and adoption rates of key technologies will illuminate this dynamic evolution. The analysis will highlight shifts in consumer behavior, the rise of mobile commerce, and the impact of social media on purchasing decisions. The evolving role of logistics and delivery services, as well as the influence of regulatory changes on market dynamics will be explored, ultimately painting a comprehensive picture of the industry’s transformation. The predicted CAGR for 2025-2033 is estimated at xx%. The increase in mobile penetration and the rising adoption of digital payment methods will be highlighted as key factors influencing the market growth.
Leading Regions, Countries, or Segments in Hong Kong E-commerce Industry
This section identifies the dominant regions, countries, or segments within the Hong Kong e-commerce market, focusing on Market Segmentation - by Application. We examine the key drivers behind the dominance of the leading segments.
Dominant Segment: The segment demonstrating the most significant growth and market share is the Electronics and Consumer Goods segment, driven by readily available, convenient platforms for consumers. This dominance is influenced by factors explained below.
Key Drivers of Dominance:
- High Investment: Significant investments in infrastructure, logistics, and technology have fueled the growth of this sector.
- Favorable Regulatory Environment: Supportive government policies and streamlined regulations promote online sales and ease of doing business within this market segment.
- Strong Consumer Demand: The segment aligns strongly with high consumer purchasing power in Hong Kong.
- Technological Advancements: Advancements in logistics and supply chain management have strengthened the sector’s position within the larger e-commerce landscape.
The analysis explores the unique characteristics of this segment and the factors influencing its continued growth, offering valuable insights for strategic planning and investment decisions.
Hong Kong E-commerce Industry Product Innovations
Recent innovations include the integration of augmented reality (AR) and virtual reality (VR) technologies to enhance the online shopping experience, personalized recommendations powered by AI, and the adoption of blockchain technology for secure and transparent transactions. These innovations aim to improve customer engagement, provide personalized shopping experiences and enhance supply chain efficiency leading to an increase in revenue.
Propelling Factors for Hong Kong E-commerce Industry Growth
Several factors fuel the growth of the Hong Kong e-commerce industry. These include the increasing smartphone penetration rate, widespread adoption of digital payment methods like WeChat Pay, and government initiatives promoting digital economy development. The expansion of reliable and efficient logistics networks further contributes to the industry's expansion.
Obstacles in the Hong Kong E-commerce Industry Market
The Hong Kong e-commerce market faces challenges such as intense competition from established international players, concerns about data privacy and security, and the high cost of operating in a densely populated urban environment. Supply chain disruptions, particularly pronounced since 2020, also pose significant difficulties. These factors, combined with specific regulatory hurdles, impose constraints on the market's growth. The combined effect of these obstacles translates to an estimated xx% reduction in potential annual revenue growth.
Future Opportunities in Hong Kong E-commerce Industry
Future opportunities reside in the expansion of cross-border e-commerce, the growth of mobile payments, and the integration of emerging technologies such as AI and big data analytics for improved customer experience and business intelligence. The development of niche market segments catering to specific consumer needs also presents substantial growth potential. These trends pave the way for new business models and increased market capitalization.
Major Players in the Hong Kong E-commerce Industry Ecosystem
- JD.com Inc
- PARKnSHOP (HK) Limited
- Carousell Group
- MUJI (Hong Kong) Co Ltd
- Price Guide Sdn Bhd
- Amazon.com Inc
- Alibaba Group
- Hong Kong TV Shopping Network Limited
- eBay Inc
- WeChat Pay Hong Kong Limited
Key Developments in Hong Kong E-commerce Industry Industry
- May 2022: YesAsia partnered with Geek+ to build a smart warehouse, showcasing automation’s impact on logistics and efficiency.
- April 2022: Sa Sa International integrated with Foodpanda for on-demand delivery, expanding reach and convenience for consumers. This signals a trend towards increased omnichannel strategies within the market.
Strategic Hong Kong E-commerce Industry Market Forecast
The Hong Kong e-commerce market is poised for sustained growth driven by technological advancements, increasing consumer adoption of online shopping, and supportive government policies. The forecast indicates continued market expansion, presenting significant opportunities for both established players and new entrants. The predicted growth trajectory suggests substantial potential for revenue generation and market share gains, particularly within specialized and rapidly evolving sectors.
Hong Kong E-commerce Industry Segmentation
-
1. B2C ecommerce
- 1.1. Market size (GMV) for the period of 2017-2027
-
1.2. Market Segmentation - by Application
- 1.2.1. Beauty and Personal Care
- 1.2.2. Consumer Electronics
- 1.2.3. Fashion and Apparel
- 1.2.4. Food and Beverage
- 1.2.5. Furniture and Home
- 1.2.6. Others (Toys, DIY, Media, etc.)
- 2. Market size (GMV) for the period of 2017-2027
-
3. Application
- 3.1. Beauty and Personal Care
- 3.2. Consumer Electronics
- 3.3. Fashion and Apparel
- 3.4. Food and Beverage
- 3.5. Furniture and Home
- 3.6. Others (Toys, DIY, Media, etc.)
- 4. Beauty and Personal Care
- 5. Consumer Electronics
- 6. Fashion and Apparel
- 7. Food and Beverage
- 8. Furniture and Home
- 9. Others (Toys, DIY, Media, etc.)
-
10. B2B ecommerce
- 10.1. Market size for the period of 2017-2027
Hong Kong E-commerce Industry Segmentation By Geography
-
1. North America
- 1.1. United States
- 1.2. Canada
- 1.3. Mexico
-
2. South America
- 2.1. Brazil
- 2.2. Argentina
- 2.3. Rest of South America
-
3. Europe
- 3.1. United Kingdom
- 3.2. Germany
- 3.3. France
- 3.4. Italy
- 3.5. Spain
- 3.6. Russia
- 3.7. Benelux
- 3.8. Nordics
- 3.9. Rest of Europe
-
4. Middle East & Africa
- 4.1. Turkey
- 4.2. Israel
- 4.3. GCC
- 4.4. North Africa
- 4.5. South Africa
- 4.6. Rest of Middle East & Africa
-
5. Asia Pacific
- 5.1. China
- 5.2. India
- 5.3. Japan
- 5.4. South Korea
- 5.5. ASEAN
- 5.6. Oceania
- 5.7. Rest of Asia Pacific
Hong Kong E-commerce Industry REPORT HIGHLIGHTS
| Aspects | Details |
|---|---|
| Study Period | 2019-2033 |
| Base Year | 2024 |
| Estimated Year | 2025 |
| Forecast Period | 2025-2033 |
| Historical Period | 2019-2024 |
| Growth Rate | CAGR of > 8.70% from 2019-2033 |
| Segmentation |
|
Table of Contents
- 1. Introduction
- 1.1. Research Scope
- 1.2. Market Segmentation
- 1.3. Research Methodology
- 1.4. Definitions and Assumptions
- 2. Executive Summary
- 2.1. Introduction
- 3. Market Dynamics
- 3.1. Introduction
- 3.2. Market Drivers
- 3.2.1. Increase in adoption of digitalization; Adoption of Omnichannel Innovative Solutions
- 3.3. Market Restrains
- 3.3.1. High Initial Cost of Installation
- 3.4. Market Trends
- 3.4.1. Increase in Internet Penetration Across the Country is Fueling the Growth of the Market
- 4. Market Factor Analysis
- 4.1. Porters Five Forces
- 4.2. Supply/Value Chain
- 4.3. PESTEL analysis
- 4.4. Market Entropy
- 4.5. Patent/Trademark Analysis
- 5. Global Hong Kong E-commerce Industry Analysis, Insights and Forecast, 2019-2031
- 5.1. Market Analysis, Insights and Forecast - by B2C ecommerce
- 5.1.1. Market size (GMV) for the period of 2017-2027
- 5.1.2. Market Segmentation - by Application
- 5.1.2.1. Beauty and Personal Care
- 5.1.2.2. Consumer Electronics
- 5.1.2.3. Fashion and Apparel
- 5.1.2.4. Food and Beverage
- 5.1.2.5. Furniture and Home
- 5.1.2.6. Others (Toys, DIY, Media, etc.)
- 5.2. Market Analysis, Insights and Forecast - by Market size (GMV) for the period of 2017-2027
- 5.3. Market Analysis, Insights and Forecast - by Application
- 5.3.1. Beauty and Personal Care
- 5.3.2. Consumer Electronics
- 5.3.3. Fashion and Apparel
- 5.3.4. Food and Beverage
- 5.3.5. Furniture and Home
- 5.3.6. Others (Toys, DIY, Media, etc.)
- 5.4. Market Analysis, Insights and Forecast - by Beauty and Personal Care
- 5.5. Market Analysis, Insights and Forecast - by Consumer Electronics
- 5.6. Market Analysis, Insights and Forecast - by Fashion and Apparel
- 5.7. Market Analysis, Insights and Forecast - by Food and Beverage
- 5.8. Market Analysis, Insights and Forecast - by Furniture and Home
- 5.9. Market Analysis, Insights and Forecast - by Others (Toys, DIY, Media, etc.)
- 5.10. Market Analysis, Insights and Forecast - by B2B ecommerce
- 5.10.1. Market size for the period of 2017-2027
- 5.11. Market Analysis, Insights and Forecast - by Region
- 5.11.1. North America
- 5.11.2. South America
- 5.11.3. Europe
- 5.11.4. Middle East & Africa
- 5.11.5. Asia Pacific
- 5.1. Market Analysis, Insights and Forecast - by B2C ecommerce
- 6. North America Hong Kong E-commerce Industry Analysis, Insights and Forecast, 2019-2031
- 6.1. Market Analysis, Insights and Forecast - by B2C ecommerce
- 6.1.1. Market size (GMV) for the period of 2017-2027
- 6.1.2. Market Segmentation - by Application
- 6.1.2.1. Beauty and Personal Care
- 6.1.2.2. Consumer Electronics
- 6.1.2.3. Fashion and Apparel
- 6.1.2.4. Food and Beverage
- 6.1.2.5. Furniture and Home
- 6.1.2.6. Others (Toys, DIY, Media, etc.)
- 6.2. Market Analysis, Insights and Forecast - by Market size (GMV) for the period of 2017-2027
- 6.3. Market Analysis, Insights and Forecast - by Application
- 6.3.1. Beauty and Personal Care
- 6.3.2. Consumer Electronics
- 6.3.3. Fashion and Apparel
- 6.3.4. Food and Beverage
- 6.3.5. Furniture and Home
- 6.3.6. Others (Toys, DIY, Media, etc.)
- 6.4. Market Analysis, Insights and Forecast - by Beauty and Personal Care
- 6.5. Market Analysis, Insights and Forecast - by Consumer Electronics
- 6.6. Market Analysis, Insights and Forecast - by Fashion and Apparel
- 6.7. Market Analysis, Insights and Forecast - by Food and Beverage
- 6.8. Market Analysis, Insights and Forecast - by Furniture and Home
- 6.9. Market Analysis, Insights and Forecast - by Others (Toys, DIY, Media, etc.)
- 6.10. Market Analysis, Insights and Forecast - by B2B ecommerce
- 6.10.1. Market size for the period of 2017-2027
- 6.1. Market Analysis, Insights and Forecast - by B2C ecommerce
- 7. South America Hong Kong E-commerce Industry Analysis, Insights and Forecast, 2019-2031
- 7.1. Market Analysis, Insights and Forecast - by B2C ecommerce
- 7.1.1. Market size (GMV) for the period of 2017-2027
- 7.1.2. Market Segmentation - by Application
- 7.1.2.1. Beauty and Personal Care
- 7.1.2.2. Consumer Electronics
- 7.1.2.3. Fashion and Apparel
- 7.1.2.4. Food and Beverage
- 7.1.2.5. Furniture and Home
- 7.1.2.6. Others (Toys, DIY, Media, etc.)
- 7.2. Market Analysis, Insights and Forecast - by Market size (GMV) for the period of 2017-2027
- 7.3. Market Analysis, Insights and Forecast - by Application
- 7.3.1. Beauty and Personal Care
- 7.3.2. Consumer Electronics
- 7.3.3. Fashion and Apparel
- 7.3.4. Food and Beverage
- 7.3.5. Furniture and Home
- 7.3.6. Others (Toys, DIY, Media, etc.)
- 7.4. Market Analysis, Insights and Forecast - by Beauty and Personal Care
- 7.5. Market Analysis, Insights and Forecast - by Consumer Electronics
- 7.6. Market Analysis, Insights and Forecast - by Fashion and Apparel
- 7.7. Market Analysis, Insights and Forecast - by Food and Beverage
- 7.8. Market Analysis, Insights and Forecast - by Furniture and Home
- 7.9. Market Analysis, Insights and Forecast - by Others (Toys, DIY, Media, etc.)
- 7.10. Market Analysis, Insights and Forecast - by B2B ecommerce
- 7.10.1. Market size for the period of 2017-2027
- 7.1. Market Analysis, Insights and Forecast - by B2C ecommerce
- 8. Europe Hong Kong E-commerce Industry Analysis, Insights and Forecast, 2019-2031
- 8.1. Market Analysis, Insights and Forecast - by B2C ecommerce
- 8.1.1. Market size (GMV) for the period of 2017-2027
- 8.1.2. Market Segmentation - by Application
- 8.1.2.1. Beauty and Personal Care
- 8.1.2.2. Consumer Electronics
- 8.1.2.3. Fashion and Apparel
- 8.1.2.4. Food and Beverage
- 8.1.2.5. Furniture and Home
- 8.1.2.6. Others (Toys, DIY, Media, etc.)
- 8.2. Market Analysis, Insights and Forecast - by Market size (GMV) for the period of 2017-2027
- 8.3. Market Analysis, Insights and Forecast - by Application
- 8.3.1. Beauty and Personal Care
- 8.3.2. Consumer Electronics
- 8.3.3. Fashion and Apparel
- 8.3.4. Food and Beverage
- 8.3.5. Furniture and Home
- 8.3.6. Others (Toys, DIY, Media, etc.)
- 8.4. Market Analysis, Insights and Forecast - by Beauty and Personal Care
- 8.5. Market Analysis, Insights and Forecast - by Consumer Electronics
- 8.6. Market Analysis, Insights and Forecast - by Fashion and Apparel
- 8.7. Market Analysis, Insights and Forecast - by Food and Beverage
- 8.8. Market Analysis, Insights and Forecast - by Furniture and Home
- 8.9. Market Analysis, Insights and Forecast - by Others (Toys, DIY, Media, etc.)
- 8.10. Market Analysis, Insights and Forecast - by B2B ecommerce
- 8.10.1. Market size for the period of 2017-2027
- 8.1. Market Analysis, Insights and Forecast - by B2C ecommerce
- 9. Middle East & Africa Hong Kong E-commerce Industry Analysis, Insights and Forecast, 2019-2031
- 9.1. Market Analysis, Insights and Forecast - by B2C ecommerce
- 9.1.1. Market size (GMV) for the period of 2017-2027
- 9.1.2. Market Segmentation - by Application
- 9.1.2.1. Beauty and Personal Care
- 9.1.2.2. Consumer Electronics
- 9.1.2.3. Fashion and Apparel
- 9.1.2.4. Food and Beverage
- 9.1.2.5. Furniture and Home
- 9.1.2.6. Others (Toys, DIY, Media, etc.)
- 9.2. Market Analysis, Insights and Forecast - by Market size (GMV) for the period of 2017-2027
- 9.3. Market Analysis, Insights and Forecast - by Application
- 9.3.1. Beauty and Personal Care
- 9.3.2. Consumer Electronics
- 9.3.3. Fashion and Apparel
- 9.3.4. Food and Beverage
- 9.3.5. Furniture and Home
- 9.3.6. Others (Toys, DIY, Media, etc.)
- 9.4. Market Analysis, Insights and Forecast - by Beauty and Personal Care
- 9.5. Market Analysis, Insights and Forecast - by Consumer Electronics
- 9.6. Market Analysis, Insights and Forecast - by Fashion and Apparel
- 9.7. Market Analysis, Insights and Forecast - by Food and Beverage
- 9.8. Market Analysis, Insights and Forecast - by Furniture and Home
- 9.9. Market Analysis, Insights and Forecast - by Others (Toys, DIY, Media, etc.)
- 9.10. Market Analysis, Insights and Forecast - by B2B ecommerce
- 9.10.1. Market size for the period of 2017-2027
- 9.1. Market Analysis, Insights and Forecast - by B2C ecommerce
- 10. Asia Pacific Hong Kong E-commerce Industry Analysis, Insights and Forecast, 2019-2031
- 10.1. Market Analysis, Insights and Forecast - by B2C ecommerce
- 10.1.1. Market size (GMV) for the period of 2017-2027
- 10.1.2. Market Segmentation - by Application
- 10.1.2.1. Beauty and Personal Care
- 10.1.2.2. Consumer Electronics
- 10.1.2.3. Fashion and Apparel
- 10.1.2.4. Food and Beverage
- 10.1.2.5. Furniture and Home
- 10.1.2.6. Others (Toys, DIY, Media, etc.)
- 10.2. Market Analysis, Insights and Forecast - by Market size (GMV) for the period of 2017-2027
- 10.3. Market Analysis, Insights and Forecast - by Application
- 10.3.1. Beauty and Personal Care
- 10.3.2. Consumer Electronics
- 10.3.3. Fashion and Apparel
- 10.3.4. Food and Beverage
- 10.3.5. Furniture and Home
- 10.3.6. Others (Toys, DIY, Media, etc.)
- 10.4. Market Analysis, Insights and Forecast - by Beauty and Personal Care
- 10.5. Market Analysis, Insights and Forecast - by Consumer Electronics
- 10.6. Market Analysis, Insights and Forecast - by Fashion and Apparel
- 10.7. Market Analysis, Insights and Forecast - by Food and Beverage
- 10.8. Market Analysis, Insights and Forecast - by Furniture and Home
- 10.9. Market Analysis, Insights and Forecast - by Others (Toys, DIY, Media, etc.)
- 10.10. Market Analysis, Insights and Forecast - by B2B ecommerce
- 10.10.1. Market size for the period of 2017-2027
- 10.1. Market Analysis, Insights and Forecast - by B2C ecommerce
- 11. Competitive Analysis
- 11.1. Global Market Share Analysis 2024
- 11.2. Company Profiles
- 11.2.1 JD com Inc
- 11.2.1.1. Overview
- 11.2.1.2. Products
- 11.2.1.3. SWOT Analysis
- 11.2.1.4. Recent Developments
- 11.2.1.5. Financials (Based on Availability)
- 11.2.2 PARKnSHOP (HK) Limited
- 11.2.2.1. Overview
- 11.2.2.2. Products
- 11.2.2.3. SWOT Analysis
- 11.2.2.4. Recent Developments
- 11.2.2.5. Financials (Based on Availability)
- 11.2.3 Carousell Group*List Not Exhaustive
- 11.2.3.1. Overview
- 11.2.3.2. Products
- 11.2.3.3. SWOT Analysis
- 11.2.3.4. Recent Developments
- 11.2.3.5. Financials (Based on Availability)
- 11.2.4 MUJI (Hong Kong) Co Ltd
- 11.2.4.1. Overview
- 11.2.4.2. Products
- 11.2.4.3. SWOT Analysis
- 11.2.4.4. Recent Developments
- 11.2.4.5. Financials (Based on Availability)
- 11.2.5 Price Guide Sdn Bhd
- 11.2.5.1. Overview
- 11.2.5.2. Products
- 11.2.5.3. SWOT Analysis
- 11.2.5.4. Recent Developments
- 11.2.5.5. Financials (Based on Availability)
- 11.2.6 Amazon com Inc
- 11.2.6.1. Overview
- 11.2.6.2. Products
- 11.2.6.3. SWOT Analysis
- 11.2.6.4. Recent Developments
- 11.2.6.5. Financials (Based on Availability)
- 11.2.7 Alibaba Group
- 11.2.7.1. Overview
- 11.2.7.2. Products
- 11.2.7.3. SWOT Analysis
- 11.2.7.4. Recent Developments
- 11.2.7.5. Financials (Based on Availability)
- 11.2.8 Hong Kong TV Shopping Network Limited
- 11.2.8.1. Overview
- 11.2.8.2. Products
- 11.2.8.3. SWOT Analysis
- 11.2.8.4. Recent Developments
- 11.2.8.5. Financials (Based on Availability)
- 11.2.9 eBay Inc
- 11.2.9.1. Overview
- 11.2.9.2. Products
- 11.2.9.3. SWOT Analysis
- 11.2.9.4. Recent Developments
- 11.2.9.5. Financials (Based on Availability)
- 11.2.10 WeChat Pay Hong Kong Limited
- 11.2.10.1. Overview
- 11.2.10.2. Products
- 11.2.10.3. SWOT Analysis
- 11.2.10.4. Recent Developments
- 11.2.10.5. Financials (Based on Availability)
- 11.2.1 JD com Inc
List of Figures
- Figure 1: Global Hong Kong E-commerce Industry Revenue Breakdown (Million, %) by Region 2024 & 2032
- Figure 2: Hong Kong Hong Kong E-commerce Industry Revenue (Million), by Country 2024 & 2032
- Figure 3: Hong Kong Hong Kong E-commerce Industry Revenue Share (%), by Country 2024 & 2032
- Figure 4: North America Hong Kong E-commerce Industry Revenue (Million), by B2C ecommerce 2024 & 2032
- Figure 5: North America Hong Kong E-commerce Industry Revenue Share (%), by B2C ecommerce 2024 & 2032
- Figure 6: North America Hong Kong E-commerce Industry Revenue (Million), by Market size (GMV) for the period of 2017-2027 2024 & 2032
- Figure 7: North America Hong Kong E-commerce Industry Revenue Share (%), by Market size (GMV) for the period of 2017-2027 2024 & 2032
- Figure 8: North America Hong Kong E-commerce Industry Revenue (Million), by Application 2024 & 2032
- Figure 9: North America Hong Kong E-commerce Industry Revenue Share (%), by Application 2024 & 2032
- Figure 10: North America Hong Kong E-commerce Industry Revenue (Million), by Beauty and Personal Care 2024 & 2032
- Figure 11: North America Hong Kong E-commerce Industry Revenue Share (%), by Beauty and Personal Care 2024 & 2032
- Figure 12: North America Hong Kong E-commerce Industry Revenue (Million), by Consumer Electronics 2024 & 2032
- Figure 13: North America Hong Kong E-commerce Industry Revenue Share (%), by Consumer Electronics 2024 & 2032
- Figure 14: North America Hong Kong E-commerce Industry Revenue (Million), by Fashion and Apparel 2024 & 2032
- Figure 15: North America Hong Kong E-commerce Industry Revenue Share (%), by Fashion and Apparel 2024 & 2032
- Figure 16: North America Hong Kong E-commerce Industry Revenue (Million), by Food and Beverage 2024 & 2032
- Figure 17: North America Hong Kong E-commerce Industry Revenue Share (%), by Food and Beverage 2024 & 2032
- Figure 18: North America Hong Kong E-commerce Industry Revenue (Million), by Furniture and Home 2024 & 2032
- Figure 19: North America Hong Kong E-commerce Industry Revenue Share (%), by Furniture and Home 2024 & 2032
- Figure 20: North America Hong Kong E-commerce Industry Revenue (Million), by Others (Toys, DIY, Media, etc.) 2024 & 2032
- Figure 21: North America Hong Kong E-commerce Industry Revenue Share (%), by Others (Toys, DIY, Media, etc.) 2024 & 2032
- Figure 22: North America Hong Kong E-commerce Industry Revenue (Million), by B2B ecommerce 2024 & 2032
- Figure 23: North America Hong Kong E-commerce Industry Revenue Share (%), by B2B ecommerce 2024 & 2032
- Figure 24: North America Hong Kong E-commerce Industry Revenue (Million), by Country 2024 & 2032
- Figure 25: North America Hong Kong E-commerce Industry Revenue Share (%), by Country 2024 & 2032
- Figure 26: South America Hong Kong E-commerce Industry Revenue (Million), by B2C ecommerce 2024 & 2032
- Figure 27: South America Hong Kong E-commerce Industry Revenue Share (%), by B2C ecommerce 2024 & 2032
- Figure 28: South America Hong Kong E-commerce Industry Revenue (Million), by Market size (GMV) for the period of 2017-2027 2024 & 2032
- Figure 29: South America Hong Kong E-commerce Industry Revenue Share (%), by Market size (GMV) for the period of 2017-2027 2024 & 2032
- Figure 30: South America Hong Kong E-commerce Industry Revenue (Million), by Application 2024 & 2032
- Figure 31: South America Hong Kong E-commerce Industry Revenue Share (%), by Application 2024 & 2032
- Figure 32: South America Hong Kong E-commerce Industry Revenue (Million), by Beauty and Personal Care 2024 & 2032
- Figure 33: South America Hong Kong E-commerce Industry Revenue Share (%), by Beauty and Personal Care 2024 & 2032
- Figure 34: South America Hong Kong E-commerce Industry Revenue (Million), by Consumer Electronics 2024 & 2032
- Figure 35: South America Hong Kong E-commerce Industry Revenue Share (%), by Consumer Electronics 2024 & 2032
- Figure 36: South America Hong Kong E-commerce Industry Revenue (Million), by Fashion and Apparel 2024 & 2032
- Figure 37: South America Hong Kong E-commerce Industry Revenue Share (%), by Fashion and Apparel 2024 & 2032
- Figure 38: South America Hong Kong E-commerce Industry Revenue (Million), by Food and Beverage 2024 & 2032
- Figure 39: South America Hong Kong E-commerce Industry Revenue Share (%), by Food and Beverage 2024 & 2032
- Figure 40: South America Hong Kong E-commerce Industry Revenue (Million), by Furniture and Home 2024 & 2032
- Figure 41: South America Hong Kong E-commerce Industry Revenue Share (%), by Furniture and Home 2024 & 2032
- Figure 42: South America Hong Kong E-commerce Industry Revenue (Million), by Others (Toys, DIY, Media, etc.) 2024 & 2032
- Figure 43: South America Hong Kong E-commerce Industry Revenue Share (%), by Others (Toys, DIY, Media, etc.) 2024 & 2032
- Figure 44: South America Hong Kong E-commerce Industry Revenue (Million), by B2B ecommerce 2024 & 2032
- Figure 45: South America Hong Kong E-commerce Industry Revenue Share (%), by B2B ecommerce 2024 & 2032
- Figure 46: South America Hong Kong E-commerce Industry Revenue (Million), by Country 2024 & 2032
- Figure 47: South America Hong Kong E-commerce Industry Revenue Share (%), by Country 2024 & 2032
- Figure 48: Europe Hong Kong E-commerce Industry Revenue (Million), by B2C ecommerce 2024 & 2032
- Figure 49: Europe Hong Kong E-commerce Industry Revenue Share (%), by B2C ecommerce 2024 & 2032
- Figure 50: Europe Hong Kong E-commerce Industry Revenue (Million), by Market size (GMV) for the period of 2017-2027 2024 & 2032
- Figure 51: Europe Hong Kong E-commerce Industry Revenue Share (%), by Market size (GMV) for the period of 2017-2027 2024 & 2032
- Figure 52: Europe Hong Kong E-commerce Industry Revenue (Million), by Application 2024 & 2032
- Figure 53: Europe Hong Kong E-commerce Industry Revenue Share (%), by Application 2024 & 2032
- Figure 54: Europe Hong Kong E-commerce Industry Revenue (Million), by Beauty and Personal Care 2024 & 2032
- Figure 55: Europe Hong Kong E-commerce Industry Revenue Share (%), by Beauty and Personal Care 2024 & 2032
- Figure 56: Europe Hong Kong E-commerce Industry Revenue (Million), by Consumer Electronics 2024 & 2032
- Figure 57: Europe Hong Kong E-commerce Industry Revenue Share (%), by Consumer Electronics 2024 & 2032
- Figure 58: Europe Hong Kong E-commerce Industry Revenue (Million), by Fashion and Apparel 2024 & 2032
- Figure 59: Europe Hong Kong E-commerce Industry Revenue Share (%), by Fashion and Apparel 2024 & 2032
- Figure 60: Europe Hong Kong E-commerce Industry Revenue (Million), by Food and Beverage 2024 & 2032
- Figure 61: Europe Hong Kong E-commerce Industry Revenue Share (%), by Food and Beverage 2024 & 2032
- Figure 62: Europe Hong Kong E-commerce Industry Revenue (Million), by Furniture and Home 2024 & 2032
- Figure 63: Europe Hong Kong E-commerce Industry Revenue Share (%), by Furniture and Home 2024 & 2032
- Figure 64: Europe Hong Kong E-commerce Industry Revenue (Million), by Others (Toys, DIY, Media, etc.) 2024 & 2032
- Figure 65: Europe Hong Kong E-commerce Industry Revenue Share (%), by Others (Toys, DIY, Media, etc.) 2024 & 2032
- Figure 66: Europe Hong Kong E-commerce Industry Revenue (Million), by B2B ecommerce 2024 & 2032
- Figure 67: Europe Hong Kong E-commerce Industry Revenue Share (%), by B2B ecommerce 2024 & 2032
- Figure 68: Europe Hong Kong E-commerce Industry Revenue (Million), by Country 2024 & 2032
- Figure 69: Europe Hong Kong E-commerce Industry Revenue Share (%), by Country 2024 & 2032
- Figure 70: Middle East & Africa Hong Kong E-commerce Industry Revenue (Million), by B2C ecommerce 2024 & 2032
- Figure 71: Middle East & Africa Hong Kong E-commerce Industry Revenue Share (%), by B2C ecommerce 2024 & 2032
- Figure 72: Middle East & Africa Hong Kong E-commerce Industry Revenue (Million), by Market size (GMV) for the period of 2017-2027 2024 & 2032
- Figure 73: Middle East & Africa Hong Kong E-commerce Industry Revenue Share (%), by Market size (GMV) for the period of 2017-2027 2024 & 2032
- Figure 74: Middle East & Africa Hong Kong E-commerce Industry Revenue (Million), by Application 2024 & 2032
- Figure 75: Middle East & Africa Hong Kong E-commerce Industry Revenue Share (%), by Application 2024 & 2032
- Figure 76: Middle East & Africa Hong Kong E-commerce Industry Revenue (Million), by Beauty and Personal Care 2024 & 2032
- Figure 77: Middle East & Africa Hong Kong E-commerce Industry Revenue Share (%), by Beauty and Personal Care 2024 & 2032
- Figure 78: Middle East & Africa Hong Kong E-commerce Industry Revenue (Million), by Consumer Electronics 2024 & 2032
- Figure 79: Middle East & Africa Hong Kong E-commerce Industry Revenue Share (%), by Consumer Electronics 2024 & 2032
- Figure 80: Middle East & Africa Hong Kong E-commerce Industry Revenue (Million), by Fashion and Apparel 2024 & 2032
- Figure 81: Middle East & Africa Hong Kong E-commerce Industry Revenue Share (%), by Fashion and Apparel 2024 & 2032
- Figure 82: Middle East & Africa Hong Kong E-commerce Industry Revenue (Million), by Food and Beverage 2024 & 2032
- Figure 83: Middle East & Africa Hong Kong E-commerce Industry Revenue Share (%), by Food and Beverage 2024 & 2032
- Figure 84: Middle East & Africa Hong Kong E-commerce Industry Revenue (Million), by Furniture and Home 2024 & 2032
- Figure 85: Middle East & Africa Hong Kong E-commerce Industry Revenue Share (%), by Furniture and Home 2024 & 2032
- Figure 86: Middle East & Africa Hong Kong E-commerce Industry Revenue (Million), by Others (Toys, DIY, Media, etc.) 2024 & 2032
- Figure 87: Middle East & Africa Hong Kong E-commerce Industry Revenue Share (%), by Others (Toys, DIY, Media, etc.) 2024 & 2032
- Figure 88: Middle East & Africa Hong Kong E-commerce Industry Revenue (Million), by B2B ecommerce 2024 & 2032
- Figure 89: Middle East & Africa Hong Kong E-commerce Industry Revenue Share (%), by B2B ecommerce 2024 & 2032
- Figure 90: Middle East & Africa Hong Kong E-commerce Industry Revenue (Million), by Country 2024 & 2032
- Figure 91: Middle East & Africa Hong Kong E-commerce Industry Revenue Share (%), by Country 2024 & 2032
- Figure 92: Asia Pacific Hong Kong E-commerce Industry Revenue (Million), by B2C ecommerce 2024 & 2032
- Figure 93: Asia Pacific Hong Kong E-commerce Industry Revenue Share (%), by B2C ecommerce 2024 & 2032
- Figure 94: Asia Pacific Hong Kong E-commerce Industry Revenue (Million), by Market size (GMV) for the period of 2017-2027 2024 & 2032
- Figure 95: Asia Pacific Hong Kong E-commerce Industry Revenue Share (%), by Market size (GMV) for the period of 2017-2027 2024 & 2032
- Figure 96: Asia Pacific Hong Kong E-commerce Industry Revenue (Million), by Application 2024 & 2032
- Figure 97: Asia Pacific Hong Kong E-commerce Industry Revenue Share (%), by Application 2024 & 2032
- Figure 98: Asia Pacific Hong Kong E-commerce Industry Revenue (Million), by Beauty and Personal Care 2024 & 2032
- Figure 99: Asia Pacific Hong Kong E-commerce Industry Revenue Share (%), by Beauty and Personal Care 2024 & 2032
- Figure 100: Asia Pacific Hong Kong E-commerce Industry Revenue (Million), by Consumer Electronics 2024 & 2032
- Figure 101: Asia Pacific Hong Kong E-commerce Industry Revenue Share (%), by Consumer Electronics 2024 & 2032
- Figure 102: Asia Pacific Hong Kong E-commerce Industry Revenue (Million), by Fashion and Apparel 2024 & 2032
- Figure 103: Asia Pacific Hong Kong E-commerce Industry Revenue Share (%), by Fashion and Apparel 2024 & 2032
- Figure 104: Asia Pacific Hong Kong E-commerce Industry Revenue (Million), by Food and Beverage 2024 & 2032
- Figure 105: Asia Pacific Hong Kong E-commerce Industry Revenue Share (%), by Food and Beverage 2024 & 2032
- Figure 106: Asia Pacific Hong Kong E-commerce Industry Revenue (Million), by Furniture and Home 2024 & 2032
- Figure 107: Asia Pacific Hong Kong E-commerce Industry Revenue Share (%), by Furniture and Home 2024 & 2032
- Figure 108: Asia Pacific Hong Kong E-commerce Industry Revenue (Million), by Others (Toys, DIY, Media, etc.) 2024 & 2032
- Figure 109: Asia Pacific Hong Kong E-commerce Industry Revenue Share (%), by Others (Toys, DIY, Media, etc.) 2024 & 2032
- Figure 110: Asia Pacific Hong Kong E-commerce Industry Revenue (Million), by B2B ecommerce 2024 & 2032
- Figure 111: Asia Pacific Hong Kong E-commerce Industry Revenue Share (%), by B2B ecommerce 2024 & 2032
- Figure 112: Asia Pacific Hong Kong E-commerce Industry Revenue (Million), by Country 2024 & 2032
- Figure 113: Asia Pacific Hong Kong E-commerce Industry Revenue Share (%), by Country 2024 & 2032
List of Tables
- Table 1: Global Hong Kong E-commerce Industry Revenue Million Forecast, by Region 2019 & 2032
- Table 2: Global Hong Kong E-commerce Industry Revenue Million Forecast, by B2C ecommerce 2019 & 2032
- Table 3: Global Hong Kong E-commerce Industry Revenue Million Forecast, by Market size (GMV) for the period of 2017-2027 2019 & 2032
- Table 4: Global Hong Kong E-commerce Industry Revenue Million Forecast, by Application 2019 & 2032
- Table 5: Global Hong Kong E-commerce Industry Revenue Million Forecast, by Beauty and Personal Care 2019 & 2032
- Table 6: Global Hong Kong E-commerce Industry Revenue Million Forecast, by Consumer Electronics 2019 & 2032
- Table 7: Global Hong Kong E-commerce Industry Revenue Million Forecast, by Fashion and Apparel 2019 & 2032
- Table 8: Global Hong Kong E-commerce Industry Revenue Million Forecast, by Food and Beverage 2019 & 2032
- Table 9: Global Hong Kong E-commerce Industry Revenue Million Forecast, by Furniture and Home 2019 & 2032
- Table 10: Global Hong Kong E-commerce Industry Revenue Million Forecast, by Others (Toys, DIY, Media, etc.) 2019 & 2032
- Table 11: Global Hong Kong E-commerce Industry Revenue Million Forecast, by B2B ecommerce 2019 & 2032
- Table 12: Global Hong Kong E-commerce Industry Revenue Million Forecast, by Region 2019 & 2032
- Table 13: Global Hong Kong E-commerce Industry Revenue Million Forecast, by Country 2019 & 2032
- Table 14: Global Hong Kong E-commerce Industry Revenue Million Forecast, by B2C ecommerce 2019 & 2032
- Table 15: Global Hong Kong E-commerce Industry Revenue Million Forecast, by Market size (GMV) for the period of 2017-2027 2019 & 2032
- Table 16: Global Hong Kong E-commerce Industry Revenue Million Forecast, by Application 2019 & 2032
- Table 17: Global Hong Kong E-commerce Industry Revenue Million Forecast, by Beauty and Personal Care 2019 & 2032
- Table 18: Global Hong Kong E-commerce Industry Revenue Million Forecast, by Consumer Electronics 2019 & 2032
- Table 19: Global Hong Kong E-commerce Industry Revenue Million Forecast, by Fashion and Apparel 2019 & 2032
- Table 20: Global Hong Kong E-commerce Industry Revenue Million Forecast, by Food and Beverage 2019 & 2032
- Table 21: Global Hong Kong E-commerce Industry Revenue Million Forecast, by Furniture and Home 2019 & 2032
- Table 22: Global Hong Kong E-commerce Industry Revenue Million Forecast, by Others (Toys, DIY, Media, etc.) 2019 & 2032
- Table 23: Global Hong Kong E-commerce Industry Revenue Million Forecast, by B2B ecommerce 2019 & 2032
- Table 24: Global Hong Kong E-commerce Industry Revenue Million Forecast, by Country 2019 & 2032
- Table 25: United States Hong Kong E-commerce Industry Revenue (Million) Forecast, by Application 2019 & 2032
- Table 26: Canada Hong Kong E-commerce Industry Revenue (Million) Forecast, by Application 2019 & 2032
- Table 27: Mexico Hong Kong E-commerce Industry Revenue (Million) Forecast, by Application 2019 & 2032
- Table 28: Global Hong Kong E-commerce Industry Revenue Million Forecast, by B2C ecommerce 2019 & 2032
- Table 29: Global Hong Kong E-commerce Industry Revenue Million Forecast, by Market size (GMV) for the period of 2017-2027 2019 & 2032
- Table 30: Global Hong Kong E-commerce Industry Revenue Million Forecast, by Application 2019 & 2032
- Table 31: Global Hong Kong E-commerce Industry Revenue Million Forecast, by Beauty and Personal Care 2019 & 2032
- Table 32: Global Hong Kong E-commerce Industry Revenue Million Forecast, by Consumer Electronics 2019 & 2032
- Table 33: Global Hong Kong E-commerce Industry Revenue Million Forecast, by Fashion and Apparel 2019 & 2032
- Table 34: Global Hong Kong E-commerce Industry Revenue Million Forecast, by Food and Beverage 2019 & 2032
- Table 35: Global Hong Kong E-commerce Industry Revenue Million Forecast, by Furniture and Home 2019 & 2032
- Table 36: Global Hong Kong E-commerce Industry Revenue Million Forecast, by Others (Toys, DIY, Media, etc.) 2019 & 2032
- Table 37: Global Hong Kong E-commerce Industry Revenue Million Forecast, by B2B ecommerce 2019 & 2032
- Table 38: Global Hong Kong E-commerce Industry Revenue Million Forecast, by Country 2019 & 2032
- Table 39: Brazil Hong Kong E-commerce Industry Revenue (Million) Forecast, by Application 2019 & 2032
- Table 40: Argentina Hong Kong E-commerce Industry Revenue (Million) Forecast, by Application 2019 & 2032
- Table 41: Rest of South America Hong Kong E-commerce Industry Revenue (Million) Forecast, by Application 2019 & 2032
- Table 42: Global Hong Kong E-commerce Industry Revenue Million Forecast, by B2C ecommerce 2019 & 2032
- Table 43: Global Hong Kong E-commerce Industry Revenue Million Forecast, by Market size (GMV) for the period of 2017-2027 2019 & 2032
- Table 44: Global Hong Kong E-commerce Industry Revenue Million Forecast, by Application 2019 & 2032
- Table 45: Global Hong Kong E-commerce Industry Revenue Million Forecast, by Beauty and Personal Care 2019 & 2032
- Table 46: Global Hong Kong E-commerce Industry Revenue Million Forecast, by Consumer Electronics 2019 & 2032
- Table 47: Global Hong Kong E-commerce Industry Revenue Million Forecast, by Fashion and Apparel 2019 & 2032
- Table 48: Global Hong Kong E-commerce Industry Revenue Million Forecast, by Food and Beverage 2019 & 2032
- Table 49: Global Hong Kong E-commerce Industry Revenue Million Forecast, by Furniture and Home 2019 & 2032
- Table 50: Global Hong Kong E-commerce Industry Revenue Million Forecast, by Others (Toys, DIY, Media, etc.) 2019 & 2032
- Table 51: Global Hong Kong E-commerce Industry Revenue Million Forecast, by B2B ecommerce 2019 & 2032
- Table 52: Global Hong Kong E-commerce Industry Revenue Million Forecast, by Country 2019 & 2032
- Table 53: United Kingdom Hong Kong E-commerce Industry Revenue (Million) Forecast, by Application 2019 & 2032
- Table 54: Germany Hong Kong E-commerce Industry Revenue (Million) Forecast, by Application 2019 & 2032
- Table 55: France Hong Kong E-commerce Industry Revenue (Million) Forecast, by Application 2019 & 2032
- Table 56: Italy Hong Kong E-commerce Industry Revenue (Million) Forecast, by Application 2019 & 2032
- Table 57: Spain Hong Kong E-commerce Industry Revenue (Million) Forecast, by Application 2019 & 2032
- Table 58: Russia Hong Kong E-commerce Industry Revenue (Million) Forecast, by Application 2019 & 2032
- Table 59: Benelux Hong Kong E-commerce Industry Revenue (Million) Forecast, by Application 2019 & 2032
- Table 60: Nordics Hong Kong E-commerce Industry Revenue (Million) Forecast, by Application 2019 & 2032
- Table 61: Rest of Europe Hong Kong E-commerce Industry Revenue (Million) Forecast, by Application 2019 & 2032
- Table 62: Global Hong Kong E-commerce Industry Revenue Million Forecast, by B2C ecommerce 2019 & 2032
- Table 63: Global Hong Kong E-commerce Industry Revenue Million Forecast, by Market size (GMV) for the period of 2017-2027 2019 & 2032
- Table 64: Global Hong Kong E-commerce Industry Revenue Million Forecast, by Application 2019 & 2032
- Table 65: Global Hong Kong E-commerce Industry Revenue Million Forecast, by Beauty and Personal Care 2019 & 2032
- Table 66: Global Hong Kong E-commerce Industry Revenue Million Forecast, by Consumer Electronics 2019 & 2032
- Table 67: Global Hong Kong E-commerce Industry Revenue Million Forecast, by Fashion and Apparel 2019 & 2032
- Table 68: Global Hong Kong E-commerce Industry Revenue Million Forecast, by Food and Beverage 2019 & 2032
- Table 69: Global Hong Kong E-commerce Industry Revenue Million Forecast, by Furniture and Home 2019 & 2032
- Table 70: Global Hong Kong E-commerce Industry Revenue Million Forecast, by Others (Toys, DIY, Media, etc.) 2019 & 2032
- Table 71: Global Hong Kong E-commerce Industry Revenue Million Forecast, by B2B ecommerce 2019 & 2032
- Table 72: Global Hong Kong E-commerce Industry Revenue Million Forecast, by Country 2019 & 2032
- Table 73: Turkey Hong Kong E-commerce Industry Revenue (Million) Forecast, by Application 2019 & 2032
- Table 74: Israel Hong Kong E-commerce Industry Revenue (Million) Forecast, by Application 2019 & 2032
- Table 75: GCC Hong Kong E-commerce Industry Revenue (Million) Forecast, by Application 2019 & 2032
- Table 76: North Africa Hong Kong E-commerce Industry Revenue (Million) Forecast, by Application 2019 & 2032
- Table 77: South Africa Hong Kong E-commerce Industry Revenue (Million) Forecast, by Application 2019 & 2032
- Table 78: Rest of Middle East & Africa Hong Kong E-commerce Industry Revenue (Million) Forecast, by Application 2019 & 2032
- Table 79: Global Hong Kong E-commerce Industry Revenue Million Forecast, by B2C ecommerce 2019 & 2032
- Table 80: Global Hong Kong E-commerce Industry Revenue Million Forecast, by Market size (GMV) for the period of 2017-2027 2019 & 2032
- Table 81: Global Hong Kong E-commerce Industry Revenue Million Forecast, by Application 2019 & 2032
- Table 82: Global Hong Kong E-commerce Industry Revenue Million Forecast, by Beauty and Personal Care 2019 & 2032
- Table 83: Global Hong Kong E-commerce Industry Revenue Million Forecast, by Consumer Electronics 2019 & 2032
- Table 84: Global Hong Kong E-commerce Industry Revenue Million Forecast, by Fashion and Apparel 2019 & 2032
- Table 85: Global Hong Kong E-commerce Industry Revenue Million Forecast, by Food and Beverage 2019 & 2032
- Table 86: Global Hong Kong E-commerce Industry Revenue Million Forecast, by Furniture and Home 2019 & 2032
- Table 87: Global Hong Kong E-commerce Industry Revenue Million Forecast, by Others (Toys, DIY, Media, etc.) 2019 & 2032
- Table 88: Global Hong Kong E-commerce Industry Revenue Million Forecast, by B2B ecommerce 2019 & 2032
- Table 89: Global Hong Kong E-commerce Industry Revenue Million Forecast, by Country 2019 & 2032
- Table 90: China Hong Kong E-commerce Industry Revenue (Million) Forecast, by Application 2019 & 2032
- Table 91: India Hong Kong E-commerce Industry Revenue (Million) Forecast, by Application 2019 & 2032
- Table 92: Japan Hong Kong E-commerce Industry Revenue (Million) Forecast, by Application 2019 & 2032
- Table 93: South Korea Hong Kong E-commerce Industry Revenue (Million) Forecast, by Application 2019 & 2032
- Table 94: ASEAN Hong Kong E-commerce Industry Revenue (Million) Forecast, by Application 2019 & 2032
- Table 95: Oceania Hong Kong E-commerce Industry Revenue (Million) Forecast, by Application 2019 & 2032
- Table 96: Rest of Asia Pacific Hong Kong E-commerce Industry Revenue (Million) Forecast, by Application 2019 & 2032
Frequently Asked Questions
1. What is the projected Compound Annual Growth Rate (CAGR) of the Hong Kong E-commerce Industry?
The projected CAGR is approximately > 8.70%.
2. Which companies are prominent players in the Hong Kong E-commerce Industry?
Key companies in the market include JD com Inc, PARKnSHOP (HK) Limited, Carousell Group*List Not Exhaustive, MUJI (Hong Kong) Co Ltd, Price Guide Sdn Bhd, Amazon com Inc, Alibaba Group, Hong Kong TV Shopping Network Limited, eBay Inc, WeChat Pay Hong Kong Limited.
3. What are the main segments of the Hong Kong E-commerce Industry?
The market segments include B2C ecommerce, Market size (GMV) for the period of 2017-2027, Application, Beauty and Personal Care, Consumer Electronics, Fashion and Apparel, Food and Beverage, Furniture and Home, Others (Toys, DIY, Media, etc.), B2B ecommerce.
4. Can you provide details about the market size?
The market size is estimated to be USD XX Million as of 2022.
5. What are some drivers contributing to market growth?
Increase in adoption of digitalization; Adoption of Omnichannel Innovative Solutions.
6. What are the notable trends driving market growth?
Increase in Internet Penetration Across the Country is Fueling the Growth of the Market.
7. Are there any restraints impacting market growth?
High Initial Cost of Installation.
8. Can you provide examples of recent developments in the market?
May 2022 - YesAsia, a global online retailer, announced a partnership with Geek+, an autonomous robots company, to build YesAsia's first smart warehouse at Goodman Interlink, located in Tsing Yi, Hong Kong.
9. What pricing options are available for accessing the report?
Pricing options include single-user, multi-user, and enterprise licenses priced at USD 3800, USD 4500, and USD 5800 respectively.
10. Is the market size provided in terms of value or volume?
The market size is provided in terms of value, measured in Million.
11. Are there any specific market keywords associated with the report?
Yes, the market keyword associated with the report is "Hong Kong E-commerce Industry," which aids in identifying and referencing the specific market segment covered.
12. How do I determine which pricing option suits my needs best?
The pricing options vary based on user requirements and access needs. Individual users may opt for single-user licenses, while businesses requiring broader access may choose multi-user or enterprise licenses for cost-effective access to the report.
13. Are there any additional resources or data provided in the Hong Kong E-commerce Industry report?
While the report offers comprehensive insights, it's advisable to review the specific contents or supplementary materials provided to ascertain if additional resources or data are available.
14. How can I stay updated on further developments or reports in the Hong Kong E-commerce Industry?
To stay informed about further developments, trends, and reports in the Hong Kong E-commerce Industry, consider subscribing to industry newsletters, following relevant companies and organizations, or regularly checking reputable industry news sources and publications.
Methodology
Step 1 - Identification of Relevant Samples Size from Population Database


Step 2 - Approaches for Defining Global Market Size (Value, Volume* & Price*)

Note*: In applicable scenarios
Step 3 - Data Sources
Primary Research
- Web Analytics
- Survey Reports
- Research Institute
- Latest Research Reports
- Opinion Leaders
Secondary Research
- Annual Reports
- White Paper
- Latest Press Release
- Industry Association
- Paid Database
- Investor Presentations

Step 4 - Data Triangulation
Involves using different sources of information in order to increase the validity of a study
These sources are likely to be stakeholders in a program - participants, other researchers, program staff, other community members, and so on.
Then we put all data in single framework & apply various statistical tools to find out the dynamic on the market.
During the analysis stage, feedback from the stakeholder groups would be compared to determine areas of agreement as well as areas of divergence
