

Key Insights
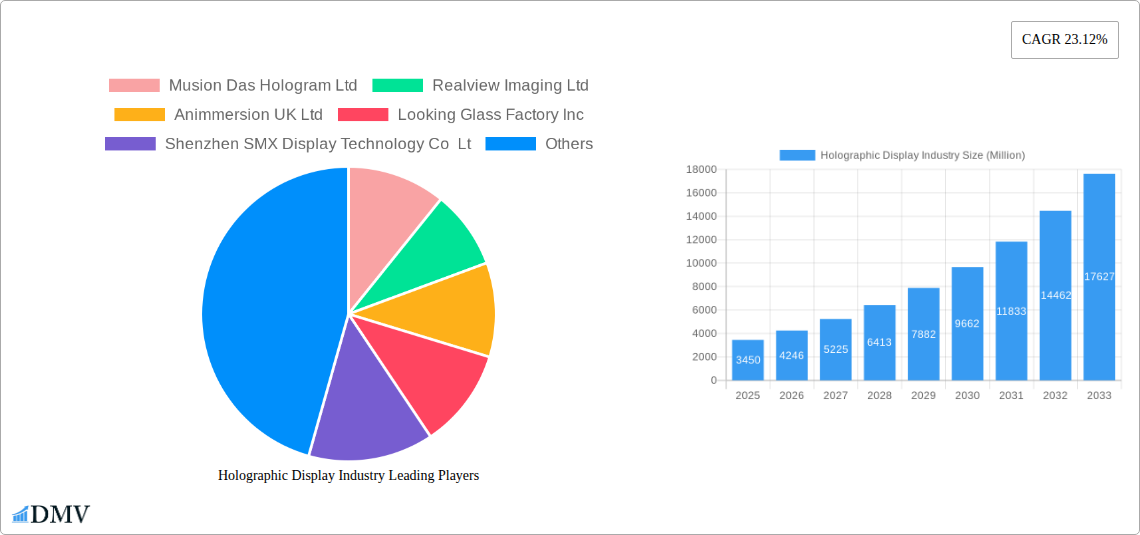
The holographic display market is experiencing significant growth, projected to reach $3.45 billion in 2025 and exhibiting a Compound Annual Growth Rate (CAGR) of 23.12% from 2025 to 2033. This expansion is fueled by several key drivers. The increasing adoption of holographic displays in consumer electronics, particularly smartphones and tablets, is a major contributor. Furthermore, the entertainment and retail sectors are embracing holographic technology for immersive experiences, driving demand. Advances in display technology, leading to more affordable and higher-resolution holographic projections, are also contributing to market growth. The healthcare industry is exploring applications in medical imaging and training, while the automotive sector is investigating the use of holographic head-up displays for enhanced driver assistance. However, the market faces challenges. The high cost of production and limited availability of skilled professionals remain constraints on wider adoption. Furthermore, technological limitations, such as limited viewing angles and the need for specialized hardware, continue to hinder market penetration. Despite these challenges, the innovative potential of holographic displays across numerous sectors points towards substantial future growth.
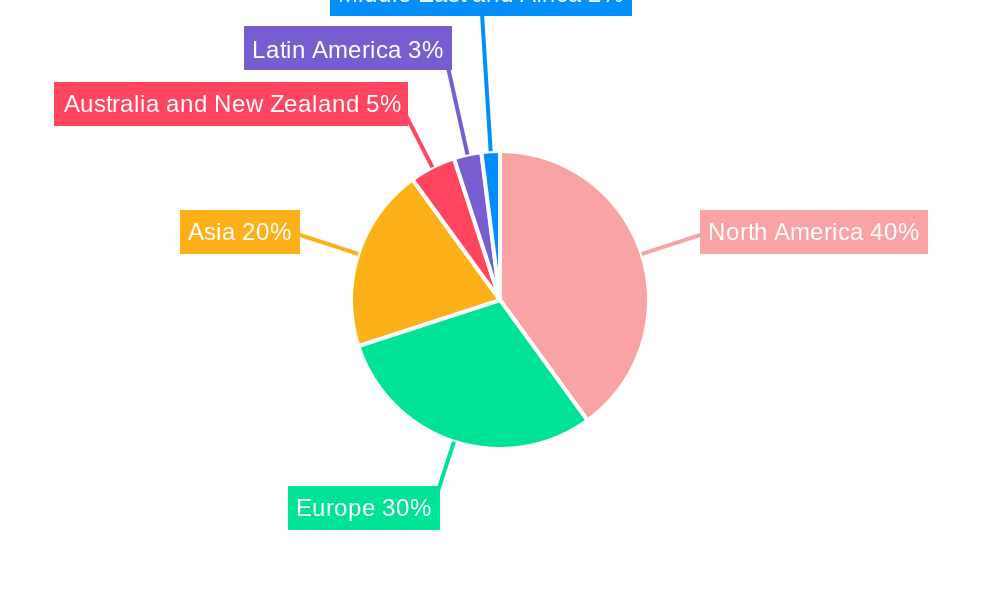
The regional distribution of the holographic display market likely mirrors global technology adoption trends. North America, with its advanced technological infrastructure and early adoption of new technologies, is expected to hold a substantial market share. Europe follows closely, driven by similar factors. Asia, particularly China and other rapidly developing economies, is poised for significant growth owing to increasing disposable income and expanding technological capabilities. Australia and New Zealand, alongside Latin America and the Middle East and Africa, while smaller markets, are expected to exhibit growth driven by increased consumer demand and government investments in technological infrastructure. The competitive landscape is characterized by a mix of established players and emerging innovative companies, leading to dynamic market competition and ongoing technological advancements. The industry is actively involved in research and development to enhance image quality, reduce costs, and expand application possibilities.
Holographic Display Industry: A Comprehensive Market Report (2019-2033)
This insightful report provides a comprehensive analysis of the holographic display industry, projecting a market valuation of $XX Million by 2033. It delves into market dynamics, technological advancements, key players, and future growth prospects, offering crucial insights for stakeholders across the value chain. The report covers the period from 2019 to 2033, with 2025 as the base and estimated year.
Holographic Display Industry Market Composition & Trends
This section examines the current state of the holographic display market, analyzing market concentration, innovation drivers, regulatory landscapes, substitute technologies, end-user profiles, and merger & acquisition (M&A) activities. The global holographic display market exhibits a moderately fragmented landscape, with no single company commanding a dominant share. However, key players like Musion Das Hologram Ltd, Realview Imaging Ltd, and others are actively shaping the market through continuous innovation.
- Market Share Distribution (2024): Musion Das Hologram Ltd (15%), Realview Imaging Ltd (10%), Others (75%). These figures are estimates based on available data. Further detailed market share breakdown is provided in the full report.
- M&A Activity (2019-2024): A total of XX M&A deals were recorded during this period, with a combined value of $XX Million. The report details these transactions and analyzes their impact on market consolidation and technological advancement.
- Innovation Catalysts: Advancements in laser technology, improved display materials, and sophisticated software algorithms are driving innovation in the holographic display market.
- Regulatory Landscape: Varying regulatory standards across different regions pose challenges and opportunities for market expansion. The report details these regional differences.
- Substitute Products: While currently limited, technologies such as advanced 3D displays and augmented reality (AR) pose potential competition. The report assesses the degree of this competitive pressure.
Holographic Display Industry Industry Evolution
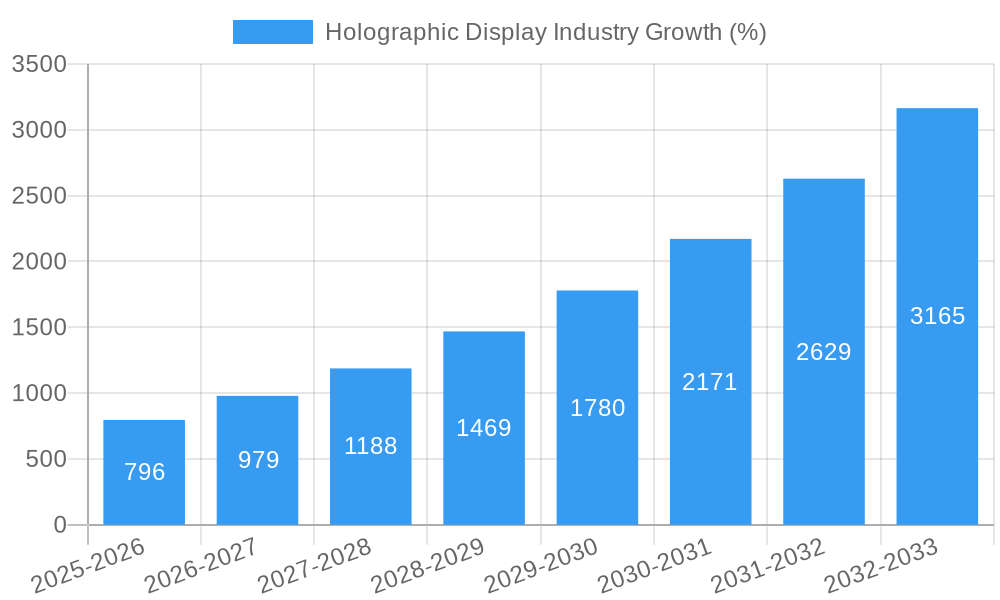
The holographic display industry has witnessed significant growth during the historical period (2019-2024), experiencing a Compound Annual Growth Rate (CAGR) of XX%. This robust growth is attributed to several key factors, including the rising demand for immersive experiences across various sectors, technological advancements leading to improved image quality and reduced costs, and expanding applications in diverse end-user verticals. The forecast period (2025-2033) anticipates a maintained high CAGR of XX%, driven primarily by increasing adoption in the automotive and retail sectors. Specific adoption metrics for each sector are presented in detail within the report. Technological advancements, like improved resolution and color accuracy, along with decreasing manufacturing costs, are key drivers contributing to the accelerated adoption rates. Changes in consumer preferences, a rising preference for interactive and engaging visual experiences, are also propelling the market's trajectory.
Leading Regions, Countries, or Segments in Holographic Display Industry
The report identifies North America as the leading region in the holographic display market. This dominance stems from a confluence of factors including:
- High Investment in R&D: Significant investments from both private and public sectors fuel technological innovation and market expansion within North America.
- Strong Presence of Key Players: Many leading holographic display companies are headquartered or have significant operations in North America, further strengthening the regional dominance.
- Early Adoption in Consumer Electronics: The consumer electronics industry in North America has demonstrated early adoption and integration of holographic technologies.
However, significant growth potential is seen in the Asia-Pacific region due to rapid technological advancements and the substantial manufacturing base. Detailed analysis of each region's and segment's contribution is included within the report, which also covers the following end-user verticals:
- Consumer Electronics: Growing demand for high-quality home entertainment systems and mobile devices.
- Retail: Utilizing holograms for enhanced product displays and advertising.
- Media and Entertainment: Expanding use in live performances, concerts, and interactive media.
- Military and Defense: Applications for simulations, training, and advanced displays.
- Healthcare: Utilization in medical imaging, surgical planning, and patient education.
- Automotive: Integration into vehicle navigation systems and infotainment systems.
Holographic Display Industry Product Innovations
Recent product innovations focus on enhancing resolution, brightness, and color accuracy, enabling more realistic and engaging holographic experiences. Advancements in compact display technologies and improved software solutions contribute to cost reduction and easier integration across various applications. Unique selling propositions include improved portability, ease of use, and enhanced visual fidelity. The evolution towards higher frame rates and reduced latency continues to drive product innovation.
Propelling Factors for Holographic Display Industry Growth
Several factors are driving growth in the holographic display industry:
- Technological Advancements: Continuous improvements in laser technology, display materials, and processing power are reducing costs and enhancing display quality.
- Economic Growth: Rising disposable incomes in developing economies fuel demand for advanced consumer electronics and entertainment products.
- Government Support: Government initiatives promoting technological innovation and investments in R&D contribute significantly. Examples include specific programs supporting the development of advanced display technologies.
Obstacles in the Holographic Display Industry Market
Despite the considerable growth potential, some challenges remain:
- High Production Costs: The relatively high cost of manufacturing holographic displays currently limits widespread adoption.
- Technological Limitations: Achieving perfect realism and achieving high resolutions remains a technical hurdle.
- Supply Chain Disruptions: Global supply chain instability can impact the production and availability of necessary components.
Future Opportunities in Holographic Display Industry
Significant opportunities exist in untapped markets like education, healthcare and advanced manufacturing. The integration of holographic technology with AI and machine learning could create new applications for business and consumer use, such as interactive holographic training simulations or customized retail experiences. The development of more compact, energy-efficient, and cost-effective display technologies will further unlock market expansion.
Major Players in the Holographic Display Industry Ecosystem
- Musion Das Hologram Ltd
- Realview Imaging Ltd
- Animmersion UK Ltd
- Looking Glass Factory Inc
- Shenzhen SMX Display Technology Co Lt
- Kino-mo Limited (HYPERVSN)
- RealFiction Holding AB
- Provision Holding Inc
Key Developments in Holographic Display Industry Industry
- January 2024: Hyundai Mobis unveils a transparent holographic display for next-generation vehicles, showcasing innovative rollable and swivel displays. This marks a significant advancement in automotive infotainment.
- January 2024: ARHT Media Inc. partners with a luxury retail brand, deploying ARHT Capsule hologram displays across five global headquarters. This signifies the growing adoption of holographic technology in retail for enhanced brand experiences and employee training.
Strategic Holographic Display Industry Market Forecast
The holographic display market is poised for substantial growth over the forecast period (2025-2033). Continued technological advancements, decreasing production costs, and increasing adoption across various sectors will be key growth drivers. New applications, particularly in fields such as healthcare, education, and the metaverse, present significant untapped potential. The market is expected to experience a sustained period of expansion, driven by a convergence of technological innovation and growing consumer demand for immersive experiences.
Holographic Display Industry Segmentation
-
1. End-user Verticals
- 1.1. Consumer Electronics
- 1.2. Retail
- 1.3. Media and Entertainment
- 1.4. Military and Defense
- 1.5. Healthcare
- 1.6. Automotive
- 1.7. Other End-user Verticals
Holographic Display Industry Segmentation By Geography
- 1. North America
- 2. Europe
- 3. Asia
- 4. Australia and New Zealand
- 5. Latin America
- 6. Middle East and Africa
Holographic Display Industry REPORT HIGHLIGHTS
| Aspects | Details |
|---|---|
| Study Period | 2019-2033 |
| Base Year | 2024 |
| Estimated Year | 2025 |
| Forecast Period | 2025-2033 |
| Historical Period | 2019-2024 |
| Growth Rate | CAGR of 23.12% from 2019-2033 |
| Segmentation |
|
Table of Contents
- 1. Introduction
- 1.1. Research Scope
- 1.2. Market Segmentation
- 1.3. Research Methodology
- 1.4. Definitions and Assumptions
- 2. Executive Summary
- 2.1. Introduction
- 3. Market Dynamics
- 3.1. Introduction
- 3.2. Market Drivers
- 3.2.1. Increasing Investments in 3D Technology; Advancements in Screenless Displays
- 3.3. Market Restrains
- 3.3.1. High Cost of Assembling Holographic Display Devices; Presence of Substitute Display Products
- 3.4. Market Trends
- 3.4.1. Automotive Segment is Expected to Witness Significant Growth
- 4. Market Factor Analysis
- 4.1. Porters Five Forces
- 4.2. Supply/Value Chain
- 4.3. PESTEL analysis
- 4.4. Market Entropy
- 4.5. Patent/Trademark Analysis
- 5. Global Holographic Display Industry Analysis, Insights and Forecast, 2019-2031
- 5.1. Market Analysis, Insights and Forecast - by End-user Verticals
- 5.1.1. Consumer Electronics
- 5.1.2. Retail
- 5.1.3. Media and Entertainment
- 5.1.4. Military and Defense
- 5.1.5. Healthcare
- 5.1.6. Automotive
- 5.1.7. Other End-user Verticals
- 5.2. Market Analysis, Insights and Forecast - by Region
- 5.2.1. North America
- 5.2.2. Europe
- 5.2.3. Asia
- 5.2.4. Australia and New Zealand
- 5.2.5. Latin America
- 5.2.6. Middle East and Africa
- 5.1. Market Analysis, Insights and Forecast - by End-user Verticals
- 6. North America Holographic Display Industry Analysis, Insights and Forecast, 2019-2031
- 6.1. Market Analysis, Insights and Forecast - by End-user Verticals
- 6.1.1. Consumer Electronics
- 6.1.2. Retail
- 6.1.3. Media and Entertainment
- 6.1.4. Military and Defense
- 6.1.5. Healthcare
- 6.1.6. Automotive
- 6.1.7. Other End-user Verticals
- 6.1. Market Analysis, Insights and Forecast - by End-user Verticals
- 7. Europe Holographic Display Industry Analysis, Insights and Forecast, 2019-2031
- 7.1. Market Analysis, Insights and Forecast - by End-user Verticals
- 7.1.1. Consumer Electronics
- 7.1.2. Retail
- 7.1.3. Media and Entertainment
- 7.1.4. Military and Defense
- 7.1.5. Healthcare
- 7.1.6. Automotive
- 7.1.7. Other End-user Verticals
- 7.1. Market Analysis, Insights and Forecast - by End-user Verticals
- 8. Asia Holographic Display Industry Analysis, Insights and Forecast, 2019-2031
- 8.1. Market Analysis, Insights and Forecast - by End-user Verticals
- 8.1.1. Consumer Electronics
- 8.1.2. Retail
- 8.1.3. Media and Entertainment
- 8.1.4. Military and Defense
- 8.1.5. Healthcare
- 8.1.6. Automotive
- 8.1.7. Other End-user Verticals
- 8.1. Market Analysis, Insights and Forecast - by End-user Verticals
- 9. Australia and New Zealand Holographic Display Industry Analysis, Insights and Forecast, 2019-2031
- 9.1. Market Analysis, Insights and Forecast - by End-user Verticals
- 9.1.1. Consumer Electronics
- 9.1.2. Retail
- 9.1.3. Media and Entertainment
- 9.1.4. Military and Defense
- 9.1.5. Healthcare
- 9.1.6. Automotive
- 9.1.7. Other End-user Verticals
- 9.1. Market Analysis, Insights and Forecast - by End-user Verticals
- 10. Latin America Holographic Display Industry Analysis, Insights and Forecast, 2019-2031
- 10.1. Market Analysis, Insights and Forecast - by End-user Verticals
- 10.1.1. Consumer Electronics
- 10.1.2. Retail
- 10.1.3. Media and Entertainment
- 10.1.4. Military and Defense
- 10.1.5. Healthcare
- 10.1.6. Automotive
- 10.1.7. Other End-user Verticals
- 10.1. Market Analysis, Insights and Forecast - by End-user Verticals
- 11. Middle East and Africa Holographic Display Industry Analysis, Insights and Forecast, 2019-2031
- 11.1. Market Analysis, Insights and Forecast - by End-user Verticals
- 11.1.1. Consumer Electronics
- 11.1.2. Retail
- 11.1.3. Media and Entertainment
- 11.1.4. Military and Defense
- 11.1.5. Healthcare
- 11.1.6. Automotive
- 11.1.7. Other End-user Verticals
- 11.1. Market Analysis, Insights and Forecast - by End-user Verticals
- 12. North America Holographic Display Industry Analysis, Insights and Forecast, 2019-2031
- 12.1. Market Analysis, Insights and Forecast - By Country/Sub-region
- 12.1.1.
- 13. Europe Holographic Display Industry Analysis, Insights and Forecast, 2019-2031
- 13.1. Market Analysis, Insights and Forecast - By Country/Sub-region
- 13.1.1.
- 14. Asia Holographic Display Industry Analysis, Insights and Forecast, 2019-2031
- 14.1. Market Analysis, Insights and Forecast - By Country/Sub-region
- 14.1.1.
- 15. Australia and New Zealand Holographic Display Industry Analysis, Insights and Forecast, 2019-2031
- 15.1. Market Analysis, Insights and Forecast - By Country/Sub-region
- 15.1.1.
- 16. Latin America Holographic Display Industry Analysis, Insights and Forecast, 2019-2031
- 16.1. Market Analysis, Insights and Forecast - By Country/Sub-region
- 16.1.1.
- 17. Middle East and Africa Holographic Display Industry Analysis, Insights and Forecast, 2019-2031
- 17.1. Market Analysis, Insights and Forecast - By Country/Sub-region
- 17.1.1.
- 18. Competitive Analysis
- 18.1. Global Market Share Analysis 2024
- 18.2. Company Profiles
- 18.2.1 Musion Das Hologram Ltd
- 18.2.1.1. Overview
- 18.2.1.2. Products
- 18.2.1.3. SWOT Analysis
- 18.2.1.4. Recent Developments
- 18.2.1.5. Financials (Based on Availability)
- 18.2.2 Realview Imaging Ltd
- 18.2.2.1. Overview
- 18.2.2.2. Products
- 18.2.2.3. SWOT Analysis
- 18.2.2.4. Recent Developments
- 18.2.2.5. Financials (Based on Availability)
- 18.2.3 Animmersion UK Ltd
- 18.2.3.1. Overview
- 18.2.3.2. Products
- 18.2.3.3. SWOT Analysis
- 18.2.3.4. Recent Developments
- 18.2.3.5. Financials (Based on Availability)
- 18.2.4 Looking Glass Factory Inc
- 18.2.4.1. Overview
- 18.2.4.2. Products
- 18.2.4.3. SWOT Analysis
- 18.2.4.4. Recent Developments
- 18.2.4.5. Financials (Based on Availability)
- 18.2.5 Shenzhen SMX Display Technology Co Lt
- 18.2.5.1. Overview
- 18.2.5.2. Products
- 18.2.5.3. SWOT Analysis
- 18.2.5.4. Recent Developments
- 18.2.5.5. Financials (Based on Availability)
- 18.2.6 Kino-mo Limited (HYPERVSN)
- 18.2.6.1. Overview
- 18.2.6.2. Products
- 18.2.6.3. SWOT Analysis
- 18.2.6.4. Recent Developments
- 18.2.6.5. Financials (Based on Availability)
- 18.2.7 RealFiction Holding AB
- 18.2.7.1. Overview
- 18.2.7.2. Products
- 18.2.7.3. SWOT Analysis
- 18.2.7.4. Recent Developments
- 18.2.7.5. Financials (Based on Availability)
- 18.2.8 Provision Holding Inc
- 18.2.8.1. Overview
- 18.2.8.2. Products
- 18.2.8.3. SWOT Analysis
- 18.2.8.4. Recent Developments
- 18.2.8.5. Financials (Based on Availability)
- 18.2.1 Musion Das Hologram Ltd
List of Figures
- Figure 1: Global Holographic Display Industry Revenue Breakdown (Million, %) by Region 2024 & 2032
- Figure 2: North America Holographic Display Industry Revenue (Million), by Country 2024 & 2032
- Figure 3: North America Holographic Display Industry Revenue Share (%), by Country 2024 & 2032
- Figure 4: Europe Holographic Display Industry Revenue (Million), by Country 2024 & 2032
- Figure 5: Europe Holographic Display Industry Revenue Share (%), by Country 2024 & 2032
- Figure 6: Asia Holographic Display Industry Revenue (Million), by Country 2024 & 2032
- Figure 7: Asia Holographic Display Industry Revenue Share (%), by Country 2024 & 2032
- Figure 8: Australia and New Zealand Holographic Display Industry Revenue (Million), by Country 2024 & 2032
- Figure 9: Australia and New Zealand Holographic Display Industry Revenue Share (%), by Country 2024 & 2032
- Figure 10: Latin America Holographic Display Industry Revenue (Million), by Country 2024 & 2032
- Figure 11: Latin America Holographic Display Industry Revenue Share (%), by Country 2024 & 2032
- Figure 12: Middle East and Africa Holographic Display Industry Revenue (Million), by Country 2024 & 2032
- Figure 13: Middle East and Africa Holographic Display Industry Revenue Share (%), by Country 2024 & 2032
- Figure 14: North America Holographic Display Industry Revenue (Million), by End-user Verticals 2024 & 2032
- Figure 15: North America Holographic Display Industry Revenue Share (%), by End-user Verticals 2024 & 2032
- Figure 16: North America Holographic Display Industry Revenue (Million), by Country 2024 & 2032
- Figure 17: North America Holographic Display Industry Revenue Share (%), by Country 2024 & 2032
- Figure 18: Europe Holographic Display Industry Revenue (Million), by End-user Verticals 2024 & 2032
- Figure 19: Europe Holographic Display Industry Revenue Share (%), by End-user Verticals 2024 & 2032
- Figure 20: Europe Holographic Display Industry Revenue (Million), by Country 2024 & 2032
- Figure 21: Europe Holographic Display Industry Revenue Share (%), by Country 2024 & 2032
- Figure 22: Asia Holographic Display Industry Revenue (Million), by End-user Verticals 2024 & 2032
- Figure 23: Asia Holographic Display Industry Revenue Share (%), by End-user Verticals 2024 & 2032
- Figure 24: Asia Holographic Display Industry Revenue (Million), by Country 2024 & 2032
- Figure 25: Asia Holographic Display Industry Revenue Share (%), by Country 2024 & 2032
- Figure 26: Australia and New Zealand Holographic Display Industry Revenue (Million), by End-user Verticals 2024 & 2032
- Figure 27: Australia and New Zealand Holographic Display Industry Revenue Share (%), by End-user Verticals 2024 & 2032
- Figure 28: Australia and New Zealand Holographic Display Industry Revenue (Million), by Country 2024 & 2032
- Figure 29: Australia and New Zealand Holographic Display Industry Revenue Share (%), by Country 2024 & 2032
- Figure 30: Latin America Holographic Display Industry Revenue (Million), by End-user Verticals 2024 & 2032
- Figure 31: Latin America Holographic Display Industry Revenue Share (%), by End-user Verticals 2024 & 2032
- Figure 32: Latin America Holographic Display Industry Revenue (Million), by Country 2024 & 2032
- Figure 33: Latin America Holographic Display Industry Revenue Share (%), by Country 2024 & 2032
- Figure 34: Middle East and Africa Holographic Display Industry Revenue (Million), by End-user Verticals 2024 & 2032
- Figure 35: Middle East and Africa Holographic Display Industry Revenue Share (%), by End-user Verticals 2024 & 2032
- Figure 36: Middle East and Africa Holographic Display Industry Revenue (Million), by Country 2024 & 2032
- Figure 37: Middle East and Africa Holographic Display Industry Revenue Share (%), by Country 2024 & 2032
List of Tables
- Table 1: Global Holographic Display Industry Revenue Million Forecast, by Region 2019 & 2032
- Table 2: Global Holographic Display Industry Revenue Million Forecast, by End-user Verticals 2019 & 2032
- Table 3: Global Holographic Display Industry Revenue Million Forecast, by Region 2019 & 2032
- Table 4: Global Holographic Display Industry Revenue Million Forecast, by Country 2019 & 2032
- Table 5: Holographic Display Industry Revenue (Million) Forecast, by Application 2019 & 2032
- Table 6: Global Holographic Display Industry Revenue Million Forecast, by Country 2019 & 2032
- Table 7: Holographic Display Industry Revenue (Million) Forecast, by Application 2019 & 2032
- Table 8: Global Holographic Display Industry Revenue Million Forecast, by Country 2019 & 2032
- Table 9: Holographic Display Industry Revenue (Million) Forecast, by Application 2019 & 2032
- Table 10: Global Holographic Display Industry Revenue Million Forecast, by Country 2019 & 2032
- Table 11: Holographic Display Industry Revenue (Million) Forecast, by Application 2019 & 2032
- Table 12: Global Holographic Display Industry Revenue Million Forecast, by Country 2019 & 2032
- Table 13: Holographic Display Industry Revenue (Million) Forecast, by Application 2019 & 2032
- Table 14: Global Holographic Display Industry Revenue Million Forecast, by Country 2019 & 2032
- Table 15: Holographic Display Industry Revenue (Million) Forecast, by Application 2019 & 2032
- Table 16: Global Holographic Display Industry Revenue Million Forecast, by End-user Verticals 2019 & 2032
- Table 17: Global Holographic Display Industry Revenue Million Forecast, by Country 2019 & 2032
- Table 18: Global Holographic Display Industry Revenue Million Forecast, by End-user Verticals 2019 & 2032
- Table 19: Global Holographic Display Industry Revenue Million Forecast, by Country 2019 & 2032
- Table 20: Global Holographic Display Industry Revenue Million Forecast, by End-user Verticals 2019 & 2032
- Table 21: Global Holographic Display Industry Revenue Million Forecast, by Country 2019 & 2032
- Table 22: Global Holographic Display Industry Revenue Million Forecast, by End-user Verticals 2019 & 2032
- Table 23: Global Holographic Display Industry Revenue Million Forecast, by Country 2019 & 2032
- Table 24: Global Holographic Display Industry Revenue Million Forecast, by End-user Verticals 2019 & 2032
- Table 25: Global Holographic Display Industry Revenue Million Forecast, by Country 2019 & 2032
- Table 26: Global Holographic Display Industry Revenue Million Forecast, by End-user Verticals 2019 & 2032
- Table 27: Global Holographic Display Industry Revenue Million Forecast, by Country 2019 & 2032
Frequently Asked Questions
1. What is the projected Compound Annual Growth Rate (CAGR) of the Holographic Display Industry?
The projected CAGR is approximately 23.12%.
2. Which companies are prominent players in the Holographic Display Industry?
Key companies in the market include Musion Das Hologram Ltd, Realview Imaging Ltd, Animmersion UK Ltd, Looking Glass Factory Inc, Shenzhen SMX Display Technology Co Lt, Kino-mo Limited (HYPERVSN), RealFiction Holding AB, Provision Holding Inc.
3. What are the main segments of the Holographic Display Industry?
The market segments include End-user Verticals.
4. Can you provide details about the market size?
The market size is estimated to be USD 3.45 Million as of 2022.
5. What are some drivers contributing to market growth?
Increasing Investments in 3D Technology; Advancements in Screenless Displays.
6. What are the notable trends driving market growth?
Automotive Segment is Expected to Witness Significant Growth.
7. Are there any restraints impacting market growth?
High Cost of Assembling Holographic Display Devices; Presence of Substitute Display Products.
8. Can you provide examples of recent developments in the market?
Jan 2024: Hyundai Mobis, Hyundai’s largest supplier, unveiled its latest EV tech. It uses the first transparent display screen using holographic tech. The company revealed its “innovative display series” for next-gen vehicles, which included the “world’s first rollable display and swivel display.” Hyundai Mobis presented a transparent display that uses holographic elements. The display appears on a transparent panel, making it easier for drivers to keep their eyes on the road.
9. What pricing options are available for accessing the report?
Pricing options include single-user, multi-user, and enterprise licenses priced at USD 4750, USD 5250, and USD 8750 respectively.
10. Is the market size provided in terms of value or volume?
The market size is provided in terms of value, measured in Million.
11. Are there any specific market keywords associated with the report?
Yes, the market keyword associated with the report is "Holographic Display Industry," which aids in identifying and referencing the specific market segment covered.
12. How do I determine which pricing option suits my needs best?
The pricing options vary based on user requirements and access needs. Individual users may opt for single-user licenses, while businesses requiring broader access may choose multi-user or enterprise licenses for cost-effective access to the report.
13. Are there any additional resources or data provided in the Holographic Display Industry report?
While the report offers comprehensive insights, it's advisable to review the specific contents or supplementary materials provided to ascertain if additional resources or data are available.
14. How can I stay updated on further developments or reports in the Holographic Display Industry?
To stay informed about further developments, trends, and reports in the Holographic Display Industry, consider subscribing to industry newsletters, following relevant companies and organizations, or regularly checking reputable industry news sources and publications.
Methodology
Step 1 - Identification of Relevant Samples Size from Population Database


Step 2 - Approaches for Defining Global Market Size (Value, Volume* & Price*)

Note*: In applicable scenarios
Step 3 - Data Sources
Primary Research
- Web Analytics
- Survey Reports
- Research Institute
- Latest Research Reports
- Opinion Leaders
Secondary Research
- Annual Reports
- White Paper
- Latest Press Release
- Industry Association
- Paid Database
- Investor Presentations

Step 4 - Data Triangulation
Involves using different sources of information in order to increase the validity of a study
These sources are likely to be stakeholders in a program - participants, other researchers, program staff, other community members, and so on.
Then we put all data in single framework & apply various statistical tools to find out the dynamic on the market.
During the analysis stage, feedback from the stakeholder groups would be compared to determine areas of agreement as well as areas of divergence
