

Key Insights
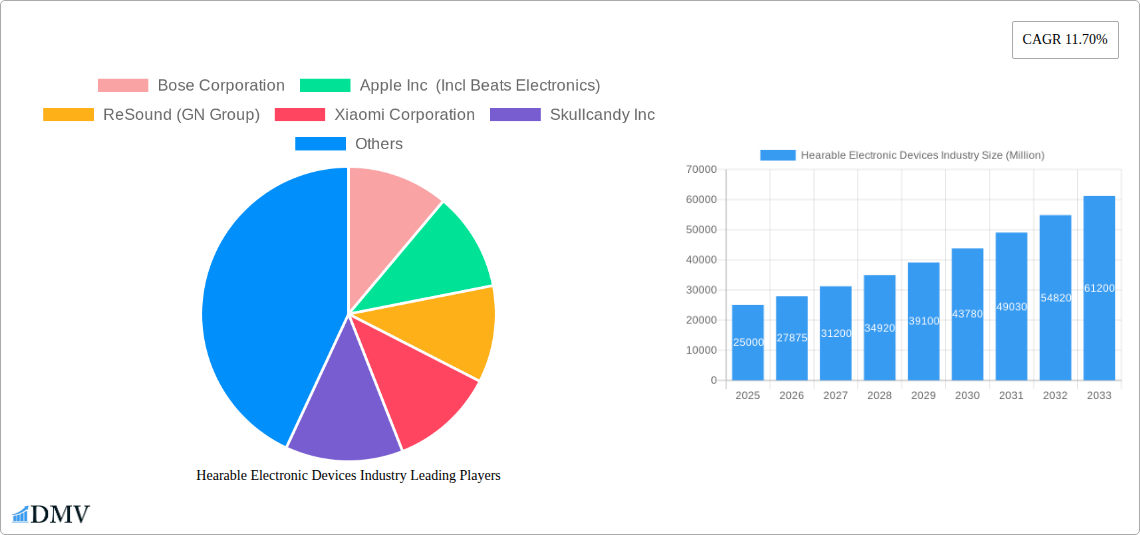
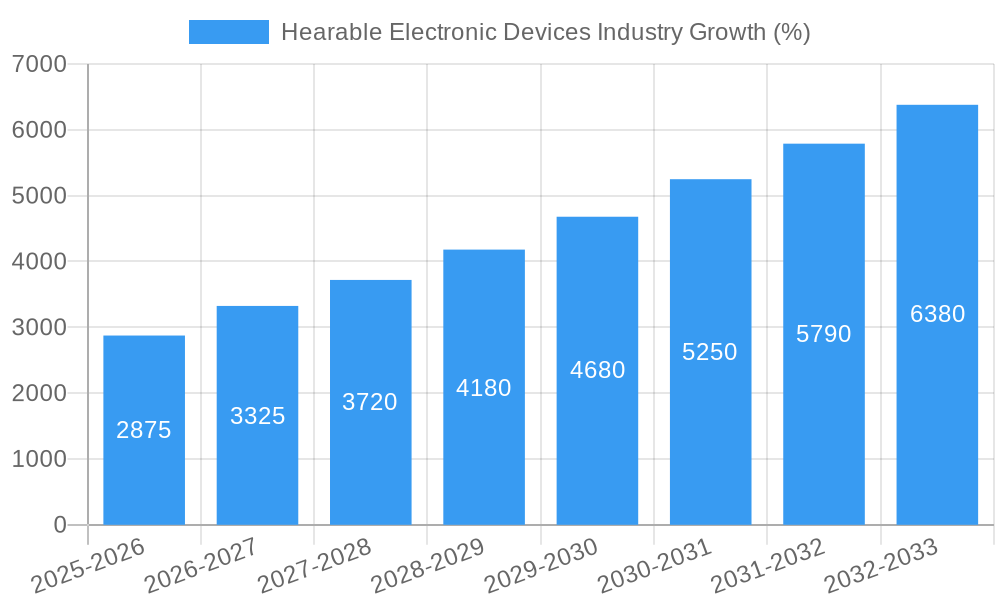
The hearable electronic devices market, encompassing headsets, earbuds, and hearing aids, is experiencing robust growth, projected to reach a substantial size by 2033. A compound annual growth rate (CAGR) of 11.70% from 2025 to 2033 indicates significant market expansion driven by several key factors. The increasing adoption of wireless technology, the rising demand for high-quality audio experiences for entertainment and communication, and the growing awareness and accessibility of hearing aids are primary growth drivers. Furthermore, the integration of advanced features such as noise cancellation, health monitoring capabilities (heart rate tracking, sleep monitoring), and improved comfort and design are boosting consumer demand across all segments. The market is segmented by product type (headsets, earbuds, hearing aids) and wearing style (in-ear, on-ear, over-ear), each exhibiting unique growth trajectories. The in-ear segment, particularly earbuds, is expected to dominate due to its portability and convenience. The premium segment, characterized by advanced features and higher price points, is experiencing faster growth than the budget segment, reflecting consumers’ willingness to pay for superior audio quality and functionality. Competitive pressures from major players such as Apple, Bose, and Samsung, alongside emerging brands, are driving innovation and enhancing product offerings.
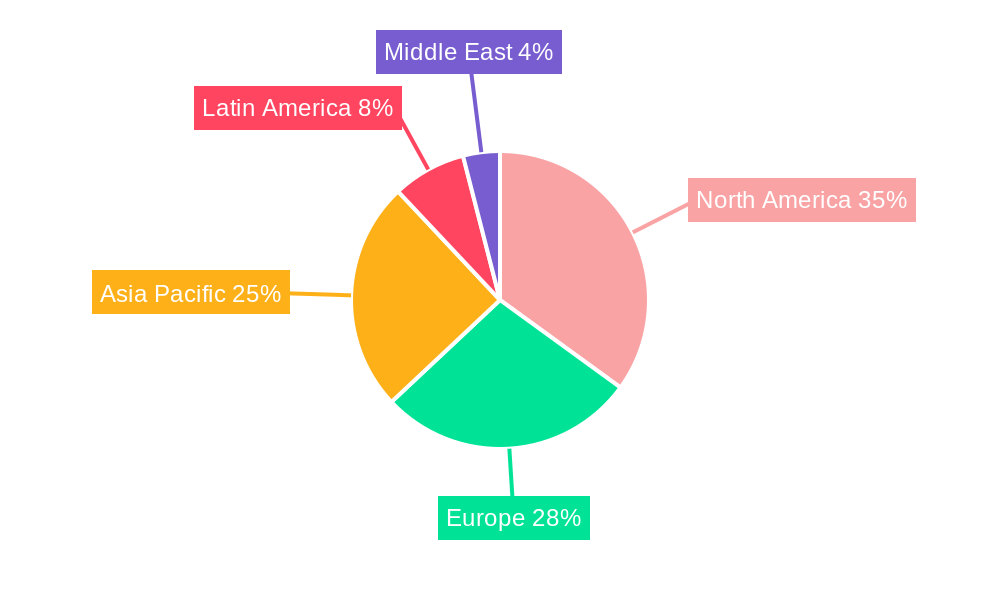
However, the market also faces certain challenges. The relatively short lifespan of these devices and the potential for technological obsolescence could limit market growth. Fluctuations in raw material prices and supply chain disruptions represent potential restraints. Furthermore, concerns regarding the potential long-term health effects of prolonged earbud use necessitate careful consideration. Regional growth patterns reveal a strong performance in North America and Asia-Pacific, fueled by increasing disposable incomes and technological adoption. Europe also shows consistent growth, while other regions are expected to witness gradual expansion. Overall, the future of the hearable electronic devices market is optimistic, with continuous innovation, expansion into new functionalities, and increasing global adoption projected to drive substantial market expansion throughout the forecast period. This positive outlook is contingent on addressing the challenges of sustainability and consumer health concerns effectively.
Hearable Electronic Devices Industry: A Comprehensive Market Report (2019-2033)
This insightful report provides a comprehensive analysis of the Hearable Electronic Devices industry, projecting a market value of xx Million by 2033. Spanning the historical period (2019-2024), base year (2025), and forecast period (2025-2033), this study offers invaluable insights for stakeholders seeking to navigate this dynamic market. The report meticulously examines market composition, technological advancements, leading players, and future growth trajectories, providing a crucial foundation for strategic decision-making.
Hearable Electronic Devices Industry Market Composition & Trends
This section delves into the competitive landscape of the Hearable Electronic Devices market, evaluating market concentration, innovation drivers, regulatory frameworks, substitute products, end-user profiles, and merger & acquisition (M&A) activities. The report analyzes the market share distribution among key players, including Bose Corporation, Apple Inc. (including Beats Electronics), ReSound (GN Group), Xiaomi Corporation, Skullcandy Inc., Samsung Electronics Co. Ltd. (Harman International Industries Inc. including JBL), Sennheiser Electronic GMBH & Co., Starkey Hearing Technologies, Demant A/S, WS Audiology A/S, and Sony Corporation. We examine M&A deal values and their impact on market dynamics, revealing a complex interplay of factors shaping the industry's evolution. The report also analyzes the impact of substitute products, such as traditional hearing aids and other personal audio devices, on the market's growth trajectory. Furthermore, it explores the end-user demographics, identifying key consumer segments and their preferences. This detailed analysis provides a thorough understanding of the market structure and its influencing factors.
- Market Concentration: Analysis of market share held by top players (e.g., Apple holding xx%, Bose holding xx%, etc.).
- Innovation Catalysts: Examination of factors driving innovation (e.g., advancements in noise cancellation, improved battery life, AI integration).
- Regulatory Landscape: Assessment of regulatory influences on product development and market access (e.g., FDA regulations for hearing aids).
- Substitute Products: Evaluation of competitive threats from alternative audio solutions.
- End-User Profiles: Analysis of consumer demographics and preferences driving market demand (age, income level, lifestyle).
- M&A Activities: Analysis of significant mergers and acquisitions, including deal values and their impact on market consolidation (e.g., xx Million deal between X and Y).
Hearable Electronic Devices Industry Industry Evolution
This section analyzes the market's growth trajectory, technological advancements, and evolving consumer preferences from 2019 to 2033. It examines the historical growth rates, adoption of new technologies (e.g., bone conduction, active noise cancellation), and shifts in consumer demands. The report investigates the increasing integration of smart features (health tracking, voice assistants) in hearable devices and their impact on market expansion. Specific data points, such as compound annual growth rates (CAGR) and adoption rates for specific product categories (earbuds, headsets, hearing aids), are provided to illustrate the market's dynamic evolution.
Leading Regions, Countries, or Segments in Hearable Electronic Devices Industry
This section identifies the leading regions, countries, and segments within the hearable devices market, focusing on Type (In-Ear, On-Ear, Over-Ear) and Product (Headsets, Earbuds, Hearing Aids). The dominance of specific regions or segments is analyzed, detailing the key factors that drive their success. The section uses both bullet points and paragraphs to present a comprehensive overview.
Key Drivers for Dominant Regions/Segments:
- High disposable income and consumer spending.
- Favorable regulatory environment.
- Strong technological infrastructure.
- Government initiatives supporting the industry.
- High adoption rates for specific product types.
In-depth analysis of dominance factors for the leading segment (e.g., In-Ear Earbuds): [Paragraph explaining factors, such as affordability, convenience, portability, and integration with smartphones.]
Hearable Electronic Devices Industry Product Innovations
This section details the latest innovations in hearable devices, focusing on unique selling propositions and technological advancements. This includes advancements in sound quality, noise cancellation, battery life, connectivity, and health monitoring capabilities. The report will highlight the integration of artificial intelligence and machine learning for personalized sound experiences and health monitoring.
Propelling Factors for Hearable Electronic Devices Industry Growth
The growth of the hearable electronic devices industry is driven by several key factors. Technological advancements, such as improved battery life, noise cancellation technology, and smaller form factors, are enhancing the user experience. Economic factors, such as increasing disposable incomes and a growing middle class in emerging economies, fuel consumer demand. Moreover, supportive government regulations and initiatives are promoting the adoption of hearable devices. For instance, initiatives to improve hearing healthcare accessibility and the increasing popularity of wireless technology contribute significantly to market growth.
Obstacles in the Hearable Electronic Devices Industry Market
The Hearable Electronic Devices industry faces several challenges. Regulatory hurdles, such as stringent safety and certification requirements in certain markets, can impede market entry and expansion. Supply chain disruptions, especially related to the sourcing of key components, can affect production capacity and product availability. Furthermore, intense competition among established players and new entrants puts pressure on pricing and profit margins. These factors collectively impact the industry's overall growth.
Future Opportunities in Hearable Electronic Devices Industry
Future opportunities lie in several areas. The growing demand for personalized audio experiences opens avenues for innovation in customizable sound profiles and AI-powered sound adjustment. The integration of health and fitness monitoring features in hearable devices presents a significant growth opportunity. Expansion into emerging markets with rising consumer incomes and technological adoption offers considerable potential.
Major Players in the Hearable Electronic Devices Industry Ecosystem
- Bose Corporation
- Apple Inc (Incl Beats Electronics)
- ReSound (GN Group)
- Xiaomi Corporation
- Skullcandy Inc
- Samsung Electronics Co Ltd (Harman International Industries Inc (Incl JBL)
- Sennheiser Electronic GMBH & Co
- Starkey Hearing Technologies
- Demant A/S
- WS Audiology A/S
- Sony Corporation
Key Developments in Hearable Electronic Devices Industry Industry
- October 2022: WS Audiology A/S launched the HearUSA brand, uniting resources to enhance hearing care access.
- November 2022: Starkey partnered with Special Olympics International, expanding hearing health services globally.
Strategic Hearable Electronic Devices Industry Market Forecast
The Hearable Electronic Devices market is poised for significant growth, driven by continuous technological innovation, expanding consumer base, and increasing awareness of hearing health. New product categories, advanced features, and integration with smart ecosystems will fuel this expansion. The market’s potential is immense, with opportunities for both established players and new entrants to capture significant market share in the coming years.
Hearable Electronic Devices Industry Segmentation
-
1. Type
- 1.1. In-Ear
- 1.2. On-Ear
- 1.3. Over-Ear
-
2. Product
- 2.1. Headsets
- 2.2. Earbuds
- 2.3. Hearing Aids
Hearable Electronic Devices Industry Segmentation By Geography
-
1. North America
- 1.1. United States
- 1.2. Canada
-
2. Europe
- 2.1. United Kingdom
- 2.2. Germany
- 2.3. France
- 2.4. Rest of Europe
-
3. Asia Pacific
- 3.1. China
- 3.2. Japan
- 3.3. India
- 3.4. South Korea
- 3.5. Rest of Asia Pacific
- 4. Latin America
- 5. Middle East
Hearable Electronic Devices Industry REPORT HIGHLIGHTS
| Aspects | Details |
|---|---|
| Study Period | 2019-2033 |
| Base Year | 2024 |
| Estimated Year | 2025 |
| Forecast Period | 2025-2033 |
| Historical Period | 2019-2024 |
| Growth Rate | CAGR of 11.70% from 2019-2033 |
| Segmentation |
|
Table of Contents
- 1. Introduction
- 1.1. Research Scope
- 1.2. Market Segmentation
- 1.3. Research Methodology
- 1.4. Definitions and Assumptions
- 2. Executive Summary
- 2.1. Introduction
- 3. Market Dynamics
- 3.1. Introduction
- 3.2. Market Drivers
- 3.2.1. Increasing Affinity of the Millennial Population Towards Technologically Advanced Appliances and Rising Number of Smartphone Users; Rise in Demand for Wireless Headphones and Infotainment Devices
- 3.3. Market Restrains
- 3.3.1. Optimizing Battery Life of Hearable Device
- 3.4. Market Trends
- 3.4.1. Rise in Demand for Wireless Headphones and Infotainment Devices to Drive the Market Growth
- 4. Market Factor Analysis
- 4.1. Porters Five Forces
- 4.2. Supply/Value Chain
- 4.3. PESTEL analysis
- 4.4. Market Entropy
- 4.5. Patent/Trademark Analysis
- 5. Global Hearable Electronic Devices Industry Analysis, Insights and Forecast, 2019-2031
- 5.1. Market Analysis, Insights and Forecast - by Type
- 5.1.1. In-Ear
- 5.1.2. On-Ear
- 5.1.3. Over-Ear
- 5.2. Market Analysis, Insights and Forecast - by Product
- 5.2.1. Headsets
- 5.2.2. Earbuds
- 5.2.3. Hearing Aids
- 5.3. Market Analysis, Insights and Forecast - by Region
- 5.3.1. North America
- 5.3.2. Europe
- 5.3.3. Asia Pacific
- 5.3.4. Latin America
- 5.3.5. Middle East
- 5.1. Market Analysis, Insights and Forecast - by Type
- 6. North America Hearable Electronic Devices Industry Analysis, Insights and Forecast, 2019-2031
- 6.1. Market Analysis, Insights and Forecast - by Type
- 6.1.1. In-Ear
- 6.1.2. On-Ear
- 6.1.3. Over-Ear
- 6.2. Market Analysis, Insights and Forecast - by Product
- 6.2.1. Headsets
- 6.2.2. Earbuds
- 6.2.3. Hearing Aids
- 6.1. Market Analysis, Insights and Forecast - by Type
- 7. Europe Hearable Electronic Devices Industry Analysis, Insights and Forecast, 2019-2031
- 7.1. Market Analysis, Insights and Forecast - by Type
- 7.1.1. In-Ear
- 7.1.2. On-Ear
- 7.1.3. Over-Ear
- 7.2. Market Analysis, Insights and Forecast - by Product
- 7.2.1. Headsets
- 7.2.2. Earbuds
- 7.2.3. Hearing Aids
- 7.1. Market Analysis, Insights and Forecast - by Type
- 8. Asia Pacific Hearable Electronic Devices Industry Analysis, Insights and Forecast, 2019-2031
- 8.1. Market Analysis, Insights and Forecast - by Type
- 8.1.1. In-Ear
- 8.1.2. On-Ear
- 8.1.3. Over-Ear
- 8.2. Market Analysis, Insights and Forecast - by Product
- 8.2.1. Headsets
- 8.2.2. Earbuds
- 8.2.3. Hearing Aids
- 8.1. Market Analysis, Insights and Forecast - by Type
- 9. Latin America Hearable Electronic Devices Industry Analysis, Insights and Forecast, 2019-2031
- 9.1. Market Analysis, Insights and Forecast - by Type
- 9.1.1. In-Ear
- 9.1.2. On-Ear
- 9.1.3. Over-Ear
- 9.2. Market Analysis, Insights and Forecast - by Product
- 9.2.1. Headsets
- 9.2.2. Earbuds
- 9.2.3. Hearing Aids
- 9.1. Market Analysis, Insights and Forecast - by Type
- 10. Middle East Hearable Electronic Devices Industry Analysis, Insights and Forecast, 2019-2031
- 10.1. Market Analysis, Insights and Forecast - by Type
- 10.1.1. In-Ear
- 10.1.2. On-Ear
- 10.1.3. Over-Ear
- 10.2. Market Analysis, Insights and Forecast - by Product
- 10.2.1. Headsets
- 10.2.2. Earbuds
- 10.2.3. Hearing Aids
- 10.1. Market Analysis, Insights and Forecast - by Type
- 11. North America Hearable Electronic Devices Industry Analysis, Insights and Forecast, 2019-2031
- 11.1. Market Analysis, Insights and Forecast - By Country/Sub-region
- 11.1.1 United States
- 11.1.2 Canada
- 12. Europe Hearable Electronic Devices Industry Analysis, Insights and Forecast, 2019-2031
- 12.1. Market Analysis, Insights and Forecast - By Country/Sub-region
- 12.1.1 United Kingdom
- 12.1.2 Germany
- 12.1.3 France
- 12.1.4 Rest of Europe
- 13. Asia Pacific Hearable Electronic Devices Industry Analysis, Insights and Forecast, 2019-2031
- 13.1. Market Analysis, Insights and Forecast - By Country/Sub-region
- 13.1.1 China
- 13.1.2 Japan
- 13.1.3 India
- 13.1.4 South Korea
- 13.1.5 Rest of Asia Pacific
- 14. Latin America Hearable Electronic Devices Industry Analysis, Insights and Forecast, 2019-2031
- 14.1. Market Analysis, Insights and Forecast - By Country/Sub-region
- 14.1.1.
- 15. Middle East Hearable Electronic Devices Industry Analysis, Insights and Forecast, 2019-2031
- 15.1. Market Analysis, Insights and Forecast - By Country/Sub-region
- 15.1.1.
- 16. Competitive Analysis
- 16.1. Global Market Share Analysis 2024
- 16.2. Company Profiles
- 16.2.1 Bose Corporation
- 16.2.1.1. Overview
- 16.2.1.2. Products
- 16.2.1.3. SWOT Analysis
- 16.2.1.4. Recent Developments
- 16.2.1.5. Financials (Based on Availability)
- 16.2.2 Apple Inc (Incl Beats Electronics)
- 16.2.2.1. Overview
- 16.2.2.2. Products
- 16.2.2.3. SWOT Analysis
- 16.2.2.4. Recent Developments
- 16.2.2.5. Financials (Based on Availability)
- 16.2.3 ReSound (GN Group)
- 16.2.3.1. Overview
- 16.2.3.2. Products
- 16.2.3.3. SWOT Analysis
- 16.2.3.4. Recent Developments
- 16.2.3.5. Financials (Based on Availability)
- 16.2.4 Xiaomi Corporation
- 16.2.4.1. Overview
- 16.2.4.2. Products
- 16.2.4.3. SWOT Analysis
- 16.2.4.4. Recent Developments
- 16.2.4.5. Financials (Based on Availability)
- 16.2.5 Skullcandy Inc
- 16.2.5.1. Overview
- 16.2.5.2. Products
- 16.2.5.3. SWOT Analysis
- 16.2.5.4. Recent Developments
- 16.2.5.5. Financials (Based on Availability)
- 16.2.6 Samsung Electronics Co Ltd (Harman International Industries Inc (Incl JBL)
- 16.2.6.1. Overview
- 16.2.6.2. Products
- 16.2.6.3. SWOT Analysis
- 16.2.6.4. Recent Developments
- 16.2.6.5. Financials (Based on Availability)
- 16.2.7 Sennheiser Electronic GMBH & Co
- 16.2.7.1. Overview
- 16.2.7.2. Products
- 16.2.7.3. SWOT Analysis
- 16.2.7.4. Recent Developments
- 16.2.7.5. Financials (Based on Availability)
- 16.2.8 Starkey Hearing Technologies
- 16.2.8.1. Overview
- 16.2.8.2. Products
- 16.2.8.3. SWOT Analysis
- 16.2.8.4. Recent Developments
- 16.2.8.5. Financials (Based on Availability)
- 16.2.9 Demant A/S
- 16.2.9.1. Overview
- 16.2.9.2. Products
- 16.2.9.3. SWOT Analysis
- 16.2.9.4. Recent Developments
- 16.2.9.5. Financials (Based on Availability)
- 16.2.10 WS Audiology A/S
- 16.2.10.1. Overview
- 16.2.10.2. Products
- 16.2.10.3. SWOT Analysis
- 16.2.10.4. Recent Developments
- 16.2.10.5. Financials (Based on Availability)
- 16.2.11 Sony Corporation
- 16.2.11.1. Overview
- 16.2.11.2. Products
- 16.2.11.3. SWOT Analysis
- 16.2.11.4. Recent Developments
- 16.2.11.5. Financials (Based on Availability)
- 16.2.1 Bose Corporation
List of Figures
- Figure 1: Global Hearable Electronic Devices Industry Revenue Breakdown (Million, %) by Region 2024 & 2032
- Figure 2: Global Hearable Electronic Devices Industry Volume Breakdown (K Unit, %) by Region 2024 & 2032
- Figure 3: North America Hearable Electronic Devices Industry Revenue (Million), by Country 2024 & 2032
- Figure 4: North America Hearable Electronic Devices Industry Volume (K Unit), by Country 2024 & 2032
- Figure 5: North America Hearable Electronic Devices Industry Revenue Share (%), by Country 2024 & 2032
- Figure 6: North America Hearable Electronic Devices Industry Volume Share (%), by Country 2024 & 2032
- Figure 7: Europe Hearable Electronic Devices Industry Revenue (Million), by Country 2024 & 2032
- Figure 8: Europe Hearable Electronic Devices Industry Volume (K Unit), by Country 2024 & 2032
- Figure 9: Europe Hearable Electronic Devices Industry Revenue Share (%), by Country 2024 & 2032
- Figure 10: Europe Hearable Electronic Devices Industry Volume Share (%), by Country 2024 & 2032
- Figure 11: Asia Pacific Hearable Electronic Devices Industry Revenue (Million), by Country 2024 & 2032
- Figure 12: Asia Pacific Hearable Electronic Devices Industry Volume (K Unit), by Country 2024 & 2032
- Figure 13: Asia Pacific Hearable Electronic Devices Industry Revenue Share (%), by Country 2024 & 2032
- Figure 14: Asia Pacific Hearable Electronic Devices Industry Volume Share (%), by Country 2024 & 2032
- Figure 15: Latin America Hearable Electronic Devices Industry Revenue (Million), by Country 2024 & 2032
- Figure 16: Latin America Hearable Electronic Devices Industry Volume (K Unit), by Country 2024 & 2032
- Figure 17: Latin America Hearable Electronic Devices Industry Revenue Share (%), by Country 2024 & 2032
- Figure 18: Latin America Hearable Electronic Devices Industry Volume Share (%), by Country 2024 & 2032
- Figure 19: Middle East Hearable Electronic Devices Industry Revenue (Million), by Country 2024 & 2032
- Figure 20: Middle East Hearable Electronic Devices Industry Volume (K Unit), by Country 2024 & 2032
- Figure 21: Middle East Hearable Electronic Devices Industry Revenue Share (%), by Country 2024 & 2032
- Figure 22: Middle East Hearable Electronic Devices Industry Volume Share (%), by Country 2024 & 2032
- Figure 23: North America Hearable Electronic Devices Industry Revenue (Million), by Type 2024 & 2032
- Figure 24: North America Hearable Electronic Devices Industry Volume (K Unit), by Type 2024 & 2032
- Figure 25: North America Hearable Electronic Devices Industry Revenue Share (%), by Type 2024 & 2032
- Figure 26: North America Hearable Electronic Devices Industry Volume Share (%), by Type 2024 & 2032
- Figure 27: North America Hearable Electronic Devices Industry Revenue (Million), by Product 2024 & 2032
- Figure 28: North America Hearable Electronic Devices Industry Volume (K Unit), by Product 2024 & 2032
- Figure 29: North America Hearable Electronic Devices Industry Revenue Share (%), by Product 2024 & 2032
- Figure 30: North America Hearable Electronic Devices Industry Volume Share (%), by Product 2024 & 2032
- Figure 31: North America Hearable Electronic Devices Industry Revenue (Million), by Country 2024 & 2032
- Figure 32: North America Hearable Electronic Devices Industry Volume (K Unit), by Country 2024 & 2032
- Figure 33: North America Hearable Electronic Devices Industry Revenue Share (%), by Country 2024 & 2032
- Figure 34: North America Hearable Electronic Devices Industry Volume Share (%), by Country 2024 & 2032
- Figure 35: Europe Hearable Electronic Devices Industry Revenue (Million), by Type 2024 & 2032
- Figure 36: Europe Hearable Electronic Devices Industry Volume (K Unit), by Type 2024 & 2032
- Figure 37: Europe Hearable Electronic Devices Industry Revenue Share (%), by Type 2024 & 2032
- Figure 38: Europe Hearable Electronic Devices Industry Volume Share (%), by Type 2024 & 2032
- Figure 39: Europe Hearable Electronic Devices Industry Revenue (Million), by Product 2024 & 2032
- Figure 40: Europe Hearable Electronic Devices Industry Volume (K Unit), by Product 2024 & 2032
- Figure 41: Europe Hearable Electronic Devices Industry Revenue Share (%), by Product 2024 & 2032
- Figure 42: Europe Hearable Electronic Devices Industry Volume Share (%), by Product 2024 & 2032
- Figure 43: Europe Hearable Electronic Devices Industry Revenue (Million), by Country 2024 & 2032
- Figure 44: Europe Hearable Electronic Devices Industry Volume (K Unit), by Country 2024 & 2032
- Figure 45: Europe Hearable Electronic Devices Industry Revenue Share (%), by Country 2024 & 2032
- Figure 46: Europe Hearable Electronic Devices Industry Volume Share (%), by Country 2024 & 2032
- Figure 47: Asia Pacific Hearable Electronic Devices Industry Revenue (Million), by Type 2024 & 2032
- Figure 48: Asia Pacific Hearable Electronic Devices Industry Volume (K Unit), by Type 2024 & 2032
- Figure 49: Asia Pacific Hearable Electronic Devices Industry Revenue Share (%), by Type 2024 & 2032
- Figure 50: Asia Pacific Hearable Electronic Devices Industry Volume Share (%), by Type 2024 & 2032
- Figure 51: Asia Pacific Hearable Electronic Devices Industry Revenue (Million), by Product 2024 & 2032
- Figure 52: Asia Pacific Hearable Electronic Devices Industry Volume (K Unit), by Product 2024 & 2032
- Figure 53: Asia Pacific Hearable Electronic Devices Industry Revenue Share (%), by Product 2024 & 2032
- Figure 54: Asia Pacific Hearable Electronic Devices Industry Volume Share (%), by Product 2024 & 2032
- Figure 55: Asia Pacific Hearable Electronic Devices Industry Revenue (Million), by Country 2024 & 2032
- Figure 56: Asia Pacific Hearable Electronic Devices Industry Volume (K Unit), by Country 2024 & 2032
- Figure 57: Asia Pacific Hearable Electronic Devices Industry Revenue Share (%), by Country 2024 & 2032
- Figure 58: Asia Pacific Hearable Electronic Devices Industry Volume Share (%), by Country 2024 & 2032
- Figure 59: Latin America Hearable Electronic Devices Industry Revenue (Million), by Type 2024 & 2032
- Figure 60: Latin America Hearable Electronic Devices Industry Volume (K Unit), by Type 2024 & 2032
- Figure 61: Latin America Hearable Electronic Devices Industry Revenue Share (%), by Type 2024 & 2032
- Figure 62: Latin America Hearable Electronic Devices Industry Volume Share (%), by Type 2024 & 2032
- Figure 63: Latin America Hearable Electronic Devices Industry Revenue (Million), by Product 2024 & 2032
- Figure 64: Latin America Hearable Electronic Devices Industry Volume (K Unit), by Product 2024 & 2032
- Figure 65: Latin America Hearable Electronic Devices Industry Revenue Share (%), by Product 2024 & 2032
- Figure 66: Latin America Hearable Electronic Devices Industry Volume Share (%), by Product 2024 & 2032
- Figure 67: Latin America Hearable Electronic Devices Industry Revenue (Million), by Country 2024 & 2032
- Figure 68: Latin America Hearable Electronic Devices Industry Volume (K Unit), by Country 2024 & 2032
- Figure 69: Latin America Hearable Electronic Devices Industry Revenue Share (%), by Country 2024 & 2032
- Figure 70: Latin America Hearable Electronic Devices Industry Volume Share (%), by Country 2024 & 2032
- Figure 71: Middle East Hearable Electronic Devices Industry Revenue (Million), by Type 2024 & 2032
- Figure 72: Middle East Hearable Electronic Devices Industry Volume (K Unit), by Type 2024 & 2032
- Figure 73: Middle East Hearable Electronic Devices Industry Revenue Share (%), by Type 2024 & 2032
- Figure 74: Middle East Hearable Electronic Devices Industry Volume Share (%), by Type 2024 & 2032
- Figure 75: Middle East Hearable Electronic Devices Industry Revenue (Million), by Product 2024 & 2032
- Figure 76: Middle East Hearable Electronic Devices Industry Volume (K Unit), by Product 2024 & 2032
- Figure 77: Middle East Hearable Electronic Devices Industry Revenue Share (%), by Product 2024 & 2032
- Figure 78: Middle East Hearable Electronic Devices Industry Volume Share (%), by Product 2024 & 2032
- Figure 79: Middle East Hearable Electronic Devices Industry Revenue (Million), by Country 2024 & 2032
- Figure 80: Middle East Hearable Electronic Devices Industry Volume (K Unit), by Country 2024 & 2032
- Figure 81: Middle East Hearable Electronic Devices Industry Revenue Share (%), by Country 2024 & 2032
- Figure 82: Middle East Hearable Electronic Devices Industry Volume Share (%), by Country 2024 & 2032
List of Tables
- Table 1: Global Hearable Electronic Devices Industry Revenue Million Forecast, by Region 2019 & 2032
- Table 2: Global Hearable Electronic Devices Industry Volume K Unit Forecast, by Region 2019 & 2032
- Table 3: Global Hearable Electronic Devices Industry Revenue Million Forecast, by Type 2019 & 2032
- Table 4: Global Hearable Electronic Devices Industry Volume K Unit Forecast, by Type 2019 & 2032
- Table 5: Global Hearable Electronic Devices Industry Revenue Million Forecast, by Product 2019 & 2032
- Table 6: Global Hearable Electronic Devices Industry Volume K Unit Forecast, by Product 2019 & 2032
- Table 7: Global Hearable Electronic Devices Industry Revenue Million Forecast, by Region 2019 & 2032
- Table 8: Global Hearable Electronic Devices Industry Volume K Unit Forecast, by Region 2019 & 2032
- Table 9: Global Hearable Electronic Devices Industry Revenue Million Forecast, by Country 2019 & 2032
- Table 10: Global Hearable Electronic Devices Industry Volume K Unit Forecast, by Country 2019 & 2032
- Table 11: United States Hearable Electronic Devices Industry Revenue (Million) Forecast, by Application 2019 & 2032
- Table 12: United States Hearable Electronic Devices Industry Volume (K Unit) Forecast, by Application 2019 & 2032
- Table 13: Canada Hearable Electronic Devices Industry Revenue (Million) Forecast, by Application 2019 & 2032
- Table 14: Canada Hearable Electronic Devices Industry Volume (K Unit) Forecast, by Application 2019 & 2032
- Table 15: Global Hearable Electronic Devices Industry Revenue Million Forecast, by Country 2019 & 2032
- Table 16: Global Hearable Electronic Devices Industry Volume K Unit Forecast, by Country 2019 & 2032
- Table 17: United Kingdom Hearable Electronic Devices Industry Revenue (Million) Forecast, by Application 2019 & 2032
- Table 18: United Kingdom Hearable Electronic Devices Industry Volume (K Unit) Forecast, by Application 2019 & 2032
- Table 19: Germany Hearable Electronic Devices Industry Revenue (Million) Forecast, by Application 2019 & 2032
- Table 20: Germany Hearable Electronic Devices Industry Volume (K Unit) Forecast, by Application 2019 & 2032
- Table 21: France Hearable Electronic Devices Industry Revenue (Million) Forecast, by Application 2019 & 2032
- Table 22: France Hearable Electronic Devices Industry Volume (K Unit) Forecast, by Application 2019 & 2032
- Table 23: Rest of Europe Hearable Electronic Devices Industry Revenue (Million) Forecast, by Application 2019 & 2032
- Table 24: Rest of Europe Hearable Electronic Devices Industry Volume (K Unit) Forecast, by Application 2019 & 2032
- Table 25: Global Hearable Electronic Devices Industry Revenue Million Forecast, by Country 2019 & 2032
- Table 26: Global Hearable Electronic Devices Industry Volume K Unit Forecast, by Country 2019 & 2032
- Table 27: China Hearable Electronic Devices Industry Revenue (Million) Forecast, by Application 2019 & 2032
- Table 28: China Hearable Electronic Devices Industry Volume (K Unit) Forecast, by Application 2019 & 2032
- Table 29: Japan Hearable Electronic Devices Industry Revenue (Million) Forecast, by Application 2019 & 2032
- Table 30: Japan Hearable Electronic Devices Industry Volume (K Unit) Forecast, by Application 2019 & 2032
- Table 31: India Hearable Electronic Devices Industry Revenue (Million) Forecast, by Application 2019 & 2032
- Table 32: India Hearable Electronic Devices Industry Volume (K Unit) Forecast, by Application 2019 & 2032
- Table 33: South Korea Hearable Electronic Devices Industry Revenue (Million) Forecast, by Application 2019 & 2032
- Table 34: South Korea Hearable Electronic Devices Industry Volume (K Unit) Forecast, by Application 2019 & 2032
- Table 35: Rest of Asia Pacific Hearable Electronic Devices Industry Revenue (Million) Forecast, by Application 2019 & 2032
- Table 36: Rest of Asia Pacific Hearable Electronic Devices Industry Volume (K Unit) Forecast, by Application 2019 & 2032
- Table 37: Global Hearable Electronic Devices Industry Revenue Million Forecast, by Country 2019 & 2032
- Table 38: Global Hearable Electronic Devices Industry Volume K Unit Forecast, by Country 2019 & 2032
- Table 39: Hearable Electronic Devices Industry Revenue (Million) Forecast, by Application 2019 & 2032
- Table 40: Hearable Electronic Devices Industry Volume (K Unit) Forecast, by Application 2019 & 2032
- Table 41: Global Hearable Electronic Devices Industry Revenue Million Forecast, by Country 2019 & 2032
- Table 42: Global Hearable Electronic Devices Industry Volume K Unit Forecast, by Country 2019 & 2032
- Table 43: Hearable Electronic Devices Industry Revenue (Million) Forecast, by Application 2019 & 2032
- Table 44: Hearable Electronic Devices Industry Volume (K Unit) Forecast, by Application 2019 & 2032
- Table 45: Global Hearable Electronic Devices Industry Revenue Million Forecast, by Type 2019 & 2032
- Table 46: Global Hearable Electronic Devices Industry Volume K Unit Forecast, by Type 2019 & 2032
- Table 47: Global Hearable Electronic Devices Industry Revenue Million Forecast, by Product 2019 & 2032
- Table 48: Global Hearable Electronic Devices Industry Volume K Unit Forecast, by Product 2019 & 2032
- Table 49: Global Hearable Electronic Devices Industry Revenue Million Forecast, by Country 2019 & 2032
- Table 50: Global Hearable Electronic Devices Industry Volume K Unit Forecast, by Country 2019 & 2032
- Table 51: United States Hearable Electronic Devices Industry Revenue (Million) Forecast, by Application 2019 & 2032
- Table 52: United States Hearable Electronic Devices Industry Volume (K Unit) Forecast, by Application 2019 & 2032
- Table 53: Canada Hearable Electronic Devices Industry Revenue (Million) Forecast, by Application 2019 & 2032
- Table 54: Canada Hearable Electronic Devices Industry Volume (K Unit) Forecast, by Application 2019 & 2032
- Table 55: Global Hearable Electronic Devices Industry Revenue Million Forecast, by Type 2019 & 2032
- Table 56: Global Hearable Electronic Devices Industry Volume K Unit Forecast, by Type 2019 & 2032
- Table 57: Global Hearable Electronic Devices Industry Revenue Million Forecast, by Product 2019 & 2032
- Table 58: Global Hearable Electronic Devices Industry Volume K Unit Forecast, by Product 2019 & 2032
- Table 59: Global Hearable Electronic Devices Industry Revenue Million Forecast, by Country 2019 & 2032
- Table 60: Global Hearable Electronic Devices Industry Volume K Unit Forecast, by Country 2019 & 2032
- Table 61: United Kingdom Hearable Electronic Devices Industry Revenue (Million) Forecast, by Application 2019 & 2032
- Table 62: United Kingdom Hearable Electronic Devices Industry Volume (K Unit) Forecast, by Application 2019 & 2032
- Table 63: Germany Hearable Electronic Devices Industry Revenue (Million) Forecast, by Application 2019 & 2032
- Table 64: Germany Hearable Electronic Devices Industry Volume (K Unit) Forecast, by Application 2019 & 2032
- Table 65: France Hearable Electronic Devices Industry Revenue (Million) Forecast, by Application 2019 & 2032
- Table 66: France Hearable Electronic Devices Industry Volume (K Unit) Forecast, by Application 2019 & 2032
- Table 67: Rest of Europe Hearable Electronic Devices Industry Revenue (Million) Forecast, by Application 2019 & 2032
- Table 68: Rest of Europe Hearable Electronic Devices Industry Volume (K Unit) Forecast, by Application 2019 & 2032
- Table 69: Global Hearable Electronic Devices Industry Revenue Million Forecast, by Type 2019 & 2032
- Table 70: Global Hearable Electronic Devices Industry Volume K Unit Forecast, by Type 2019 & 2032
- Table 71: Global Hearable Electronic Devices Industry Revenue Million Forecast, by Product 2019 & 2032
- Table 72: Global Hearable Electronic Devices Industry Volume K Unit Forecast, by Product 2019 & 2032
- Table 73: Global Hearable Electronic Devices Industry Revenue Million Forecast, by Country 2019 & 2032
- Table 74: Global Hearable Electronic Devices Industry Volume K Unit Forecast, by Country 2019 & 2032
- Table 75: China Hearable Electronic Devices Industry Revenue (Million) Forecast, by Application 2019 & 2032
- Table 76: China Hearable Electronic Devices Industry Volume (K Unit) Forecast, by Application 2019 & 2032
- Table 77: Japan Hearable Electronic Devices Industry Revenue (Million) Forecast, by Application 2019 & 2032
- Table 78: Japan Hearable Electronic Devices Industry Volume (K Unit) Forecast, by Application 2019 & 2032
- Table 79: India Hearable Electronic Devices Industry Revenue (Million) Forecast, by Application 2019 & 2032
- Table 80: India Hearable Electronic Devices Industry Volume (K Unit) Forecast, by Application 2019 & 2032
- Table 81: South Korea Hearable Electronic Devices Industry Revenue (Million) Forecast, by Application 2019 & 2032
- Table 82: South Korea Hearable Electronic Devices Industry Volume (K Unit) Forecast, by Application 2019 & 2032
- Table 83: Rest of Asia Pacific Hearable Electronic Devices Industry Revenue (Million) Forecast, by Application 2019 & 2032
- Table 84: Rest of Asia Pacific Hearable Electronic Devices Industry Volume (K Unit) Forecast, by Application 2019 & 2032
- Table 85: Global Hearable Electronic Devices Industry Revenue Million Forecast, by Type 2019 & 2032
- Table 86: Global Hearable Electronic Devices Industry Volume K Unit Forecast, by Type 2019 & 2032
- Table 87: Global Hearable Electronic Devices Industry Revenue Million Forecast, by Product 2019 & 2032
- Table 88: Global Hearable Electronic Devices Industry Volume K Unit Forecast, by Product 2019 & 2032
- Table 89: Global Hearable Electronic Devices Industry Revenue Million Forecast, by Country 2019 & 2032
- Table 90: Global Hearable Electronic Devices Industry Volume K Unit Forecast, by Country 2019 & 2032
- Table 91: Global Hearable Electronic Devices Industry Revenue Million Forecast, by Type 2019 & 2032
- Table 92: Global Hearable Electronic Devices Industry Volume K Unit Forecast, by Type 2019 & 2032
- Table 93: Global Hearable Electronic Devices Industry Revenue Million Forecast, by Product 2019 & 2032
- Table 94: Global Hearable Electronic Devices Industry Volume K Unit Forecast, by Product 2019 & 2032
- Table 95: Global Hearable Electronic Devices Industry Revenue Million Forecast, by Country 2019 & 2032
- Table 96: Global Hearable Electronic Devices Industry Volume K Unit Forecast, by Country 2019 & 2032
Frequently Asked Questions
1. What is the projected Compound Annual Growth Rate (CAGR) of the Hearable Electronic Devices Industry?
The projected CAGR is approximately 11.70%.
2. Which companies are prominent players in the Hearable Electronic Devices Industry?
Key companies in the market include Bose Corporation, Apple Inc (Incl Beats Electronics), ReSound (GN Group), Xiaomi Corporation, Skullcandy Inc, Samsung Electronics Co Ltd (Harman International Industries Inc (Incl JBL), Sennheiser Electronic GMBH & Co, Starkey Hearing Technologies, Demant A/S, WS Audiology A/S, Sony Corporation.
3. What are the main segments of the Hearable Electronic Devices Industry?
The market segments include Type, Product.
4. Can you provide details about the market size?
The market size is estimated to be USD XX Million as of 2022.
5. What are some drivers contributing to market growth?
Increasing Affinity of the Millennial Population Towards Technologically Advanced Appliances and Rising Number of Smartphone Users; Rise in Demand for Wireless Headphones and Infotainment Devices.
6. What are the notable trends driving market growth?
Rise in Demand for Wireless Headphones and Infotainment Devices to Drive the Market Growth.
7. Are there any restraints impacting market growth?
Optimizing Battery Life of Hearable Device.
8. Can you provide examples of recent developments in the market?
November 2022 - Starkey Partners with Special Olympics International to Bring Hearing Health Services to Athletes in Puerto Rico and provides life-changing health services and hearing instruments to Special Olympics athletes worldwide while helping make healthy hearing more inclusive of people with intellectual disabilities.
9. What pricing options are available for accessing the report?
Pricing options include single-user, multi-user, and enterprise licenses priced at USD 4750, USD 5250, and USD 8750 respectively.
10. Is the market size provided in terms of value or volume?
The market size is provided in terms of value, measured in Million and volume, measured in K Unit.
11. Are there any specific market keywords associated with the report?
Yes, the market keyword associated with the report is "Hearable Electronic Devices Industry," which aids in identifying and referencing the specific market segment covered.
12. How do I determine which pricing option suits my needs best?
The pricing options vary based on user requirements and access needs. Individual users may opt for single-user licenses, while businesses requiring broader access may choose multi-user or enterprise licenses for cost-effective access to the report.
13. Are there any additional resources or data provided in the Hearable Electronic Devices Industry report?
While the report offers comprehensive insights, it's advisable to review the specific contents or supplementary materials provided to ascertain if additional resources or data are available.
14. How can I stay updated on further developments or reports in the Hearable Electronic Devices Industry?
To stay informed about further developments, trends, and reports in the Hearable Electronic Devices Industry, consider subscribing to industry newsletters, following relevant companies and organizations, or regularly checking reputable industry news sources and publications.
Methodology
Step 1 - Identification of Relevant Samples Size from Population Database


Step 2 - Approaches for Defining Global Market Size (Value, Volume* & Price*)

Note*: In applicable scenarios
Step 3 - Data Sources
Primary Research
- Web Analytics
- Survey Reports
- Research Institute
- Latest Research Reports
- Opinion Leaders
Secondary Research
- Annual Reports
- White Paper
- Latest Press Release
- Industry Association
- Paid Database
- Investor Presentations

Step 4 - Data Triangulation
Involves using different sources of information in order to increase the validity of a study
These sources are likely to be stakeholders in a program - participants, other researchers, program staff, other community members, and so on.
Then we put all data in single framework & apply various statistical tools to find out the dynamic on the market.
During the analysis stage, feedback from the stakeholder groups would be compared to determine areas of agreement as well as areas of divergence
