

Key Insights
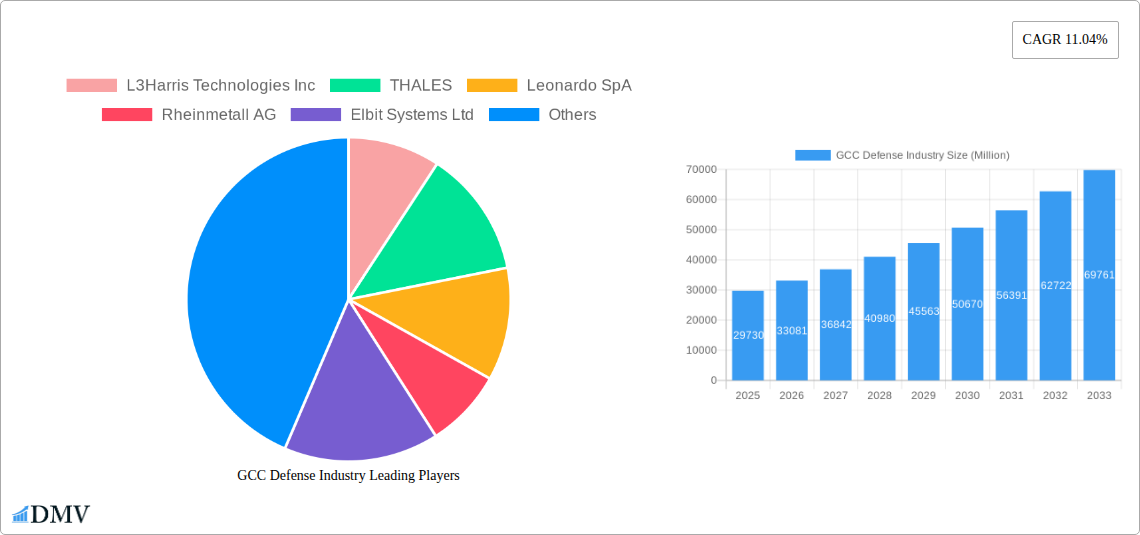
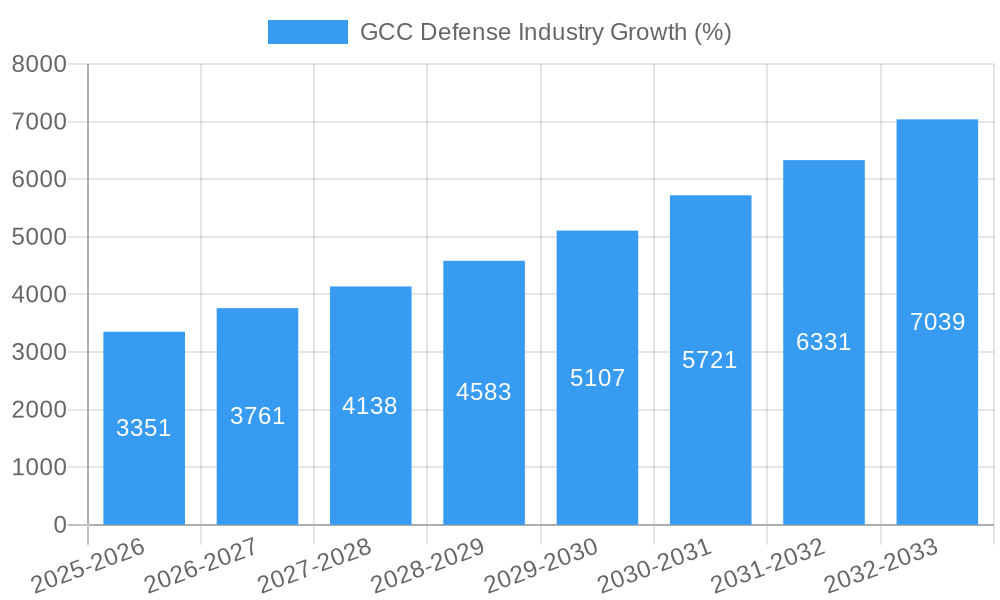
The GCC defense industry, valued at $29.73 billion in 2025, is projected to experience robust growth, driven by escalating geopolitical tensions, modernization efforts of armed forces across the Gulf Cooperation Council (GCC) nations, and increasing investments in advanced defense technologies. A compound annual growth rate (CAGR) of 11.04% is anticipated from 2025 to 2033, indicating a significant expansion of the market. Key drivers include the need to enhance cybersecurity infrastructure, counter terrorism threats, and bolster national security. The increasing adoption of unmanned aerial vehicles (UAVs), advanced communication systems, and sophisticated weaponry contributes significantly to this growth. Furthermore, substantial government spending on defense procurement and modernization programs across Saudi Arabia, the UAE, and other GCC states fuels market expansion. Segmentation analysis reveals significant opportunities within protection equipment, communication systems, air-based vehicles, weapons and ammunition, and personnel training and protection. Major players such as L3Harris Technologies, Thales, Leonardo SpA, and others are actively competing in this dynamic market.
The forecast period of 2025-2033 presents several promising avenues for growth, including the continued adoption of innovative technologies such as AI-powered defense systems and the development of indigenous defense capabilities within the GCC region. However, potential restraints include fluctuating oil prices, economic uncertainties, and international geopolitical shifts. Despite these challenges, the long-term outlook remains positive, fueled by the region’s strategic importance and the continuous prioritization of defense spending. The focus on developing indigenous defense industries and strategic partnerships with international defense contractors is expected to further shape the industry landscape in the coming years. The market is segmented by armed forces (Army, Navy, Air Force), equipment type (protection equipment, communication systems, vehicles, air-based vehicles, weapons and ammunition), and type of service (personnel training and protection). This detailed segmentation provides valuable insights into the specific market segments with the highest growth potential.
GCC Defense Industry Market Report: 2019-2033
This comprehensive report provides an in-depth analysis of the GCC defense industry, projecting a market value exceeding $XX Million by 2033. Covering the period from 2019 to 2033 (base year 2025, forecast period 2025-2033), this study offers invaluable insights for stakeholders, investors, and industry professionals seeking to navigate this dynamic landscape. The report leverages extensive primary and secondary research, incorporating key industry developments and expert opinions to deliver actionable intelligence.
GCC Defense Industry Market Composition & Trends
This section examines the GCC defense industry's structure, analyzing market concentration, innovation drivers, regulatory frameworks, substitute products, end-user profiles, and M&A activity. The market is characterized by a relatively concentrated landscape, with a few major players holding significant market share. However, the emergence of regional players and increased international collaboration is fostering competition.
- Market Share Distribution (2024 Estimate): Lockheed Martin and BAE Systems hold approximately 15% each, followed by Thales and Airbus at 12% and 10%, respectively. Remaining market share is distributed among other key players, including those listed in this report.
- M&A Activity: The historical period (2019-2024) witnessed $XX Million in M&A deals, with a notable increase in activity in 2023-2024 driven by the push for technological advancements and regional consolidation. We project $XX Million in M&A activity during the forecast period.
- Innovation Catalysts: Government investments in R&D, technological advancements, and the urgent need for enhanced defense capabilities are stimulating significant innovation within the industry, focusing particularly on cybersecurity and autonomous systems.
- Regulatory Landscape: Stringent regulations regarding arms exports and technology transfer influence market dynamics and affect investment decisions.
GCC Defense Industry Industry Evolution
The GCC defense industry has experienced significant evolution since 2019. Market growth has been driven by escalating geopolitical instability and sustained investment in national security by GCC nations. Technological advancements, such as AI integration in defense systems and the development of advanced weaponry, are shaping industry trends. Consumer demand, primarily from armed forces, is shifting towards more sophisticated and interconnected systems, emphasizing interoperability and data-driven decision-making.
- Growth Trajectory: The industry exhibited a CAGR of XX% from 2019-2024. The report projects a CAGR of XX% from 2025-2033, driven by increased defense budgets and the adoption of advanced technologies.
- Technological Advancements: The adoption of AI, unmanned aerial vehicles (UAVs), and cyber warfare technologies are transforming military operations and impacting procurement strategies. The integration of these technologies in various segments like communication systems and weapons contributes significantly to the market expansion.
- Shifting Consumer Demands: A preference for customized solutions, enhanced interoperability, and advanced sensor technologies is shaping the supply chain and influencing product development strategies.
Leading Regions, Countries, or Segments in GCC Defense Industry
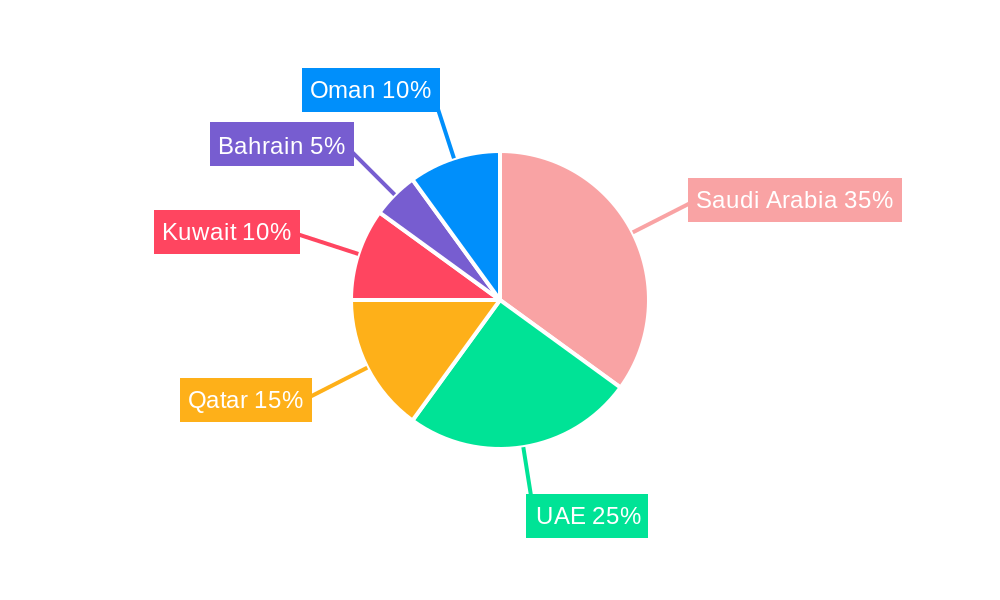
The UAE and Saudi Arabia are the dominant markets within the GCC region, owing to their large defense budgets and significant investments in modernizing their armed forces. The Air Force segment shows the strongest growth due to ongoing modernization programs and procurement of advanced aircraft. Within product segments, Weapons and Ammunition, followed by Air-based Vehicles, constitute the most substantial shares of the market.
- Key Drivers (UAE & Saudi Arabia):
- High defense expenditure
- Strategic geopolitical positioning
- Government support for domestic defense industries
- Dominance Factors (Air Force Segment):
- Modernization programs for fighter jets and air defense systems
- Investments in advanced surveillance and reconnaissance capabilities
- Emphasis on air superiority and power projection
GCC Defense Industry Product Innovations
Recent innovations include the development of advanced communication systems with enhanced encryption and data transmission capabilities, autonomous vehicles for reconnaissance and combat operations, and highly precise, long-range weapons systems. These advancements, combined with improved performance metrics such as increased range, accuracy, and survivability, provide unique selling propositions and redefine operational capabilities.
Propelling Factors for GCC Defense Industry Growth
Technological advancements, particularly in areas such as AI, UAVs, and cybersecurity, significantly contribute to market growth. Economic factors, including rising defense budgets and government investments in infrastructure, are equally important. Furthermore, supportive regulatory environments focused on facilitating domestic industry growth fuel this expansion. The recent agreement between Lockheed Martin and Saudi Arabian companies for THAAD component manufacturing exemplifies such a trend.
Obstacles in the GCC Defense Industry Market
The industry faces several challenges, including regulatory hurdles related to international arms sales and technology transfers, potential supply chain disruptions owing to global geopolitical uncertainties, and fierce competition among both international and regional players. These factors can limit market growth and impact profitability.
Future Opportunities in GCC Defense Industry
Emerging opportunities lie in the development and adoption of autonomous systems, cyber defense solutions, and advanced materials. The growing emphasis on cybersecurity and the increasing demand for tailored defense solutions based on specific needs create exciting new market segments. Exploring strategic partnerships and fostering domestic industry growth can yield significant advantages.
Major Players in the GCC Defense Industry Ecosystem
- L3Harris Technologies Inc
- THALES
- Leonardo SpA
- Rheinmetall AG
- Elbit Systems Ltd
- Lockheed Martin Corporation
- Airbus SE
- ASELSAN AS
- IAI
- BAE Systems PLC
- RTX Corporation
- Dahra Engineering & Security Services LLC
- EDGE Group PJSC
- Saudi Arabian Military Industries (SAMI)
- Northrop Grumman Corporation
- The Boeing Company
Key Developments in GCC Defense Industry Industry
- February 2024: Lockheed Martin Corporation signed an agreement with Saudi Arabian companies to manufacture components of its Terminal High Altitude Area Defense (THAAD) missile defense system. This signifies a substantial shift toward regional manufacturing and collaboration.
- March 2023: Bahrain's announcement regarding the delivery of F-16s in 2024 and 2025 highlights ongoing modernization efforts and the continued demand for advanced fighter aircraft within the GCC region.
Strategic GCC Defense Industry Market Forecast
The GCC defense industry is poised for robust growth, driven by sustained investment in advanced technologies, regional geopolitical dynamics, and a focus on national security. The forecast period (2025-2033) presents significant opportunities for companies that can leverage technological advancements and adapt to the evolving needs of the region's armed forces. The market's expansion will be fueled by the adoption of innovative technologies and a continued focus on enhancing regional defense capabilities.
GCC Defense Industry Segmentation
-
1. Armed Forces
- 1.1. Army
- 1.2. Navy
- 1.3. Air Force
-
2. Type
-
2.1. Personnel Training and Protection
- 2.1.1. Training and Simulation
- 2.1.2. Protection Equipment
- 2.2. Communication Systems
-
2.3. Vehicles
- 2.3.1. Land-based Vehicles
- 2.3.2. Sea-based Vehicles
- 2.3.3. Air-based Vehicles
-
2.4. Weapons and Ammunition
- 2.4.1. Artillery and Mortar Systems
- 2.4.2. Infantry Weapons
- 2.4.3. Missiles and Missile Defense Systems
-
2.1. Personnel Training and Protection
-
3. Geography
- 3.1. Saudi Arabia
- 3.2. United Arab Emirates
- 3.3. Qatar
- 3.4. Kuwait
- 3.5. Bahrain
- 3.6. Oman
GCC Defense Industry Segmentation By Geography
- 1. Saudi Arabia
- 2. United Arab Emirates
- 3. Qatar
- 4. Kuwait
- 5. Bahrain
- 6. Oman
GCC Defense Industry REPORT HIGHLIGHTS
| Aspects | Details |
|---|---|
| Study Period | 2019-2033 |
| Base Year | 2024 |
| Estimated Year | 2025 |
| Forecast Period | 2025-2033 |
| Historical Period | 2019-2024 |
| Growth Rate | CAGR of 11.04% from 2019-2033 |
| Segmentation |
|
Table of Contents
- 1. Introduction
- 1.1. Research Scope
- 1.2. Market Segmentation
- 1.3. Research Methodology
- 1.4. Definitions and Assumptions
- 2. Executive Summary
- 2.1. Introduction
- 3. Market Dynamics
- 3.1. Introduction
- 3.2. Market Drivers
- 3.3. Market Restrains
- 3.4. Market Trends
- 3.4.1. Airforce Segment to Dominate Market Share During the Forecast Period
- 4. Market Factor Analysis
- 4.1. Porters Five Forces
- 4.2. Supply/Value Chain
- 4.3. PESTEL analysis
- 4.4. Market Entropy
- 4.5. Patent/Trademark Analysis
- 5. Global GCC Defense Industry Analysis, Insights and Forecast, 2019-2031
- 5.1. Market Analysis, Insights and Forecast - by Armed Forces
- 5.1.1. Army
- 5.1.2. Navy
- 5.1.3. Air Force
- 5.2. Market Analysis, Insights and Forecast - by Type
- 5.2.1. Personnel Training and Protection
- 5.2.1.1. Training and Simulation
- 5.2.1.2. Protection Equipment
- 5.2.2. Communication Systems
- 5.2.3. Vehicles
- 5.2.3.1. Land-based Vehicles
- 5.2.3.2. Sea-based Vehicles
- 5.2.3.3. Air-based Vehicles
- 5.2.4. Weapons and Ammunition
- 5.2.4.1. Artillery and Mortar Systems
- 5.2.4.2. Infantry Weapons
- 5.2.4.3. Missiles and Missile Defense Systems
- 5.2.1. Personnel Training and Protection
- 5.3. Market Analysis, Insights and Forecast - by Geography
- 5.3.1. Saudi Arabia
- 5.3.2. United Arab Emirates
- 5.3.3. Qatar
- 5.3.4. Kuwait
- 5.3.5. Bahrain
- 5.3.6. Oman
- 5.4. Market Analysis, Insights and Forecast - by Region
- 5.4.1. Saudi Arabia
- 5.4.2. United Arab Emirates
- 5.4.3. Qatar
- 5.4.4. Kuwait
- 5.4.5. Bahrain
- 5.4.6. Oman
- 5.1. Market Analysis, Insights and Forecast - by Armed Forces
- 6. Saudi Arabia GCC Defense Industry Analysis, Insights and Forecast, 2019-2031
- 6.1. Market Analysis, Insights and Forecast - by Armed Forces
- 6.1.1. Army
- 6.1.2. Navy
- 6.1.3. Air Force
- 6.2. Market Analysis, Insights and Forecast - by Type
- 6.2.1. Personnel Training and Protection
- 6.2.1.1. Training and Simulation
- 6.2.1.2. Protection Equipment
- 6.2.2. Communication Systems
- 6.2.3. Vehicles
- 6.2.3.1. Land-based Vehicles
- 6.2.3.2. Sea-based Vehicles
- 6.2.3.3. Air-based Vehicles
- 6.2.4. Weapons and Ammunition
- 6.2.4.1. Artillery and Mortar Systems
- 6.2.4.2. Infantry Weapons
- 6.2.4.3. Missiles and Missile Defense Systems
- 6.2.1. Personnel Training and Protection
- 6.3. Market Analysis, Insights and Forecast - by Geography
- 6.3.1. Saudi Arabia
- 6.3.2. United Arab Emirates
- 6.3.3. Qatar
- 6.3.4. Kuwait
- 6.3.5. Bahrain
- 6.3.6. Oman
- 6.1. Market Analysis, Insights and Forecast - by Armed Forces
- 7. United Arab Emirates GCC Defense Industry Analysis, Insights and Forecast, 2019-2031
- 7.1. Market Analysis, Insights and Forecast - by Armed Forces
- 7.1.1. Army
- 7.1.2. Navy
- 7.1.3. Air Force
- 7.2. Market Analysis, Insights and Forecast - by Type
- 7.2.1. Personnel Training and Protection
- 7.2.1.1. Training and Simulation
- 7.2.1.2. Protection Equipment
- 7.2.2. Communication Systems
- 7.2.3. Vehicles
- 7.2.3.1. Land-based Vehicles
- 7.2.3.2. Sea-based Vehicles
- 7.2.3.3. Air-based Vehicles
- 7.2.4. Weapons and Ammunition
- 7.2.4.1. Artillery and Mortar Systems
- 7.2.4.2. Infantry Weapons
- 7.2.4.3. Missiles and Missile Defense Systems
- 7.2.1. Personnel Training and Protection
- 7.3. Market Analysis, Insights and Forecast - by Geography
- 7.3.1. Saudi Arabia
- 7.3.2. United Arab Emirates
- 7.3.3. Qatar
- 7.3.4. Kuwait
- 7.3.5. Bahrain
- 7.3.6. Oman
- 7.1. Market Analysis, Insights and Forecast - by Armed Forces
- 8. Qatar GCC Defense Industry Analysis, Insights and Forecast, 2019-2031
- 8.1. Market Analysis, Insights and Forecast - by Armed Forces
- 8.1.1. Army
- 8.1.2. Navy
- 8.1.3. Air Force
- 8.2. Market Analysis, Insights and Forecast - by Type
- 8.2.1. Personnel Training and Protection
- 8.2.1.1. Training and Simulation
- 8.2.1.2. Protection Equipment
- 8.2.2. Communication Systems
- 8.2.3. Vehicles
- 8.2.3.1. Land-based Vehicles
- 8.2.3.2. Sea-based Vehicles
- 8.2.3.3. Air-based Vehicles
- 8.2.4. Weapons and Ammunition
- 8.2.4.1. Artillery and Mortar Systems
- 8.2.4.2. Infantry Weapons
- 8.2.4.3. Missiles and Missile Defense Systems
- 8.2.1. Personnel Training and Protection
- 8.3. Market Analysis, Insights and Forecast - by Geography
- 8.3.1. Saudi Arabia
- 8.3.2. United Arab Emirates
- 8.3.3. Qatar
- 8.3.4. Kuwait
- 8.3.5. Bahrain
- 8.3.6. Oman
- 8.1. Market Analysis, Insights and Forecast - by Armed Forces
- 9. Kuwait GCC Defense Industry Analysis, Insights and Forecast, 2019-2031
- 9.1. Market Analysis, Insights and Forecast - by Armed Forces
- 9.1.1. Army
- 9.1.2. Navy
- 9.1.3. Air Force
- 9.2. Market Analysis, Insights and Forecast - by Type
- 9.2.1. Personnel Training and Protection
- 9.2.1.1. Training and Simulation
- 9.2.1.2. Protection Equipment
- 9.2.2. Communication Systems
- 9.2.3. Vehicles
- 9.2.3.1. Land-based Vehicles
- 9.2.3.2. Sea-based Vehicles
- 9.2.3.3. Air-based Vehicles
- 9.2.4. Weapons and Ammunition
- 9.2.4.1. Artillery and Mortar Systems
- 9.2.4.2. Infantry Weapons
- 9.2.4.3. Missiles and Missile Defense Systems
- 9.2.1. Personnel Training and Protection
- 9.3. Market Analysis, Insights and Forecast - by Geography
- 9.3.1. Saudi Arabia
- 9.3.2. United Arab Emirates
- 9.3.3. Qatar
- 9.3.4. Kuwait
- 9.3.5. Bahrain
- 9.3.6. Oman
- 9.1. Market Analysis, Insights and Forecast - by Armed Forces
- 10. Bahrain GCC Defense Industry Analysis, Insights and Forecast, 2019-2031
- 10.1. Market Analysis, Insights and Forecast - by Armed Forces
- 10.1.1. Army
- 10.1.2. Navy
- 10.1.3. Air Force
- 10.2. Market Analysis, Insights and Forecast - by Type
- 10.2.1. Personnel Training and Protection
- 10.2.1.1. Training and Simulation
- 10.2.1.2. Protection Equipment
- 10.2.2. Communication Systems
- 10.2.3. Vehicles
- 10.2.3.1. Land-based Vehicles
- 10.2.3.2. Sea-based Vehicles
- 10.2.3.3. Air-based Vehicles
- 10.2.4. Weapons and Ammunition
- 10.2.4.1. Artillery and Mortar Systems
- 10.2.4.2. Infantry Weapons
- 10.2.4.3. Missiles and Missile Defense Systems
- 10.2.1. Personnel Training and Protection
- 10.3. Market Analysis, Insights and Forecast - by Geography
- 10.3.1. Saudi Arabia
- 10.3.2. United Arab Emirates
- 10.3.3. Qatar
- 10.3.4. Kuwait
- 10.3.5. Bahrain
- 10.3.6. Oman
- 10.1. Market Analysis, Insights and Forecast - by Armed Forces
- 11. Oman GCC Defense Industry Analysis, Insights and Forecast, 2019-2031
- 11.1. Market Analysis, Insights and Forecast - by Armed Forces
- 11.1.1. Army
- 11.1.2. Navy
- 11.1.3. Air Force
- 11.2. Market Analysis, Insights and Forecast - by Type
- 11.2.1. Personnel Training and Protection
- 11.2.1.1. Training and Simulation
- 11.2.1.2. Protection Equipment
- 11.2.2. Communication Systems
- 11.2.3. Vehicles
- 11.2.3.1. Land-based Vehicles
- 11.2.3.2. Sea-based Vehicles
- 11.2.3.3. Air-based Vehicles
- 11.2.4. Weapons and Ammunition
- 11.2.4.1. Artillery and Mortar Systems
- 11.2.4.2. Infantry Weapons
- 11.2.4.3. Missiles and Missile Defense Systems
- 11.2.1. Personnel Training and Protection
- 11.3. Market Analysis, Insights and Forecast - by Geography
- 11.3.1. Saudi Arabia
- 11.3.2. United Arab Emirates
- 11.3.3. Qatar
- 11.3.4. Kuwait
- 11.3.5. Bahrain
- 11.3.6. Oman
- 11.1. Market Analysis, Insights and Forecast - by Armed Forces
- 12. Saudi Arabia GCC Defense Industry Analysis, Insights and Forecast, 2019-2031
- 12.1. Market Analysis, Insights and Forecast - By Country/Sub-region
- 12.1.1.
- 13. United Arab Emirates GCC Defense Industry Analysis, Insights and Forecast, 2019-2031
- 13.1. Market Analysis, Insights and Forecast - By Country/Sub-region
- 13.1.1.
- 14. Qatar GCC Defense Industry Analysis, Insights and Forecast, 2019-2031
- 14.1. Market Analysis, Insights and Forecast - By Country/Sub-region
- 14.1.1.
- 15. Kuwait GCC Defense Industry Analysis, Insights and Forecast, 2019-2031
- 15.1. Market Analysis, Insights and Forecast - By Country/Sub-region
- 15.1.1.
- 16. Bahrain GCC Defense Industry Analysis, Insights and Forecast, 2019-2031
- 16.1. Market Analysis, Insights and Forecast - By Country/Sub-region
- 16.1.1.
- 17. Oman GCC Defense Industry Analysis, Insights and Forecast, 2019-2031
- 17.1. Market Analysis, Insights and Forecast - By Country/Sub-region
- 17.1.1.
- 18. Competitive Analysis
- 18.1. Global Market Share Analysis 2024
- 18.2. Company Profiles
- 18.2.1 L3Harris Technologies Inc
- 18.2.1.1. Overview
- 18.2.1.2. Products
- 18.2.1.3. SWOT Analysis
- 18.2.1.4. Recent Developments
- 18.2.1.5. Financials (Based on Availability)
- 18.2.2 THALES
- 18.2.2.1. Overview
- 18.2.2.2. Products
- 18.2.2.3. SWOT Analysis
- 18.2.2.4. Recent Developments
- 18.2.2.5. Financials (Based on Availability)
- 18.2.3 Leonardo SpA
- 18.2.3.1. Overview
- 18.2.3.2. Products
- 18.2.3.3. SWOT Analysis
- 18.2.3.4. Recent Developments
- 18.2.3.5. Financials (Based on Availability)
- 18.2.4 Rheinmetall AG
- 18.2.4.1. Overview
- 18.2.4.2. Products
- 18.2.4.3. SWOT Analysis
- 18.2.4.4. Recent Developments
- 18.2.4.5. Financials (Based on Availability)
- 18.2.5 Elbit Systems Ltd
- 18.2.5.1. Overview
- 18.2.5.2. Products
- 18.2.5.3. SWOT Analysis
- 18.2.5.4. Recent Developments
- 18.2.5.5. Financials (Based on Availability)
- 18.2.6 Lockheed Martin Corporation
- 18.2.6.1. Overview
- 18.2.6.2. Products
- 18.2.6.3. SWOT Analysis
- 18.2.6.4. Recent Developments
- 18.2.6.5. Financials (Based on Availability)
- 18.2.7 Airbus SE
- 18.2.7.1. Overview
- 18.2.7.2. Products
- 18.2.7.3. SWOT Analysis
- 18.2.7.4. Recent Developments
- 18.2.7.5. Financials (Based on Availability)
- 18.2.8 ASELSAN AS
- 18.2.8.1. Overview
- 18.2.8.2. Products
- 18.2.8.3. SWOT Analysis
- 18.2.8.4. Recent Developments
- 18.2.8.5. Financials (Based on Availability)
- 18.2.9 IAI
- 18.2.9.1. Overview
- 18.2.9.2. Products
- 18.2.9.3. SWOT Analysis
- 18.2.9.4. Recent Developments
- 18.2.9.5. Financials (Based on Availability)
- 18.2.10 BAE Systems PLC
- 18.2.10.1. Overview
- 18.2.10.2. Products
- 18.2.10.3. SWOT Analysis
- 18.2.10.4. Recent Developments
- 18.2.10.5. Financials (Based on Availability)
- 18.2.11 RTX Corporation
- 18.2.11.1. Overview
- 18.2.11.2. Products
- 18.2.11.3. SWOT Analysis
- 18.2.11.4. Recent Developments
- 18.2.11.5. Financials (Based on Availability)
- 18.2.12 Dahra Engineering & Security Services LLC
- 18.2.12.1. Overview
- 18.2.12.2. Products
- 18.2.12.3. SWOT Analysis
- 18.2.12.4. Recent Developments
- 18.2.12.5. Financials (Based on Availability)
- 18.2.13 EDGE Group PJSC
- 18.2.13.1. Overview
- 18.2.13.2. Products
- 18.2.13.3. SWOT Analysis
- 18.2.13.4. Recent Developments
- 18.2.13.5. Financials (Based on Availability)
- 18.2.14 Saudi Arabian Military Industries (SAMI
- 18.2.14.1. Overview
- 18.2.14.2. Products
- 18.2.14.3. SWOT Analysis
- 18.2.14.4. Recent Developments
- 18.2.14.5. Financials (Based on Availability)
- 18.2.15 Northrop Grumman Corporation
- 18.2.15.1. Overview
- 18.2.15.2. Products
- 18.2.15.3. SWOT Analysis
- 18.2.15.4. Recent Developments
- 18.2.15.5. Financials (Based on Availability)
- 18.2.16 The Boeing Company
- 18.2.16.1. Overview
- 18.2.16.2. Products
- 18.2.16.3. SWOT Analysis
- 18.2.16.4. Recent Developments
- 18.2.16.5. Financials (Based on Availability)
- 18.2.1 L3Harris Technologies Inc
List of Figures
- Figure 1: Global GCC Defense Industry Revenue Breakdown (Million, %) by Region 2024 & 2032
- Figure 2: Saudi Arabia GCC Defense Industry Revenue (Million), by Country 2024 & 2032
- Figure 3: Saudi Arabia GCC Defense Industry Revenue Share (%), by Country 2024 & 2032
- Figure 4: United Arab Emirates GCC Defense Industry Revenue (Million), by Country 2024 & 2032
- Figure 5: United Arab Emirates GCC Defense Industry Revenue Share (%), by Country 2024 & 2032
- Figure 6: Qatar GCC Defense Industry Revenue (Million), by Country 2024 & 2032
- Figure 7: Qatar GCC Defense Industry Revenue Share (%), by Country 2024 & 2032
- Figure 8: Kuwait GCC Defense Industry Revenue (Million), by Country 2024 & 2032
- Figure 9: Kuwait GCC Defense Industry Revenue Share (%), by Country 2024 & 2032
- Figure 10: Bahrain GCC Defense Industry Revenue (Million), by Country 2024 & 2032
- Figure 11: Bahrain GCC Defense Industry Revenue Share (%), by Country 2024 & 2032
- Figure 12: Oman GCC Defense Industry Revenue (Million), by Country 2024 & 2032
- Figure 13: Oman GCC Defense Industry Revenue Share (%), by Country 2024 & 2032
- Figure 14: Saudi Arabia GCC Defense Industry Revenue (Million), by Armed Forces 2024 & 2032
- Figure 15: Saudi Arabia GCC Defense Industry Revenue Share (%), by Armed Forces 2024 & 2032
- Figure 16: Saudi Arabia GCC Defense Industry Revenue (Million), by Type 2024 & 2032
- Figure 17: Saudi Arabia GCC Defense Industry Revenue Share (%), by Type 2024 & 2032
- Figure 18: Saudi Arabia GCC Defense Industry Revenue (Million), by Geography 2024 & 2032
- Figure 19: Saudi Arabia GCC Defense Industry Revenue Share (%), by Geography 2024 & 2032
- Figure 20: Saudi Arabia GCC Defense Industry Revenue (Million), by Country 2024 & 2032
- Figure 21: Saudi Arabia GCC Defense Industry Revenue Share (%), by Country 2024 & 2032
- Figure 22: United Arab Emirates GCC Defense Industry Revenue (Million), by Armed Forces 2024 & 2032
- Figure 23: United Arab Emirates GCC Defense Industry Revenue Share (%), by Armed Forces 2024 & 2032
- Figure 24: United Arab Emirates GCC Defense Industry Revenue (Million), by Type 2024 & 2032
- Figure 25: United Arab Emirates GCC Defense Industry Revenue Share (%), by Type 2024 & 2032
- Figure 26: United Arab Emirates GCC Defense Industry Revenue (Million), by Geography 2024 & 2032
- Figure 27: United Arab Emirates GCC Defense Industry Revenue Share (%), by Geography 2024 & 2032
- Figure 28: United Arab Emirates GCC Defense Industry Revenue (Million), by Country 2024 & 2032
- Figure 29: United Arab Emirates GCC Defense Industry Revenue Share (%), by Country 2024 & 2032
- Figure 30: Qatar GCC Defense Industry Revenue (Million), by Armed Forces 2024 & 2032
- Figure 31: Qatar GCC Defense Industry Revenue Share (%), by Armed Forces 2024 & 2032
- Figure 32: Qatar GCC Defense Industry Revenue (Million), by Type 2024 & 2032
- Figure 33: Qatar GCC Defense Industry Revenue Share (%), by Type 2024 & 2032
- Figure 34: Qatar GCC Defense Industry Revenue (Million), by Geography 2024 & 2032
- Figure 35: Qatar GCC Defense Industry Revenue Share (%), by Geography 2024 & 2032
- Figure 36: Qatar GCC Defense Industry Revenue (Million), by Country 2024 & 2032
- Figure 37: Qatar GCC Defense Industry Revenue Share (%), by Country 2024 & 2032
- Figure 38: Kuwait GCC Defense Industry Revenue (Million), by Armed Forces 2024 & 2032
- Figure 39: Kuwait GCC Defense Industry Revenue Share (%), by Armed Forces 2024 & 2032
- Figure 40: Kuwait GCC Defense Industry Revenue (Million), by Type 2024 & 2032
- Figure 41: Kuwait GCC Defense Industry Revenue Share (%), by Type 2024 & 2032
- Figure 42: Kuwait GCC Defense Industry Revenue (Million), by Geography 2024 & 2032
- Figure 43: Kuwait GCC Defense Industry Revenue Share (%), by Geography 2024 & 2032
- Figure 44: Kuwait GCC Defense Industry Revenue (Million), by Country 2024 & 2032
- Figure 45: Kuwait GCC Defense Industry Revenue Share (%), by Country 2024 & 2032
- Figure 46: Bahrain GCC Defense Industry Revenue (Million), by Armed Forces 2024 & 2032
- Figure 47: Bahrain GCC Defense Industry Revenue Share (%), by Armed Forces 2024 & 2032
- Figure 48: Bahrain GCC Defense Industry Revenue (Million), by Type 2024 & 2032
- Figure 49: Bahrain GCC Defense Industry Revenue Share (%), by Type 2024 & 2032
- Figure 50: Bahrain GCC Defense Industry Revenue (Million), by Geography 2024 & 2032
- Figure 51: Bahrain GCC Defense Industry Revenue Share (%), by Geography 2024 & 2032
- Figure 52: Bahrain GCC Defense Industry Revenue (Million), by Country 2024 & 2032
- Figure 53: Bahrain GCC Defense Industry Revenue Share (%), by Country 2024 & 2032
- Figure 54: Oman GCC Defense Industry Revenue (Million), by Armed Forces 2024 & 2032
- Figure 55: Oman GCC Defense Industry Revenue Share (%), by Armed Forces 2024 & 2032
- Figure 56: Oman GCC Defense Industry Revenue (Million), by Type 2024 & 2032
- Figure 57: Oman GCC Defense Industry Revenue Share (%), by Type 2024 & 2032
- Figure 58: Oman GCC Defense Industry Revenue (Million), by Geography 2024 & 2032
- Figure 59: Oman GCC Defense Industry Revenue Share (%), by Geography 2024 & 2032
- Figure 60: Oman GCC Defense Industry Revenue (Million), by Country 2024 & 2032
- Figure 61: Oman GCC Defense Industry Revenue Share (%), by Country 2024 & 2032
List of Tables
- Table 1: Global GCC Defense Industry Revenue Million Forecast, by Region 2019 & 2032
- Table 2: Global GCC Defense Industry Revenue Million Forecast, by Armed Forces 2019 & 2032
- Table 3: Global GCC Defense Industry Revenue Million Forecast, by Type 2019 & 2032
- Table 4: Global GCC Defense Industry Revenue Million Forecast, by Geography 2019 & 2032
- Table 5: Global GCC Defense Industry Revenue Million Forecast, by Region 2019 & 2032
- Table 6: Global GCC Defense Industry Revenue Million Forecast, by Country 2019 & 2032
- Table 7: GCC Defense Industry Revenue (Million) Forecast, by Application 2019 & 2032
- Table 8: Global GCC Defense Industry Revenue Million Forecast, by Country 2019 & 2032
- Table 9: GCC Defense Industry Revenue (Million) Forecast, by Application 2019 & 2032
- Table 10: Global GCC Defense Industry Revenue Million Forecast, by Country 2019 & 2032
- Table 11: GCC Defense Industry Revenue (Million) Forecast, by Application 2019 & 2032
- Table 12: Global GCC Defense Industry Revenue Million Forecast, by Country 2019 & 2032
- Table 13: GCC Defense Industry Revenue (Million) Forecast, by Application 2019 & 2032
- Table 14: Global GCC Defense Industry Revenue Million Forecast, by Country 2019 & 2032
- Table 15: GCC Defense Industry Revenue (Million) Forecast, by Application 2019 & 2032
- Table 16: Global GCC Defense Industry Revenue Million Forecast, by Country 2019 & 2032
- Table 17: GCC Defense Industry Revenue (Million) Forecast, by Application 2019 & 2032
- Table 18: Global GCC Defense Industry Revenue Million Forecast, by Armed Forces 2019 & 2032
- Table 19: Global GCC Defense Industry Revenue Million Forecast, by Type 2019 & 2032
- Table 20: Global GCC Defense Industry Revenue Million Forecast, by Geography 2019 & 2032
- Table 21: Global GCC Defense Industry Revenue Million Forecast, by Country 2019 & 2032
- Table 22: Global GCC Defense Industry Revenue Million Forecast, by Armed Forces 2019 & 2032
- Table 23: Global GCC Defense Industry Revenue Million Forecast, by Type 2019 & 2032
- Table 24: Global GCC Defense Industry Revenue Million Forecast, by Geography 2019 & 2032
- Table 25: Global GCC Defense Industry Revenue Million Forecast, by Country 2019 & 2032
- Table 26: Global GCC Defense Industry Revenue Million Forecast, by Armed Forces 2019 & 2032
- Table 27: Global GCC Defense Industry Revenue Million Forecast, by Type 2019 & 2032
- Table 28: Global GCC Defense Industry Revenue Million Forecast, by Geography 2019 & 2032
- Table 29: Global GCC Defense Industry Revenue Million Forecast, by Country 2019 & 2032
- Table 30: Global GCC Defense Industry Revenue Million Forecast, by Armed Forces 2019 & 2032
- Table 31: Global GCC Defense Industry Revenue Million Forecast, by Type 2019 & 2032
- Table 32: Global GCC Defense Industry Revenue Million Forecast, by Geography 2019 & 2032
- Table 33: Global GCC Defense Industry Revenue Million Forecast, by Country 2019 & 2032
- Table 34: Global GCC Defense Industry Revenue Million Forecast, by Armed Forces 2019 & 2032
- Table 35: Global GCC Defense Industry Revenue Million Forecast, by Type 2019 & 2032
- Table 36: Global GCC Defense Industry Revenue Million Forecast, by Geography 2019 & 2032
- Table 37: Global GCC Defense Industry Revenue Million Forecast, by Country 2019 & 2032
- Table 38: Global GCC Defense Industry Revenue Million Forecast, by Armed Forces 2019 & 2032
- Table 39: Global GCC Defense Industry Revenue Million Forecast, by Type 2019 & 2032
- Table 40: Global GCC Defense Industry Revenue Million Forecast, by Geography 2019 & 2032
- Table 41: Global GCC Defense Industry Revenue Million Forecast, by Country 2019 & 2032
Frequently Asked Questions
1. What is the projected Compound Annual Growth Rate (CAGR) of the GCC Defense Industry?
The projected CAGR is approximately 11.04%.
2. Which companies are prominent players in the GCC Defense Industry?
Key companies in the market include L3Harris Technologies Inc, THALES, Leonardo SpA, Rheinmetall AG, Elbit Systems Ltd, Lockheed Martin Corporation, Airbus SE, ASELSAN AS, IAI, BAE Systems PLC, RTX Corporation, Dahra Engineering & Security Services LLC, EDGE Group PJSC, Saudi Arabian Military Industries (SAMI, Northrop Grumman Corporation, The Boeing Company.
3. What are the main segments of the GCC Defense Industry?
The market segments include Armed Forces, Type, Geography.
4. Can you provide details about the market size?
The market size is estimated to be USD 29.73 Million as of 2022.
5. What are some drivers contributing to market growth?
N/A
6. What are the notable trends driving market growth?
Airforce Segment to Dominate Market Share During the Forecast Period.
7. Are there any restraints impacting market growth?
N/A
8. Can you provide examples of recent developments in the market?
February 2024: Lockheed Martin Corporation signed an agreement with Saudi Arabian companies to manufacture components of its Terminal High Altitude Area Defense (THAAD) missile defense system. This move comes as the United States continues to conduct military operations in the Middle East.
9. What pricing options are available for accessing the report?
Pricing options include single-user, multi-user, and enterprise licenses priced at USD 4750, USD 5250, and USD 8750 respectively.
10. Is the market size provided in terms of value or volume?
The market size is provided in terms of value, measured in Million.
11. Are there any specific market keywords associated with the report?
Yes, the market keyword associated with the report is "GCC Defense Industry," which aids in identifying and referencing the specific market segment covered.
12. How do I determine which pricing option suits my needs best?
The pricing options vary based on user requirements and access needs. Individual users may opt for single-user licenses, while businesses requiring broader access may choose multi-user or enterprise licenses for cost-effective access to the report.
13. Are there any additional resources or data provided in the GCC Defense Industry report?
While the report offers comprehensive insights, it's advisable to review the specific contents or supplementary materials provided to ascertain if additional resources or data are available.
14. How can I stay updated on further developments or reports in the GCC Defense Industry?
To stay informed about further developments, trends, and reports in the GCC Defense Industry, consider subscribing to industry newsletters, following relevant companies and organizations, or regularly checking reputable industry news sources and publications.
Methodology
Step 1 - Identification of Relevant Samples Size from Population Database


Step 2 - Approaches for Defining Global Market Size (Value, Volume* & Price*)

Note*: In applicable scenarios
Step 3 - Data Sources
Primary Research
- Web Analytics
- Survey Reports
- Research Institute
- Latest Research Reports
- Opinion Leaders
Secondary Research
- Annual Reports
- White Paper
- Latest Press Release
- Industry Association
- Paid Database
- Investor Presentations

Step 4 - Data Triangulation
Involves using different sources of information in order to increase the validity of a study
These sources are likely to be stakeholders in a program - participants, other researchers, program staff, other community members, and so on.
Then we put all data in single framework & apply various statistical tools to find out the dynamic on the market.
During the analysis stage, feedback from the stakeholder groups would be compared to determine areas of agreement as well as areas of divergence
