

Key Insights
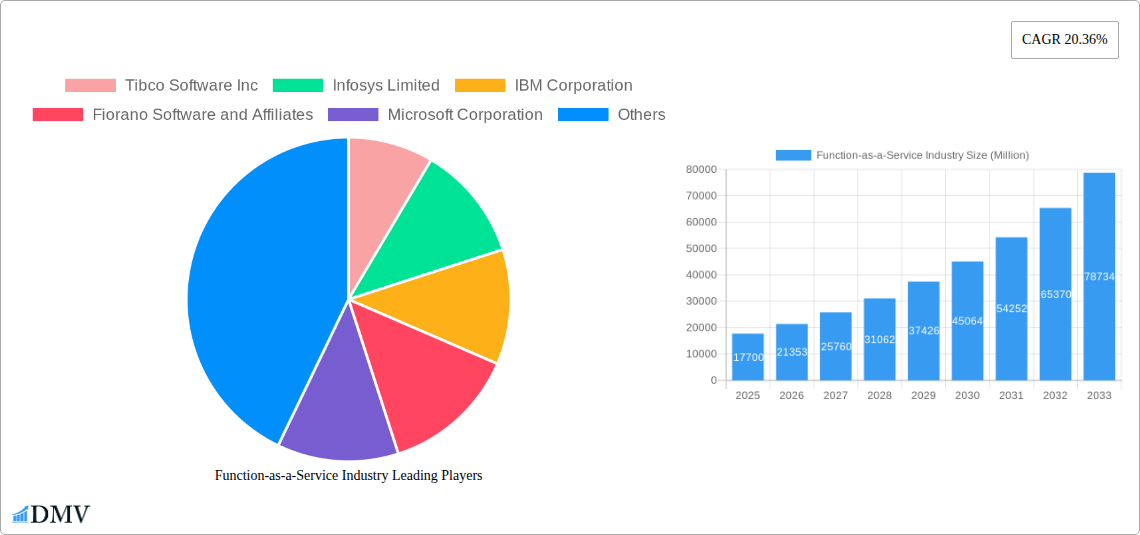
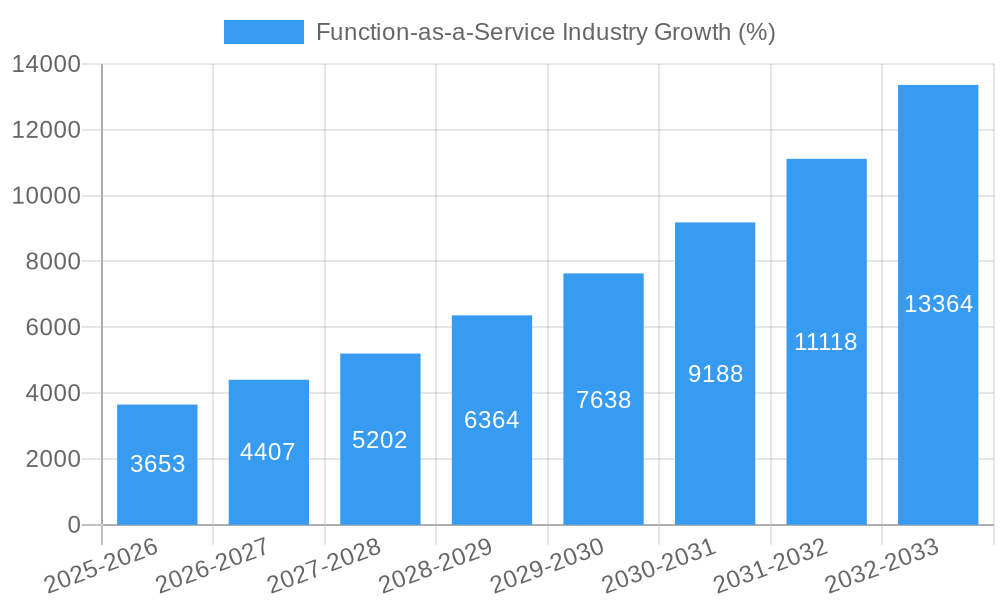
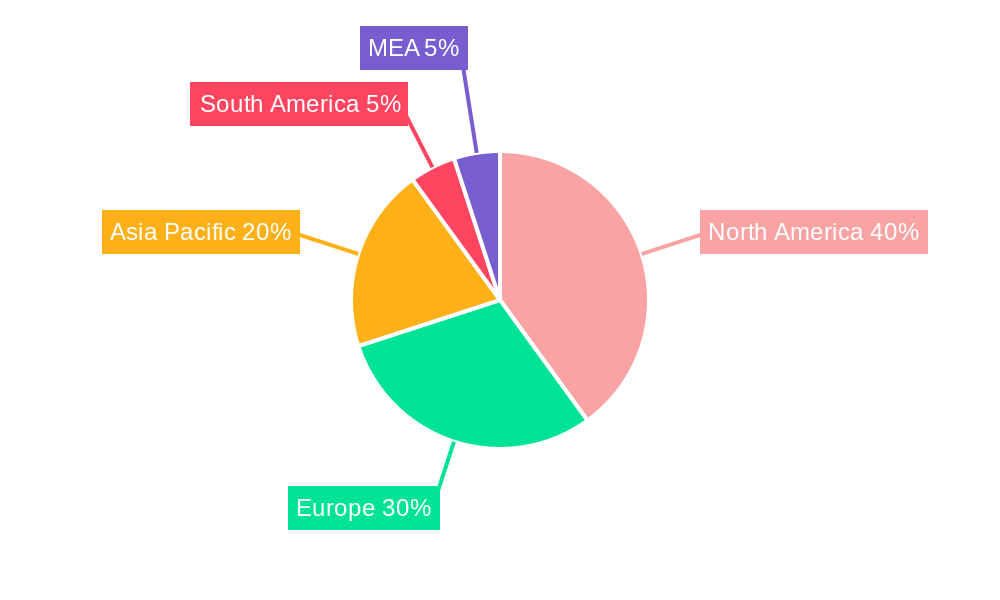
The Function-as-a-Service (FaaS) market is experiencing robust growth, projected to reach \$17.70 billion in 2025 and expand at a Compound Annual Growth Rate (CAGR) of 20.36% from 2025 to 2033. This significant expansion is driven by several key factors. Firstly, the increasing adoption of cloud-native architectures and microservices is fueling demand for FaaS solutions, offering developers agility, scalability, and cost-effectiveness. Secondly, the rise of serverless computing, facilitated by FaaS platforms, enables businesses to focus on application development rather than infrastructure management, leading to faster deployment cycles and reduced operational overhead. Furthermore, the growing need for real-time data processing and event-driven architectures is boosting the adoption of FaaS across diverse industries. Major players like Amazon Web Services, Microsoft Azure, and Google Cloud Platform are heavily investing in their FaaS offerings, further driving market growth. The segmentation reveals a significant contribution from large enterprises across various sectors, including BFSI, IT & Telecommunications, and Retail, driven by their need for scalable and cost-efficient solutions. North America and Europe currently dominate the market due to high cloud adoption rates and robust digital infrastructure, but the Asia-Pacific region is projected to witness rapid growth, fueled by increasing digitalization initiatives in countries like India and China.
The market's growth trajectory is expected to continue, propelled by further technological advancements in areas like AI integration within FaaS platforms and improved security measures. However, challenges remain, including concerns about vendor lock-in, potential complexities in managing serverless functions, and the need for skilled developers proficient in serverless technologies. Despite these hurdles, the inherent benefits of FaaS—cost optimization, improved scalability, and reduced operational burden—make it a compelling solution for businesses seeking to leverage the full potential of cloud computing. This consistent demand, coupled with ongoing innovation, ensures a bright future for the FaaS market, even with the anticipated emergence of new challenges and competitive dynamics. The ongoing expansion into emerging markets and the continued development of more user-friendly tools will only accelerate this growth.
Function-as-a-Service (FaaS) Industry Market Report: 2019-2033
This comprehensive report provides an in-depth analysis of the Function-as-a-Service (FaaS) industry, offering valuable insights for stakeholders seeking to understand market dynamics, future trends, and investment opportunities. The report covers the period from 2019 to 2033, with a focus on the estimated year 2025. The FaaS market, projected to reach xx Million by 2033, is experiencing significant growth driven by technological advancements and increasing cloud adoption across various sectors. This report analyzes key players, market segments, and future growth potential, providing critical information for strategic decision-making.
Function-as-a-Service Industry Market Composition & Trends
The FaaS market is characterized by a dynamic competitive landscape with several major players vying for market share. Market concentration is moderate, with a few dominant players like Amazon Web Services, Microsoft Azure, and Google Cloud Platform holding significant shares. However, numerous smaller players contribute to the overall market vibrancy. Innovation is a key catalyst, with ongoing advancements in serverless computing, containerization, and AI/ML integration driving market growth. The regulatory landscape varies by region, influencing data privacy and security standards. Substitute products, such as traditional on-premise infrastructure, are facing declining relevance due to the cost-effectiveness and scalability offered by FaaS. End-user profiles are diverse, encompassing small and medium enterprises (SMEs), large enterprises, and various industry verticals. M&A activity is prevalent, with major players consolidating market share through acquisitions. Examples include Microsoft's acquisition of Nuance Communications.
- Market Share Distribution (2025 Estimate): AWS: 40%, Microsoft Azure: 30%, Google Cloud: 15%, Others: 15%
- M&A Deal Value (2019-2024): xx Million
- Key End-Users: BFSI, IT & Telecommunication, Retail, Healthcare & Life Sciences
Function-as-a-Service Industry Industry Evolution
The FaaS industry has witnessed remarkable evolution since its inception. Market growth trajectories exhibit a strong upward trend, fueled by increasing demand for agility, scalability, and cost optimization. Technological advancements, such as the rise of serverless architectures and improved container orchestration, have significantly accelerated FaaS adoption. Shifting consumer demands towards faster deployment cycles, improved resource utilization, and reduced operational overhead further contribute to market expansion. The compound annual growth rate (CAGR) for the period 2025-2033 is projected to be xx%. Adoption metrics indicate a significant increase in the number of enterprises leveraging FaaS for various applications. The transition from traditional IT infrastructure to cloud-based services, driven by digital transformation initiatives, plays a pivotal role in this growth. Improved developer productivity, faster time-to-market, and the pay-as-you-go pricing model have made FaaS an attractive proposition for businesses of all sizes. The integration of FaaS with other cloud services and technologies has further broadened its applications.
Leading Regions, Countries, or Segments in Function-as-a-Service Industry
The North American region currently dominates the FaaS market, driven by high cloud adoption rates, robust technological infrastructure, and the presence of major cloud providers. Within this region, the United States is the largest market. Other regions, such as Europe and Asia-Pacific, are experiencing significant growth, although at a slower pace compared to North America.
- By Type of Cloud Deployment: Public cloud deployments lead due to their ease of access and scalability.
- By Organization Size: Large enterprises are the primary adopters due to their higher IT budgets and complex requirements.
- By End-User: The BFSI and IT & Telecommunication sectors are leading adopters owing to their critical reliance on technology and data processing.
Key Drivers:
- High Investment in Cloud Infrastructure: Continued investment from major cloud providers in building and enhancing their FaaS offerings.
- Government Initiatives: Regulatory support promoting cloud adoption within various sectors.
- Strong Demand from Enterprises: The increasing need for scalability, agility, and cost optimization among businesses.
Function-as-a-Service Industry Product Innovations
Recent product innovations in FaaS include advancements in serverless frameworks, improved integration with other cloud services, enhanced security features, and the development of specialized FaaS offerings tailored to specific industry needs. These advancements enhance functionality, improve performance, and increase the overall value proposition of FaaS platforms. Unique selling propositions frequently focus on scalability, cost-effectiveness, reduced operational overhead, and improved developer productivity. Technological advancements such as AI/ML integration further enhance the capabilities of FaaS platforms.
Propelling Factors for Function-as-a-Service Industry Growth
Technological advancements in serverless computing, containerization, and microservices architectures are major growth drivers. Economic factors, such as cost savings achieved through pay-as-you-go pricing and improved resource utilization, are significant incentives for adoption. Favorable regulatory environments promoting cloud adoption and data privacy regulations further accelerate market growth.
Obstacles in the Function-as-a-Service Industry Market
Regulatory challenges related to data security and compliance can hinder widespread adoption. Supply chain disruptions, particularly impacting hardware components essential for cloud infrastructure, can lead to service delays. Intense competition among major cloud providers creates pricing pressures and necessitates continuous innovation.
Future Opportunities in Function-as-a-Service Industry
Emerging opportunities include the expansion of FaaS into new geographical markets, particularly developing economies. Further technological innovations, such as edge computing and quantum computing, can create new FaaS applications. Growing demand for AI-powered FaaS solutions and the increasing use of serverless functions in IoT applications presents substantial potential.
Major Players in the Function-as-a-Service Industry Ecosystem
- Tibco Software Inc
- Infosys Limited
- IBM Corporation
- Fiorano Software and Affiliates
- Microsoft Corporation
- Amazon Web Services Inc
- Oracle Corporation
- Rogue Wave Software Inc
- Google Inc
- Dynatrace LLC
- SAP SE
Key Developments in Function-as-a-Service Industry Industry
- March 2022: Microsoft Corp. launched developments in cloud technology for healthcare and life sciences, enhancing Microsoft Cloud for Healthcare and releasing Azure Health Data Services. This broadened Microsoft's capabilities in this critical sector, leveraging AI to address challenging healthcare problems.
- July 2022: Rackspace Technology launched the Rackspace Technology Cloud DNS v2 API, improving developer efficiency and scalability. This enhanced API provided developers with more capabilities and improved error handling.
- November 2022: Hewlett Packard Enterprise and VMware announced the next phase of their partnership, integrating HPE GreenLake and VMware Cloud to deliver a fully integrated hybrid cloud solution with a simple pay-as-you-go model. This strengthened their market position in hybrid cloud offerings.
- December 2022: Tech Mahindra launched Cloud BlazeTech, an integrated platform aimed at optimizing economic value for cloud-powered organizations. This further solidifies Tech Mahindra's presence in the cloud services space.
Strategic Function-as-a-Service Industry Market Forecast
The FaaS market is poised for continued strong growth, driven by increasing cloud adoption, technological advancements, and expanding applications across diverse industries. Future opportunities lie in the development of specialized FaaS offerings catering to specific industry needs, expansion into new geographical markets, and the integration of emerging technologies like AI and edge computing. The market's potential is vast, with considerable room for innovation and growth in the coming years. This will lead to a significant increase in market value, positioning FaaS as a cornerstone of modern cloud computing.
Function-as-a-Service Industry Segmentation
-
1. Type of Cloud Deployment
- 1.1. Public
- 1.2. Private
- 1.3. Hybrid
-
2. Organization Size
- 2.1. Small and Medium Enterprises
- 2.2. Large Enterprises
-
3. End-User
- 3.1. BFSI
- 3.2. IT and Telecommunication
- 3.3. Retail
- 3.4. Healthcare and Life Sciences
- 3.5. Other En
Function-as-a-Service Industry Segmentation By Geography
- 1. North America
- 2. Europe
- 3. Asia Pacific
- 4. Rest of the World
Function-as-a-Service Industry REPORT HIGHLIGHTS
| Aspects | Details |
|---|---|
| Study Period | 2019-2033 |
| Base Year | 2024 |
| Estimated Year | 2025 |
| Forecast Period | 2025-2033 |
| Historical Period | 2019-2024 |
| Growth Rate | CAGR of 20.36% from 2019-2033 |
| Segmentation |
|
Table of Contents
- 1. Introduction
- 1.1. Research Scope
- 1.2. Market Segmentation
- 1.3. Research Methodology
- 1.4. Definitions and Assumptions
- 2. Executive Summary
- 2.1. Introduction
- 3. Market Dynamics
- 3.1. Introduction
- 3.2. Market Drivers
- 3.2.1. Growing shift towards serverless computing; Increasing focus towards agility of infrastructure and cost reduction
- 3.3. Market Restrains
- 3.3.1. Incompatibility of some applications with cloud environment
- 3.4. Market Trends
- 3.4.1. Hybrid Cloud to Drive the Growth of the Market for Security and Privacy Concerned End Users
- 4. Market Factor Analysis
- 4.1. Porters Five Forces
- 4.2. Supply/Value Chain
- 4.3. PESTEL analysis
- 4.4. Market Entropy
- 4.5. Patent/Trademark Analysis
- 5. Global Function-as-a-Service Industry Analysis, Insights and Forecast, 2019-2031
- 5.1. Market Analysis, Insights and Forecast - by Type of Cloud Deployment
- 5.1.1. Public
- 5.1.2. Private
- 5.1.3. Hybrid
- 5.2. Market Analysis, Insights and Forecast - by Organization Size
- 5.2.1. Small and Medium Enterprises
- 5.2.2. Large Enterprises
- 5.3. Market Analysis, Insights and Forecast - by End-User
- 5.3.1. BFSI
- 5.3.2. IT and Telecommunication
- 5.3.3. Retail
- 5.3.4. Healthcare and Life Sciences
- 5.3.5. Other En
- 5.4. Market Analysis, Insights and Forecast - by Region
- 5.4.1. North America
- 5.4.2. Europe
- 5.4.3. Asia Pacific
- 5.4.4. Rest of the World
- 5.1. Market Analysis, Insights and Forecast - by Type of Cloud Deployment
- 6. North America Function-as-a-Service Industry Analysis, Insights and Forecast, 2019-2031
- 6.1. Market Analysis, Insights and Forecast - by Type of Cloud Deployment
- 6.1.1. Public
- 6.1.2. Private
- 6.1.3. Hybrid
- 6.2. Market Analysis, Insights and Forecast - by Organization Size
- 6.2.1. Small and Medium Enterprises
- 6.2.2. Large Enterprises
- 6.3. Market Analysis, Insights and Forecast - by End-User
- 6.3.1. BFSI
- 6.3.2. IT and Telecommunication
- 6.3.3. Retail
- 6.3.4. Healthcare and Life Sciences
- 6.3.5. Other En
- 6.1. Market Analysis, Insights and Forecast - by Type of Cloud Deployment
- 7. Europe Function-as-a-Service Industry Analysis, Insights and Forecast, 2019-2031
- 7.1. Market Analysis, Insights and Forecast - by Type of Cloud Deployment
- 7.1.1. Public
- 7.1.2. Private
- 7.1.3. Hybrid
- 7.2. Market Analysis, Insights and Forecast - by Organization Size
- 7.2.1. Small and Medium Enterprises
- 7.2.2. Large Enterprises
- 7.3. Market Analysis, Insights and Forecast - by End-User
- 7.3.1. BFSI
- 7.3.2. IT and Telecommunication
- 7.3.3. Retail
- 7.3.4. Healthcare and Life Sciences
- 7.3.5. Other En
- 7.1. Market Analysis, Insights and Forecast - by Type of Cloud Deployment
- 8. Asia Pacific Function-as-a-Service Industry Analysis, Insights and Forecast, 2019-2031
- 8.1. Market Analysis, Insights and Forecast - by Type of Cloud Deployment
- 8.1.1. Public
- 8.1.2. Private
- 8.1.3. Hybrid
- 8.2. Market Analysis, Insights and Forecast - by Organization Size
- 8.2.1. Small and Medium Enterprises
- 8.2.2. Large Enterprises
- 8.3. Market Analysis, Insights and Forecast - by End-User
- 8.3.1. BFSI
- 8.3.2. IT and Telecommunication
- 8.3.3. Retail
- 8.3.4. Healthcare and Life Sciences
- 8.3.5. Other En
- 8.1. Market Analysis, Insights and Forecast - by Type of Cloud Deployment
- 9. Rest of the World Function-as-a-Service Industry Analysis, Insights and Forecast, 2019-2031
- 9.1. Market Analysis, Insights and Forecast - by Type of Cloud Deployment
- 9.1.1. Public
- 9.1.2. Private
- 9.1.3. Hybrid
- 9.2. Market Analysis, Insights and Forecast - by Organization Size
- 9.2.1. Small and Medium Enterprises
- 9.2.2. Large Enterprises
- 9.3. Market Analysis, Insights and Forecast - by End-User
- 9.3.1. BFSI
- 9.3.2. IT and Telecommunication
- 9.3.3. Retail
- 9.3.4. Healthcare and Life Sciences
- 9.3.5. Other En
- 9.1. Market Analysis, Insights and Forecast - by Type of Cloud Deployment
- 10. North America Function-as-a-Service Industry Analysis, Insights and Forecast, 2019-2031
- 10.1. Market Analysis, Insights and Forecast - By Country/Sub-region
- 10.1.1 United States
- 10.1.2 Canada
- 10.1.3 Mexico
- 11. Europe Function-as-a-Service Industry Analysis, Insights and Forecast, 2019-2031
- 11.1. Market Analysis, Insights and Forecast - By Country/Sub-region
- 11.1.1 Germany
- 11.1.2 United Kingdom
- 11.1.3 France
- 11.1.4 Spain
- 11.1.5 Italy
- 11.1.6 Spain
- 11.1.7 Belgium
- 11.1.8 Netherland
- 11.1.9 Nordics
- 11.1.10 Rest of Europe
- 12. Asia Pacific Function-as-a-Service Industry Analysis, Insights and Forecast, 2019-2031
- 12.1. Market Analysis, Insights and Forecast - By Country/Sub-region
- 12.1.1 China
- 12.1.2 Japan
- 12.1.3 India
- 12.1.4 South Korea
- 12.1.5 Southeast Asia
- 12.1.6 Australia
- 12.1.7 Indonesia
- 12.1.8 Phillipes
- 12.1.9 Singapore
- 12.1.10 Thailandc
- 12.1.11 Rest of Asia Pacific
- 13. South America Function-as-a-Service Industry Analysis, Insights and Forecast, 2019-2031
- 13.1. Market Analysis, Insights and Forecast - By Country/Sub-region
- 13.1.1 Brazil
- 13.1.2 Argentina
- 13.1.3 Peru
- 13.1.4 Chile
- 13.1.5 Colombia
- 13.1.6 Ecuador
- 13.1.7 Venezuela
- 13.1.8 Rest of South America
- 14. North America Function-as-a-Service Industry Analysis, Insights and Forecast, 2019-2031
- 14.1. Market Analysis, Insights and Forecast - By Country/Sub-region
- 14.1.1 United States
- 14.1.2 Canada
- 14.1.3 Mexico
- 15. MEA Function-as-a-Service Industry Analysis, Insights and Forecast, 2019-2031
- 15.1. Market Analysis, Insights and Forecast - By Country/Sub-region
- 15.1.1 United Arab Emirates
- 15.1.2 Saudi Arabia
- 15.1.3 South Africa
- 15.1.4 Rest of Middle East and Africa
- 16. Competitive Analysis
- 16.1. Global Market Share Analysis 2024
- 16.2. Company Profiles
- 16.2.1 Tibco Software Inc
- 16.2.1.1. Overview
- 16.2.1.2. Products
- 16.2.1.3. SWOT Analysis
- 16.2.1.4. Recent Developments
- 16.2.1.5. Financials (Based on Availability)
- 16.2.2 Infosys Limited
- 16.2.2.1. Overview
- 16.2.2.2. Products
- 16.2.2.3. SWOT Analysis
- 16.2.2.4. Recent Developments
- 16.2.2.5. Financials (Based on Availability)
- 16.2.3 IBM Corporation
- 16.2.3.1. Overview
- 16.2.3.2. Products
- 16.2.3.3. SWOT Analysis
- 16.2.3.4. Recent Developments
- 16.2.3.5. Financials (Based on Availability)
- 16.2.4 Fiorano Software and Affiliates
- 16.2.4.1. Overview
- 16.2.4.2. Products
- 16.2.4.3. SWOT Analysis
- 16.2.4.4. Recent Developments
- 16.2.4.5. Financials (Based on Availability)
- 16.2.5 Microsoft Corporation
- 16.2.5.1. Overview
- 16.2.5.2. Products
- 16.2.5.3. SWOT Analysis
- 16.2.5.4. Recent Developments
- 16.2.5.5. Financials (Based on Availability)
- 16.2.6 Amazon Web Services Inc
- 16.2.6.1. Overview
- 16.2.6.2. Products
- 16.2.6.3. SWOT Analysis
- 16.2.6.4. Recent Developments
- 16.2.6.5. Financials (Based on Availability)
- 16.2.7 Oracle Corporation
- 16.2.7.1. Overview
- 16.2.7.2. Products
- 16.2.7.3. SWOT Analysis
- 16.2.7.4. Recent Developments
- 16.2.7.5. Financials (Based on Availability)
- 16.2.8 Rogue Wave Software Inc
- 16.2.8.1. Overview
- 16.2.8.2. Products
- 16.2.8.3. SWOT Analysis
- 16.2.8.4. Recent Developments
- 16.2.8.5. Financials (Based on Availability)
- 16.2.9 Google Inc
- 16.2.9.1. Overview
- 16.2.9.2. Products
- 16.2.9.3. SWOT Analysis
- 16.2.9.4. Recent Developments
- 16.2.9.5. Financials (Based on Availability)
- 16.2.10 Dynatrace LLC
- 16.2.10.1. Overview
- 16.2.10.2. Products
- 16.2.10.3. SWOT Analysis
- 16.2.10.4. Recent Developments
- 16.2.10.5. Financials (Based on Availability)
- 16.2.11 SAP SE
- 16.2.11.1. Overview
- 16.2.11.2. Products
- 16.2.11.3. SWOT Analysis
- 16.2.11.4. Recent Developments
- 16.2.11.5. Financials (Based on Availability)
- 16.2.1 Tibco Software Inc
List of Figures
- Figure 1: Global Function-as-a-Service Industry Revenue Breakdown (Million, %) by Region 2024 & 2032
- Figure 2: Global Function-as-a-Service Industry Volume Breakdown (K Unit, %) by Region 2024 & 2032
- Figure 3: North America Function-as-a-Service Industry Revenue (Million), by Country 2024 & 2032
- Figure 4: North America Function-as-a-Service Industry Volume (K Unit), by Country 2024 & 2032
- Figure 5: North America Function-as-a-Service Industry Revenue Share (%), by Country 2024 & 2032
- Figure 6: North America Function-as-a-Service Industry Volume Share (%), by Country 2024 & 2032
- Figure 7: Europe Function-as-a-Service Industry Revenue (Million), by Country 2024 & 2032
- Figure 8: Europe Function-as-a-Service Industry Volume (K Unit), by Country 2024 & 2032
- Figure 9: Europe Function-as-a-Service Industry Revenue Share (%), by Country 2024 & 2032
- Figure 10: Europe Function-as-a-Service Industry Volume Share (%), by Country 2024 & 2032
- Figure 11: Asia Pacific Function-as-a-Service Industry Revenue (Million), by Country 2024 & 2032
- Figure 12: Asia Pacific Function-as-a-Service Industry Volume (K Unit), by Country 2024 & 2032
- Figure 13: Asia Pacific Function-as-a-Service Industry Revenue Share (%), by Country 2024 & 2032
- Figure 14: Asia Pacific Function-as-a-Service Industry Volume Share (%), by Country 2024 & 2032
- Figure 15: South America Function-as-a-Service Industry Revenue (Million), by Country 2024 & 2032
- Figure 16: South America Function-as-a-Service Industry Volume (K Unit), by Country 2024 & 2032
- Figure 17: South America Function-as-a-Service Industry Revenue Share (%), by Country 2024 & 2032
- Figure 18: South America Function-as-a-Service Industry Volume Share (%), by Country 2024 & 2032
- Figure 19: North America Function-as-a-Service Industry Revenue (Million), by Country 2024 & 2032
- Figure 20: North America Function-as-a-Service Industry Volume (K Unit), by Country 2024 & 2032
- Figure 21: North America Function-as-a-Service Industry Revenue Share (%), by Country 2024 & 2032
- Figure 22: North America Function-as-a-Service Industry Volume Share (%), by Country 2024 & 2032
- Figure 23: MEA Function-as-a-Service Industry Revenue (Million), by Country 2024 & 2032
- Figure 24: MEA Function-as-a-Service Industry Volume (K Unit), by Country 2024 & 2032
- Figure 25: MEA Function-as-a-Service Industry Revenue Share (%), by Country 2024 & 2032
- Figure 26: MEA Function-as-a-Service Industry Volume Share (%), by Country 2024 & 2032
- Figure 27: North America Function-as-a-Service Industry Revenue (Million), by Type of Cloud Deployment 2024 & 2032
- Figure 28: North America Function-as-a-Service Industry Volume (K Unit), by Type of Cloud Deployment 2024 & 2032
- Figure 29: North America Function-as-a-Service Industry Revenue Share (%), by Type of Cloud Deployment 2024 & 2032
- Figure 30: North America Function-as-a-Service Industry Volume Share (%), by Type of Cloud Deployment 2024 & 2032
- Figure 31: North America Function-as-a-Service Industry Revenue (Million), by Organization Size 2024 & 2032
- Figure 32: North America Function-as-a-Service Industry Volume (K Unit), by Organization Size 2024 & 2032
- Figure 33: North America Function-as-a-Service Industry Revenue Share (%), by Organization Size 2024 & 2032
- Figure 34: North America Function-as-a-Service Industry Volume Share (%), by Organization Size 2024 & 2032
- Figure 35: North America Function-as-a-Service Industry Revenue (Million), by End-User 2024 & 2032
- Figure 36: North America Function-as-a-Service Industry Volume (K Unit), by End-User 2024 & 2032
- Figure 37: North America Function-as-a-Service Industry Revenue Share (%), by End-User 2024 & 2032
- Figure 38: North America Function-as-a-Service Industry Volume Share (%), by End-User 2024 & 2032
- Figure 39: North America Function-as-a-Service Industry Revenue (Million), by Country 2024 & 2032
- Figure 40: North America Function-as-a-Service Industry Volume (K Unit), by Country 2024 & 2032
- Figure 41: North America Function-as-a-Service Industry Revenue Share (%), by Country 2024 & 2032
- Figure 42: North America Function-as-a-Service Industry Volume Share (%), by Country 2024 & 2032
- Figure 43: Europe Function-as-a-Service Industry Revenue (Million), by Type of Cloud Deployment 2024 & 2032
- Figure 44: Europe Function-as-a-Service Industry Volume (K Unit), by Type of Cloud Deployment 2024 & 2032
- Figure 45: Europe Function-as-a-Service Industry Revenue Share (%), by Type of Cloud Deployment 2024 & 2032
- Figure 46: Europe Function-as-a-Service Industry Volume Share (%), by Type of Cloud Deployment 2024 & 2032
- Figure 47: Europe Function-as-a-Service Industry Revenue (Million), by Organization Size 2024 & 2032
- Figure 48: Europe Function-as-a-Service Industry Volume (K Unit), by Organization Size 2024 & 2032
- Figure 49: Europe Function-as-a-Service Industry Revenue Share (%), by Organization Size 2024 & 2032
- Figure 50: Europe Function-as-a-Service Industry Volume Share (%), by Organization Size 2024 & 2032
- Figure 51: Europe Function-as-a-Service Industry Revenue (Million), by End-User 2024 & 2032
- Figure 52: Europe Function-as-a-Service Industry Volume (K Unit), by End-User 2024 & 2032
- Figure 53: Europe Function-as-a-Service Industry Revenue Share (%), by End-User 2024 & 2032
- Figure 54: Europe Function-as-a-Service Industry Volume Share (%), by End-User 2024 & 2032
- Figure 55: Europe Function-as-a-Service Industry Revenue (Million), by Country 2024 & 2032
- Figure 56: Europe Function-as-a-Service Industry Volume (K Unit), by Country 2024 & 2032
- Figure 57: Europe Function-as-a-Service Industry Revenue Share (%), by Country 2024 & 2032
- Figure 58: Europe Function-as-a-Service Industry Volume Share (%), by Country 2024 & 2032
- Figure 59: Asia Pacific Function-as-a-Service Industry Revenue (Million), by Type of Cloud Deployment 2024 & 2032
- Figure 60: Asia Pacific Function-as-a-Service Industry Volume (K Unit), by Type of Cloud Deployment 2024 & 2032
- Figure 61: Asia Pacific Function-as-a-Service Industry Revenue Share (%), by Type of Cloud Deployment 2024 & 2032
- Figure 62: Asia Pacific Function-as-a-Service Industry Volume Share (%), by Type of Cloud Deployment 2024 & 2032
- Figure 63: Asia Pacific Function-as-a-Service Industry Revenue (Million), by Organization Size 2024 & 2032
- Figure 64: Asia Pacific Function-as-a-Service Industry Volume (K Unit), by Organization Size 2024 & 2032
- Figure 65: Asia Pacific Function-as-a-Service Industry Revenue Share (%), by Organization Size 2024 & 2032
- Figure 66: Asia Pacific Function-as-a-Service Industry Volume Share (%), by Organization Size 2024 & 2032
- Figure 67: Asia Pacific Function-as-a-Service Industry Revenue (Million), by End-User 2024 & 2032
- Figure 68: Asia Pacific Function-as-a-Service Industry Volume (K Unit), by End-User 2024 & 2032
- Figure 69: Asia Pacific Function-as-a-Service Industry Revenue Share (%), by End-User 2024 & 2032
- Figure 70: Asia Pacific Function-as-a-Service Industry Volume Share (%), by End-User 2024 & 2032
- Figure 71: Asia Pacific Function-as-a-Service Industry Revenue (Million), by Country 2024 & 2032
- Figure 72: Asia Pacific Function-as-a-Service Industry Volume (K Unit), by Country 2024 & 2032
- Figure 73: Asia Pacific Function-as-a-Service Industry Revenue Share (%), by Country 2024 & 2032
- Figure 74: Asia Pacific Function-as-a-Service Industry Volume Share (%), by Country 2024 & 2032
- Figure 75: Rest of the World Function-as-a-Service Industry Revenue (Million), by Type of Cloud Deployment 2024 & 2032
- Figure 76: Rest of the World Function-as-a-Service Industry Volume (K Unit), by Type of Cloud Deployment 2024 & 2032
- Figure 77: Rest of the World Function-as-a-Service Industry Revenue Share (%), by Type of Cloud Deployment 2024 & 2032
- Figure 78: Rest of the World Function-as-a-Service Industry Volume Share (%), by Type of Cloud Deployment 2024 & 2032
- Figure 79: Rest of the World Function-as-a-Service Industry Revenue (Million), by Organization Size 2024 & 2032
- Figure 80: Rest of the World Function-as-a-Service Industry Volume (K Unit), by Organization Size 2024 & 2032
- Figure 81: Rest of the World Function-as-a-Service Industry Revenue Share (%), by Organization Size 2024 & 2032
- Figure 82: Rest of the World Function-as-a-Service Industry Volume Share (%), by Organization Size 2024 & 2032
- Figure 83: Rest of the World Function-as-a-Service Industry Revenue (Million), by End-User 2024 & 2032
- Figure 84: Rest of the World Function-as-a-Service Industry Volume (K Unit), by End-User 2024 & 2032
- Figure 85: Rest of the World Function-as-a-Service Industry Revenue Share (%), by End-User 2024 & 2032
- Figure 86: Rest of the World Function-as-a-Service Industry Volume Share (%), by End-User 2024 & 2032
- Figure 87: Rest of the World Function-as-a-Service Industry Revenue (Million), by Country 2024 & 2032
- Figure 88: Rest of the World Function-as-a-Service Industry Volume (K Unit), by Country 2024 & 2032
- Figure 89: Rest of the World Function-as-a-Service Industry Revenue Share (%), by Country 2024 & 2032
- Figure 90: Rest of the World Function-as-a-Service Industry Volume Share (%), by Country 2024 & 2032
List of Tables
- Table 1: Global Function-as-a-Service Industry Revenue Million Forecast, by Region 2019 & 2032
- Table 2: Global Function-as-a-Service Industry Volume K Unit Forecast, by Region 2019 & 2032
- Table 3: Global Function-as-a-Service Industry Revenue Million Forecast, by Type of Cloud Deployment 2019 & 2032
- Table 4: Global Function-as-a-Service Industry Volume K Unit Forecast, by Type of Cloud Deployment 2019 & 2032
- Table 5: Global Function-as-a-Service Industry Revenue Million Forecast, by Organization Size 2019 & 2032
- Table 6: Global Function-as-a-Service Industry Volume K Unit Forecast, by Organization Size 2019 & 2032
- Table 7: Global Function-as-a-Service Industry Revenue Million Forecast, by End-User 2019 & 2032
- Table 8: Global Function-as-a-Service Industry Volume K Unit Forecast, by End-User 2019 & 2032
- Table 9: Global Function-as-a-Service Industry Revenue Million Forecast, by Region 2019 & 2032
- Table 10: Global Function-as-a-Service Industry Volume K Unit Forecast, by Region 2019 & 2032
- Table 11: Global Function-as-a-Service Industry Revenue Million Forecast, by Country 2019 & 2032
- Table 12: Global Function-as-a-Service Industry Volume K Unit Forecast, by Country 2019 & 2032
- Table 13: United States Function-as-a-Service Industry Revenue (Million) Forecast, by Application 2019 & 2032
- Table 14: United States Function-as-a-Service Industry Volume (K Unit) Forecast, by Application 2019 & 2032
- Table 15: Canada Function-as-a-Service Industry Revenue (Million) Forecast, by Application 2019 & 2032
- Table 16: Canada Function-as-a-Service Industry Volume (K Unit) Forecast, by Application 2019 & 2032
- Table 17: Mexico Function-as-a-Service Industry Revenue (Million) Forecast, by Application 2019 & 2032
- Table 18: Mexico Function-as-a-Service Industry Volume (K Unit) Forecast, by Application 2019 & 2032
- Table 19: Global Function-as-a-Service Industry Revenue Million Forecast, by Country 2019 & 2032
- Table 20: Global Function-as-a-Service Industry Volume K Unit Forecast, by Country 2019 & 2032
- Table 21: Germany Function-as-a-Service Industry Revenue (Million) Forecast, by Application 2019 & 2032
- Table 22: Germany Function-as-a-Service Industry Volume (K Unit) Forecast, by Application 2019 & 2032
- Table 23: United Kingdom Function-as-a-Service Industry Revenue (Million) Forecast, by Application 2019 & 2032
- Table 24: United Kingdom Function-as-a-Service Industry Volume (K Unit) Forecast, by Application 2019 & 2032
- Table 25: France Function-as-a-Service Industry Revenue (Million) Forecast, by Application 2019 & 2032
- Table 26: France Function-as-a-Service Industry Volume (K Unit) Forecast, by Application 2019 & 2032
- Table 27: Spain Function-as-a-Service Industry Revenue (Million) Forecast, by Application 2019 & 2032
- Table 28: Spain Function-as-a-Service Industry Volume (K Unit) Forecast, by Application 2019 & 2032
- Table 29: Italy Function-as-a-Service Industry Revenue (Million) Forecast, by Application 2019 & 2032
- Table 30: Italy Function-as-a-Service Industry Volume (K Unit) Forecast, by Application 2019 & 2032
- Table 31: Spain Function-as-a-Service Industry Revenue (Million) Forecast, by Application 2019 & 2032
- Table 32: Spain Function-as-a-Service Industry Volume (K Unit) Forecast, by Application 2019 & 2032
- Table 33: Belgium Function-as-a-Service Industry Revenue (Million) Forecast, by Application 2019 & 2032
- Table 34: Belgium Function-as-a-Service Industry Volume (K Unit) Forecast, by Application 2019 & 2032
- Table 35: Netherland Function-as-a-Service Industry Revenue (Million) Forecast, by Application 2019 & 2032
- Table 36: Netherland Function-as-a-Service Industry Volume (K Unit) Forecast, by Application 2019 & 2032
- Table 37: Nordics Function-as-a-Service Industry Revenue (Million) Forecast, by Application 2019 & 2032
- Table 38: Nordics Function-as-a-Service Industry Volume (K Unit) Forecast, by Application 2019 & 2032
- Table 39: Rest of Europe Function-as-a-Service Industry Revenue (Million) Forecast, by Application 2019 & 2032
- Table 40: Rest of Europe Function-as-a-Service Industry Volume (K Unit) Forecast, by Application 2019 & 2032
- Table 41: Global Function-as-a-Service Industry Revenue Million Forecast, by Country 2019 & 2032
- Table 42: Global Function-as-a-Service Industry Volume K Unit Forecast, by Country 2019 & 2032
- Table 43: China Function-as-a-Service Industry Revenue (Million) Forecast, by Application 2019 & 2032
- Table 44: China Function-as-a-Service Industry Volume (K Unit) Forecast, by Application 2019 & 2032
- Table 45: Japan Function-as-a-Service Industry Revenue (Million) Forecast, by Application 2019 & 2032
- Table 46: Japan Function-as-a-Service Industry Volume (K Unit) Forecast, by Application 2019 & 2032
- Table 47: India Function-as-a-Service Industry Revenue (Million) Forecast, by Application 2019 & 2032
- Table 48: India Function-as-a-Service Industry Volume (K Unit) Forecast, by Application 2019 & 2032
- Table 49: South Korea Function-as-a-Service Industry Revenue (Million) Forecast, by Application 2019 & 2032
- Table 50: South Korea Function-as-a-Service Industry Volume (K Unit) Forecast, by Application 2019 & 2032
- Table 51: Southeast Asia Function-as-a-Service Industry Revenue (Million) Forecast, by Application 2019 & 2032
- Table 52: Southeast Asia Function-as-a-Service Industry Volume (K Unit) Forecast, by Application 2019 & 2032
- Table 53: Australia Function-as-a-Service Industry Revenue (Million) Forecast, by Application 2019 & 2032
- Table 54: Australia Function-as-a-Service Industry Volume (K Unit) Forecast, by Application 2019 & 2032
- Table 55: Indonesia Function-as-a-Service Industry Revenue (Million) Forecast, by Application 2019 & 2032
- Table 56: Indonesia Function-as-a-Service Industry Volume (K Unit) Forecast, by Application 2019 & 2032
- Table 57: Phillipes Function-as-a-Service Industry Revenue (Million) Forecast, by Application 2019 & 2032
- Table 58: Phillipes Function-as-a-Service Industry Volume (K Unit) Forecast, by Application 2019 & 2032
- Table 59: Singapore Function-as-a-Service Industry Revenue (Million) Forecast, by Application 2019 & 2032
- Table 60: Singapore Function-as-a-Service Industry Volume (K Unit) Forecast, by Application 2019 & 2032
- Table 61: Thailandc Function-as-a-Service Industry Revenue (Million) Forecast, by Application 2019 & 2032
- Table 62: Thailandc Function-as-a-Service Industry Volume (K Unit) Forecast, by Application 2019 & 2032
- Table 63: Rest of Asia Pacific Function-as-a-Service Industry Revenue (Million) Forecast, by Application 2019 & 2032
- Table 64: Rest of Asia Pacific Function-as-a-Service Industry Volume (K Unit) Forecast, by Application 2019 & 2032
- Table 65: Global Function-as-a-Service Industry Revenue Million Forecast, by Country 2019 & 2032
- Table 66: Global Function-as-a-Service Industry Volume K Unit Forecast, by Country 2019 & 2032
- Table 67: Brazil Function-as-a-Service Industry Revenue (Million) Forecast, by Application 2019 & 2032
- Table 68: Brazil Function-as-a-Service Industry Volume (K Unit) Forecast, by Application 2019 & 2032
- Table 69: Argentina Function-as-a-Service Industry Revenue (Million) Forecast, by Application 2019 & 2032
- Table 70: Argentina Function-as-a-Service Industry Volume (K Unit) Forecast, by Application 2019 & 2032
- Table 71: Peru Function-as-a-Service Industry Revenue (Million) Forecast, by Application 2019 & 2032
- Table 72: Peru Function-as-a-Service Industry Volume (K Unit) Forecast, by Application 2019 & 2032
- Table 73: Chile Function-as-a-Service Industry Revenue (Million) Forecast, by Application 2019 & 2032
- Table 74: Chile Function-as-a-Service Industry Volume (K Unit) Forecast, by Application 2019 & 2032
- Table 75: Colombia Function-as-a-Service Industry Revenue (Million) Forecast, by Application 2019 & 2032
- Table 76: Colombia Function-as-a-Service Industry Volume (K Unit) Forecast, by Application 2019 & 2032
- Table 77: Ecuador Function-as-a-Service Industry Revenue (Million) Forecast, by Application 2019 & 2032
- Table 78: Ecuador Function-as-a-Service Industry Volume (K Unit) Forecast, by Application 2019 & 2032
- Table 79: Venezuela Function-as-a-Service Industry Revenue (Million) Forecast, by Application 2019 & 2032
- Table 80: Venezuela Function-as-a-Service Industry Volume (K Unit) Forecast, by Application 2019 & 2032
- Table 81: Rest of South America Function-as-a-Service Industry Revenue (Million) Forecast, by Application 2019 & 2032
- Table 82: Rest of South America Function-as-a-Service Industry Volume (K Unit) Forecast, by Application 2019 & 2032
- Table 83: Global Function-as-a-Service Industry Revenue Million Forecast, by Country 2019 & 2032
- Table 84: Global Function-as-a-Service Industry Volume K Unit Forecast, by Country 2019 & 2032
- Table 85: United States Function-as-a-Service Industry Revenue (Million) Forecast, by Application 2019 & 2032
- Table 86: United States Function-as-a-Service Industry Volume (K Unit) Forecast, by Application 2019 & 2032
- Table 87: Canada Function-as-a-Service Industry Revenue (Million) Forecast, by Application 2019 & 2032
- Table 88: Canada Function-as-a-Service Industry Volume (K Unit) Forecast, by Application 2019 & 2032
- Table 89: Mexico Function-as-a-Service Industry Revenue (Million) Forecast, by Application 2019 & 2032
- Table 90: Mexico Function-as-a-Service Industry Volume (K Unit) Forecast, by Application 2019 & 2032
- Table 91: Global Function-as-a-Service Industry Revenue Million Forecast, by Country 2019 & 2032
- Table 92: Global Function-as-a-Service Industry Volume K Unit Forecast, by Country 2019 & 2032
- Table 93: United Arab Emirates Function-as-a-Service Industry Revenue (Million) Forecast, by Application 2019 & 2032
- Table 94: United Arab Emirates Function-as-a-Service Industry Volume (K Unit) Forecast, by Application 2019 & 2032
- Table 95: Saudi Arabia Function-as-a-Service Industry Revenue (Million) Forecast, by Application 2019 & 2032
- Table 96: Saudi Arabia Function-as-a-Service Industry Volume (K Unit) Forecast, by Application 2019 & 2032
- Table 97: South Africa Function-as-a-Service Industry Revenue (Million) Forecast, by Application 2019 & 2032
- Table 98: South Africa Function-as-a-Service Industry Volume (K Unit) Forecast, by Application 2019 & 2032
- Table 99: Rest of Middle East and Africa Function-as-a-Service Industry Revenue (Million) Forecast, by Application 2019 & 2032
- Table 100: Rest of Middle East and Africa Function-as-a-Service Industry Volume (K Unit) Forecast, by Application 2019 & 2032
- Table 101: Global Function-as-a-Service Industry Revenue Million Forecast, by Type of Cloud Deployment 2019 & 2032
- Table 102: Global Function-as-a-Service Industry Volume K Unit Forecast, by Type of Cloud Deployment 2019 & 2032
- Table 103: Global Function-as-a-Service Industry Revenue Million Forecast, by Organization Size 2019 & 2032
- Table 104: Global Function-as-a-Service Industry Volume K Unit Forecast, by Organization Size 2019 & 2032
- Table 105: Global Function-as-a-Service Industry Revenue Million Forecast, by End-User 2019 & 2032
- Table 106: Global Function-as-a-Service Industry Volume K Unit Forecast, by End-User 2019 & 2032
- Table 107: Global Function-as-a-Service Industry Revenue Million Forecast, by Country 2019 & 2032
- Table 108: Global Function-as-a-Service Industry Volume K Unit Forecast, by Country 2019 & 2032
- Table 109: Global Function-as-a-Service Industry Revenue Million Forecast, by Type of Cloud Deployment 2019 & 2032
- Table 110: Global Function-as-a-Service Industry Volume K Unit Forecast, by Type of Cloud Deployment 2019 & 2032
- Table 111: Global Function-as-a-Service Industry Revenue Million Forecast, by Organization Size 2019 & 2032
- Table 112: Global Function-as-a-Service Industry Volume K Unit Forecast, by Organization Size 2019 & 2032
- Table 113: Global Function-as-a-Service Industry Revenue Million Forecast, by End-User 2019 & 2032
- Table 114: Global Function-as-a-Service Industry Volume K Unit Forecast, by End-User 2019 & 2032
- Table 115: Global Function-as-a-Service Industry Revenue Million Forecast, by Country 2019 & 2032
- Table 116: Global Function-as-a-Service Industry Volume K Unit Forecast, by Country 2019 & 2032
- Table 117: Global Function-as-a-Service Industry Revenue Million Forecast, by Type of Cloud Deployment 2019 & 2032
- Table 118: Global Function-as-a-Service Industry Volume K Unit Forecast, by Type of Cloud Deployment 2019 & 2032
- Table 119: Global Function-as-a-Service Industry Revenue Million Forecast, by Organization Size 2019 & 2032
- Table 120: Global Function-as-a-Service Industry Volume K Unit Forecast, by Organization Size 2019 & 2032
- Table 121: Global Function-as-a-Service Industry Revenue Million Forecast, by End-User 2019 & 2032
- Table 122: Global Function-as-a-Service Industry Volume K Unit Forecast, by End-User 2019 & 2032
- Table 123: Global Function-as-a-Service Industry Revenue Million Forecast, by Country 2019 & 2032
- Table 124: Global Function-as-a-Service Industry Volume K Unit Forecast, by Country 2019 & 2032
- Table 125: Global Function-as-a-Service Industry Revenue Million Forecast, by Type of Cloud Deployment 2019 & 2032
- Table 126: Global Function-as-a-Service Industry Volume K Unit Forecast, by Type of Cloud Deployment 2019 & 2032
- Table 127: Global Function-as-a-Service Industry Revenue Million Forecast, by Organization Size 2019 & 2032
- Table 128: Global Function-as-a-Service Industry Volume K Unit Forecast, by Organization Size 2019 & 2032
- Table 129: Global Function-as-a-Service Industry Revenue Million Forecast, by End-User 2019 & 2032
- Table 130: Global Function-as-a-Service Industry Volume K Unit Forecast, by End-User 2019 & 2032
- Table 131: Global Function-as-a-Service Industry Revenue Million Forecast, by Country 2019 & 2032
- Table 132: Global Function-as-a-Service Industry Volume K Unit Forecast, by Country 2019 & 2032
Frequently Asked Questions
1. What is the projected Compound Annual Growth Rate (CAGR) of the Function-as-a-Service Industry?
The projected CAGR is approximately 20.36%.
2. Which companies are prominent players in the Function-as-a-Service Industry?
Key companies in the market include Tibco Software Inc, Infosys Limited, IBM Corporation, Fiorano Software and Affiliates, Microsoft Corporation, Amazon Web Services Inc, Oracle Corporation, Rogue Wave Software Inc, Google Inc, Dynatrace LLC, SAP SE.
3. What are the main segments of the Function-as-a-Service Industry?
The market segments include Type of Cloud Deployment, Organization Size, End-User.
4. Can you provide details about the market size?
The market size is estimated to be USD 17.70 Million as of 2022.
5. What are some drivers contributing to market growth?
Growing shift towards serverless computing; Increasing focus towards agility of infrastructure and cost reduction.
6. What are the notable trends driving market growth?
Hybrid Cloud to Drive the Growth of the Market for Security and Privacy Concerned End Users.
7. Are there any restraints impacting market growth?
Incompatibility of some applications with cloud environment.
8. Can you provide examples of recent developments in the market?
December 2022: To optimize economic value for cloud-powered organizations worldwide, Tech Mahindra, a leading provider of digital transformation, consultancy, and business re-engineering services and solutions, launched Cloud BlazeTech, an integrated, industry-neutral platform. To accelerate business digital transformation, the firm will continue to invest in cloud services & ties with hyperscalers.
9. What pricing options are available for accessing the report?
Pricing options include single-user, multi-user, and enterprise licenses priced at USD 4750, USD 5250, and USD 8750 respectively.
10. Is the market size provided in terms of value or volume?
The market size is provided in terms of value, measured in Million and volume, measured in K Unit.
11. Are there any specific market keywords associated with the report?
Yes, the market keyword associated with the report is "Function-as-a-Service Industry," which aids in identifying and referencing the specific market segment covered.
12. How do I determine which pricing option suits my needs best?
The pricing options vary based on user requirements and access needs. Individual users may opt for single-user licenses, while businesses requiring broader access may choose multi-user or enterprise licenses for cost-effective access to the report.
13. Are there any additional resources or data provided in the Function-as-a-Service Industry report?
While the report offers comprehensive insights, it's advisable to review the specific contents or supplementary materials provided to ascertain if additional resources or data are available.
14. How can I stay updated on further developments or reports in the Function-as-a-Service Industry?
To stay informed about further developments, trends, and reports in the Function-as-a-Service Industry, consider subscribing to industry newsletters, following relevant companies and organizations, or regularly checking reputable industry news sources and publications.
Methodology
Step 1 - Identification of Relevant Samples Size from Population Database


Step 2 - Approaches for Defining Global Market Size (Value, Volume* & Price*)

Note*: In applicable scenarios
Step 3 - Data Sources
Primary Research
- Web Analytics
- Survey Reports
- Research Institute
- Latest Research Reports
- Opinion Leaders
Secondary Research
- Annual Reports
- White Paper
- Latest Press Release
- Industry Association
- Paid Database
- Investor Presentations

Step 4 - Data Triangulation
Involves using different sources of information in order to increase the validity of a study
These sources are likely to be stakeholders in a program - participants, other researchers, program staff, other community members, and so on.
Then we put all data in single framework & apply various statistical tools to find out the dynamic on the market.
During the analysis stage, feedback from the stakeholder groups would be compared to determine areas of agreement as well as areas of divergence
