

Key Insights
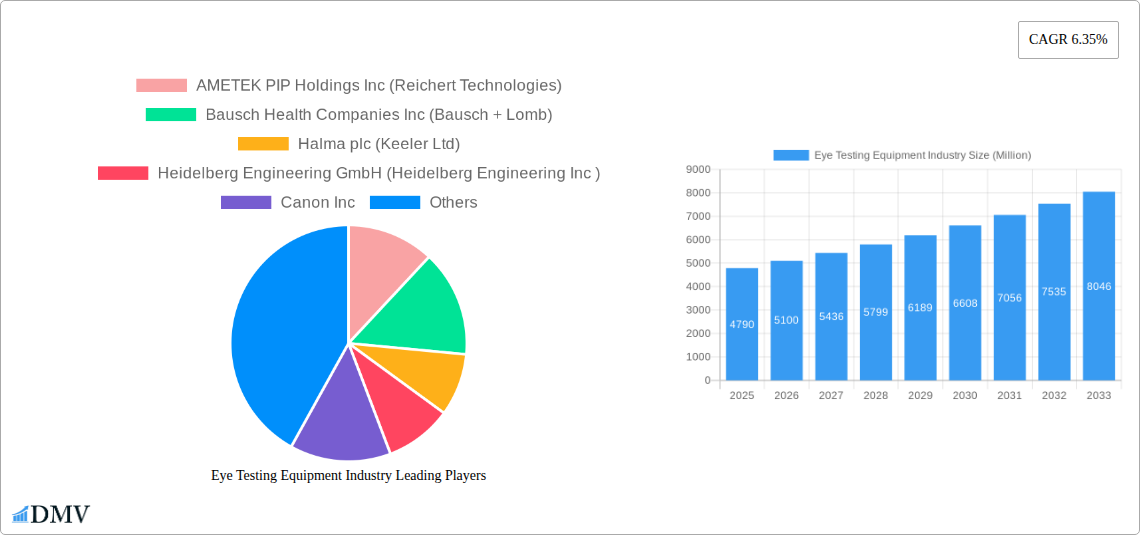
The global eye testing equipment market, valued at $4.79 billion in 2025, is projected to experience robust growth, driven by a rising prevalence of ophthalmic diseases like glaucoma, cataracts, and diabetic retinopathy, coupled with an aging global population. Technological advancements, including the integration of artificial intelligence and digital imaging in diagnostic tools, are further fueling market expansion. Increased accessibility to eye care services in developing economies and a growing awareness of preventative eye health are also contributing factors. The market is segmented by examination type (retina, cornea, and general), with retina examinations holding a significant share due to the increasing demand for early detection and management of retinal diseases. Hospitals and eye clinics constitute the primary end-users, driven by their established infrastructure and specialized expertise. Leading players like AMETEK, Bausch + Lomb, and Carl Zeiss Meditec are investing heavily in research and development, fostering innovation and competition within the market. While regulatory hurdles and high equipment costs might pose some challenges, the overall market outlook remains positive, anticipating consistent growth throughout the forecast period.
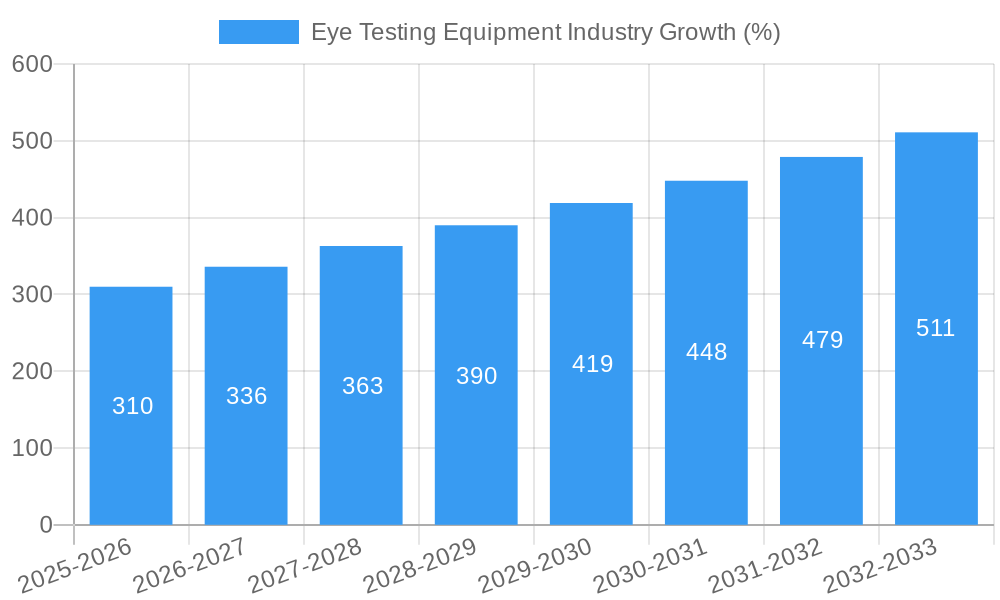
The market's growth trajectory is expected to remain steady, fueled by several factors. The ongoing expansion of healthcare infrastructure in emerging markets, particularly in Asia-Pacific and Latin America, offers significant growth opportunities. Furthermore, the increasing integration of teleophthalmology and remote diagnostics is expected to broaden access to eye care, thus increasing demand for portable and user-friendly testing equipment. Competitive pressures from various manufacturers are driving innovation, leading to the development of more sophisticated, accurate, and cost-effective devices. This dynamic competitive landscape is likely to benefit consumers through improved technology and pricing. However, maintaining a balance between technological advancements and affordability will remain crucial for sustained market growth. The market is expected to witness strategic partnerships and mergers and acquisitions to strengthen market presence and expand product portfolios.
Eye Testing Equipment Industry Market Report: 2019-2033
This comprehensive report provides a detailed analysis of the Eye Testing Equipment industry, encompassing market size, growth drivers, competitive landscape, and future outlook. The study period covers 2019-2033, with a focus on the forecast period of 2025-2033 and a base year of 2025. This report is invaluable for stakeholders seeking to understand the intricacies of this dynamic market and make informed strategic decisions. The global market value is estimated at xx Million in 2025 and is projected to reach xx Million by 2033.
Eye Testing Equipment Industry Market Composition & Trends
The Eye Testing Equipment market is characterized by a moderately concentrated landscape, with several key players holding significant market share. The market share distribution is dynamic, with ongoing mergers and acquisitions (M&A) significantly influencing the competitive dynamics. Innovation is a crucial catalyst, driven by advancements in digital imaging, AI-powered diagnostics, and portable devices. The regulatory landscape varies across geographies, influencing product approvals and market access. Substitute products, such as telehealth platforms for basic vision screenings, are emerging but haven't significantly disrupted the core market yet. End-users primarily comprise eye clinics and hospitals, with a growing segment of other end-users like mobile eye care units and specialized vision centers.
- Market Concentration: Moderately concentrated, with top 5 players holding approximately xx% of the market share in 2025.
- Innovation Catalysts: Digital imaging, AI diagnostics, miniaturization, and wireless connectivity.
- Regulatory Landscape: Varies significantly across regions, impacting device approvals and market access strategies.
- Substitute Products: Telehealth platforms for basic screenings present a niche challenge, but the core market remains largely unaffected.
- M&A Activities: Significant M&A activity observed in the historical period (2019-2024), with deal values totaling approximately xx Million. Examples include [Insert specific examples of M&A activity if available, otherwise omit].
Eye Testing Equipment Industry Industry Evolution
The Eye Testing Equipment industry has witnessed significant growth over the historical period (2019-2024), driven by factors like rising prevalence of eye diseases, aging population, increased healthcare expenditure, and technological advancements. The market experienced a Compound Annual Growth Rate (CAGR) of approximately xx% between 2019 and 2024. Technological advancements, including the development of high-resolution imaging systems, portable devices, and AI-powered diagnostic tools, have greatly improved the accuracy and efficiency of eye examinations. Shifting consumer demands towards non-invasive, convenient, and technologically advanced eye care solutions are further driving market growth. The adoption of advanced technologies like optical coherence tomography (OCT) and fundus cameras has increased steadily, with xx% market penetration in 2025. The forecast period (2025-2033) anticipates a CAGR of xx%, driven by continued technological innovations and expanding access to eye care in developing economies.
Leading Regions, Countries, or Segments in Eye Testing Equipment Industry
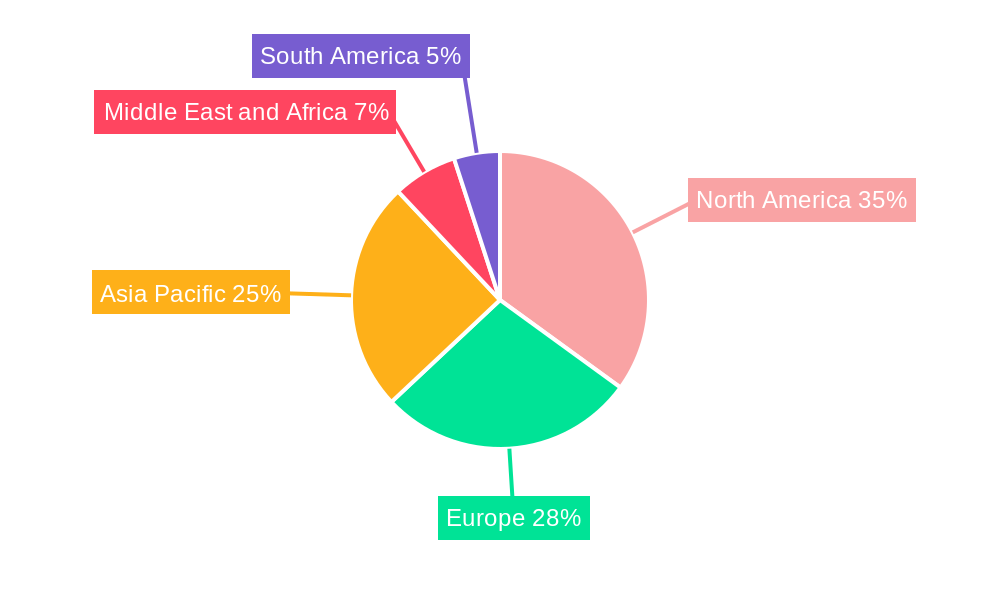
Dominant Region/Country: North America and Western Europe currently dominate the market, driven by robust healthcare infrastructure, higher disposable incomes, and increased awareness about eye health. Asia Pacific is projected to be the fastest growing region over the forecast period.
Dominant Segment (Type of Examination): Retina examination holds the largest market share, due to the increasing prevalence of retinal diseases and the availability of advanced diagnostic tools.
Dominant Segment (End-User): Hospitals are the largest end-user segment, due to their greater capacity and expertise in performing complex eye examinations.
Key Drivers:
- North America & Western Europe: Strong healthcare infrastructure, high healthcare spending, aging population.
- Asia Pacific: Rapidly rising prevalence of eye diseases, increasing healthcare awareness, expanding middle class.
- Retina Examination Segment: Rising prevalence of retinal diseases like diabetic retinopathy and age-related macular degeneration.
- Hospital Segment: Higher diagnostic capabilities, complex procedure handling capacity.
The dominance of North America and Western Europe is primarily attributed to well-established healthcare systems, high per capita income, and increased awareness of eye health. However, Asia Pacific is expected to witness significant growth driven by a growing population, rising prevalence of eye diseases, and increasing healthcare expenditure.
Eye Testing Equipment Industry Product Innovations
Recent innovations in eye testing equipment focus on portability, enhanced image quality, AI-driven diagnostics, and integration with electronic health records (EHRs). The introduction of handheld fundus cameras, like the epiCam launched by Epipole in 2022, allows for convenient and high-resolution retinal imaging in various settings. Wireless connectivity and cloud-based data storage further enhance workflow efficiency and data management. These innovations have improved the accessibility and diagnostic accuracy of eye examinations, significantly impacting clinical practice and patient care. The unique selling propositions of these products include ease of use, improved image quality, enhanced diagnostic capabilities, and seamless integration with existing healthcare workflows.
Propelling Factors for Eye Testing Equipment Industry Growth
Several factors contribute to the growth of the eye testing equipment market. Technological advancements, such as the development of high-resolution imaging systems and AI-powered diagnostic tools, enhance diagnostic accuracy and efficiency. The rising prevalence of chronic eye diseases and an aging global population increase demand for effective eye care solutions. Favorable regulatory environments and increased healthcare spending further boost market growth. For instance, government initiatives promoting eye health awareness and access to eye care in developing countries stimulate market expansion.
Obstacles in the Eye Testing Equipment Industry Market
The eye testing equipment market faces challenges including high initial investment costs for advanced technologies, stringent regulatory approvals, and potential supply chain disruptions. Competitive pressure from established players and emerging technologies also poses a challenge. The impact of these restraints can be quantified by analyzing the market penetration rate of newer technologies and the fluctuations in equipment prices due to supply chain issues. These factors can limit market adoption and profitability for some players.
Future Opportunities in Eye Testing Equipment Industry
Emerging markets present significant growth opportunities, particularly in developing countries with increasing access to healthcare. Advancements in artificial intelligence and machine learning offer potential for automated diagnostics and improved screening capabilities. Integration with telehealth platforms provides opportunities for remote eye care delivery and expanded patient access. Growing demand for personalized eye care and focus on preventative measures also presents avenues for market expansion.
Major Players in the Eye Testing Equipment Industry Ecosystem
- AMETEK PIP Holdings Inc (Reichert Technologies)
- Bausch Health Companies Inc (Bausch + Lomb)
- Halma plc (Keeler Ltd)
- Heidelberg Engineering GmbH (Heidelberg Engineering Inc)
- Canon Inc
- Carl Zeiss Meditec AG
- Revenio Group PLC (iCare Finland OY)
- Oculus Inc
- Nidek Co Ltd
- Johnson & Johnson
- Alcon
- Essilor Luxottica (Essilor International SA)
- HEINE Optotechnik
Key Developments in Eye Testing Equipment Industry Industry
July 2022: Sightsavers launched a mobile eye care van equipped with ophthalmoscopes, retinoscopes, and other testing tools in Delhi-NCR, India, expanding access to eye care in underserved communities.
March 2022: Epipole launched the epiCam, a high-powered, ultra-portable, wireless fundus camera at Vision Expo East 2022, showcasing innovation in handheld retinal imaging technology.
Strategic Eye Testing Equipment Industry Market Forecast
The Eye Testing Equipment market is poised for significant growth over the forecast period (2025-2033), driven by technological innovation, expanding access to healthcare, and the increasing prevalence of eye diseases. The market is expected to benefit from the adoption of advanced diagnostic tools, remote eye care solutions, and increasing demand for convenient and efficient eye care services. This positive outlook anticipates substantial market expansion in both developed and developing economies, creating opportunities for existing and new market entrants.
Eye Testing Equipment Industry Segmentation
-
1. Type of Examination
-
1.1. Retina Examination
- 1.1.1. OCT Scanner
- 1.1.2. Fundus Camera
- 1.1.3. Visual Field Analyzer
- 1.1.4. Ophthalmoscope
- 1.1.5. Retinoscope
-
1.2. Cornea Examination
- 1.2.1. Wavefront Aberrometer
- 1.2.2. Specular Microscope
- 1.2.3. Other Cornea Examinations
-
1.3. General Examination
- 1.3.1. Autorefractor
- 1.3.2. Ophthalmic Ultrasound System
- 1.3.3. Tonometer
- 1.3.4. Phoropter
- 1.3.5. Keratometer
- 1.3.6. Lensometer
- 1.3.7. Other General Examinations
-
1.1. Retina Examination
-
2. End User
- 2.1. Eye Clinic
- 2.2. Hospital
- 2.3. Other End Users
Eye Testing Equipment Industry Segmentation By Geography
-
1. North America
- 1.1. United States
- 1.2. Canada
- 1.3. Mexico
-
2. Europe
- 2.1. Germany
- 2.2. United Kingdom
- 2.3. France
- 2.4. Italy
- 2.5. Spain
- 2.6. Rest of Europe
-
3. Asia Pacific
- 3.1. China
- 3.2. Japan
- 3.3. India
- 3.4. Australia
- 3.5. South Korea
- 3.6. Rest of Asia Pacific
-
4. Middle East and Africa
- 4.1. GCC
- 4.2. South Africa
- 4.3. Rest of Middle East and Africa
-
5. South America
- 5.1. Brazil
- 5.2. Argentina
- 5.3. Rest of South America
Eye Testing Equipment Industry REPORT HIGHLIGHTS
| Aspects | Details |
|---|---|
| Study Period | 2019-2033 |
| Base Year | 2024 |
| Estimated Year | 2025 |
| Forecast Period | 2025-2033 |
| Historical Period | 2019-2024 |
| Growth Rate | CAGR of 6.35% from 2019-2033 |
| Segmentation |
|
Table of Contents
- 1. Introduction
- 1.1. Research Scope
- 1.2. Market Segmentation
- 1.3. Research Methodology
- 1.4. Definitions and Assumptions
- 2. Executive Summary
- 2.1. Introduction
- 3. Market Dynamics
- 3.1. Introduction
- 3.2. Market Drivers
- 3.2.1. Rising Prevalence of Eye Diseases; Technological Advancements in Ophthalmic Devices; Increasing Government Initiatives to Control Visual Impairment
- 3.3. Market Restrains
- 3.3.1. High Cost of Eye Examination Equipment; Lack of Awareness and Low Accessibility to Eye Care in Low-income Economies
- 3.4. Market Trends
- 3.4.1. OCT Scanner Segment is Expected to Hold Significant Market Share Over the Forecast Period
- 4. Market Factor Analysis
- 4.1. Porters Five Forces
- 4.2. Supply/Value Chain
- 4.3. PESTEL analysis
- 4.4. Market Entropy
- 4.5. Patent/Trademark Analysis
- 5. Global Eye Testing Equipment Industry Analysis, Insights and Forecast, 2019-2031
- 5.1. Market Analysis, Insights and Forecast - by Type of Examination
- 5.1.1. Retina Examination
- 5.1.1.1. OCT Scanner
- 5.1.1.2. Fundus Camera
- 5.1.1.3. Visual Field Analyzer
- 5.1.1.4. Ophthalmoscope
- 5.1.1.5. Retinoscope
- 5.1.2. Cornea Examination
- 5.1.2.1. Wavefront Aberrometer
- 5.1.2.2. Specular Microscope
- 5.1.2.3. Other Cornea Examinations
- 5.1.3. General Examination
- 5.1.3.1. Autorefractor
- 5.1.3.2. Ophthalmic Ultrasound System
- 5.1.3.3. Tonometer
- 5.1.3.4. Phoropter
- 5.1.3.5. Keratometer
- 5.1.3.6. Lensometer
- 5.1.3.7. Other General Examinations
- 5.1.1. Retina Examination
- 5.2. Market Analysis, Insights and Forecast - by End User
- 5.2.1. Eye Clinic
- 5.2.2. Hospital
- 5.2.3. Other End Users
- 5.3. Market Analysis, Insights and Forecast - by Region
- 5.3.1. North America
- 5.3.2. Europe
- 5.3.3. Asia Pacific
- 5.3.4. Middle East and Africa
- 5.3.5. South America
- 5.1. Market Analysis, Insights and Forecast - by Type of Examination
- 6. North America Eye Testing Equipment Industry Analysis, Insights and Forecast, 2019-2031
- 6.1. Market Analysis, Insights and Forecast - by Type of Examination
- 6.1.1. Retina Examination
- 6.1.1.1. OCT Scanner
- 6.1.1.2. Fundus Camera
- 6.1.1.3. Visual Field Analyzer
- 6.1.1.4. Ophthalmoscope
- 6.1.1.5. Retinoscope
- 6.1.2. Cornea Examination
- 6.1.2.1. Wavefront Aberrometer
- 6.1.2.2. Specular Microscope
- 6.1.2.3. Other Cornea Examinations
- 6.1.3. General Examination
- 6.1.3.1. Autorefractor
- 6.1.3.2. Ophthalmic Ultrasound System
- 6.1.3.3. Tonometer
- 6.1.3.4. Phoropter
- 6.1.3.5. Keratometer
- 6.1.3.6. Lensometer
- 6.1.3.7. Other General Examinations
- 6.1.1. Retina Examination
- 6.2. Market Analysis, Insights and Forecast - by End User
- 6.2.1. Eye Clinic
- 6.2.2. Hospital
- 6.2.3. Other End Users
- 6.1. Market Analysis, Insights and Forecast - by Type of Examination
- 7. Europe Eye Testing Equipment Industry Analysis, Insights and Forecast, 2019-2031
- 7.1. Market Analysis, Insights and Forecast - by Type of Examination
- 7.1.1. Retina Examination
- 7.1.1.1. OCT Scanner
- 7.1.1.2. Fundus Camera
- 7.1.1.3. Visual Field Analyzer
- 7.1.1.4. Ophthalmoscope
- 7.1.1.5. Retinoscope
- 7.1.2. Cornea Examination
- 7.1.2.1. Wavefront Aberrometer
- 7.1.2.2. Specular Microscope
- 7.1.2.3. Other Cornea Examinations
- 7.1.3. General Examination
- 7.1.3.1. Autorefractor
- 7.1.3.2. Ophthalmic Ultrasound System
- 7.1.3.3. Tonometer
- 7.1.3.4. Phoropter
- 7.1.3.5. Keratometer
- 7.1.3.6. Lensometer
- 7.1.3.7. Other General Examinations
- 7.1.1. Retina Examination
- 7.2. Market Analysis, Insights and Forecast - by End User
- 7.2.1. Eye Clinic
- 7.2.2. Hospital
- 7.2.3. Other End Users
- 7.1. Market Analysis, Insights and Forecast - by Type of Examination
- 8. Asia Pacific Eye Testing Equipment Industry Analysis, Insights and Forecast, 2019-2031
- 8.1. Market Analysis, Insights and Forecast - by Type of Examination
- 8.1.1. Retina Examination
- 8.1.1.1. OCT Scanner
- 8.1.1.2. Fundus Camera
- 8.1.1.3. Visual Field Analyzer
- 8.1.1.4. Ophthalmoscope
- 8.1.1.5. Retinoscope
- 8.1.2. Cornea Examination
- 8.1.2.1. Wavefront Aberrometer
- 8.1.2.2. Specular Microscope
- 8.1.2.3. Other Cornea Examinations
- 8.1.3. General Examination
- 8.1.3.1. Autorefractor
- 8.1.3.2. Ophthalmic Ultrasound System
- 8.1.3.3. Tonometer
- 8.1.3.4. Phoropter
- 8.1.3.5. Keratometer
- 8.1.3.6. Lensometer
- 8.1.3.7. Other General Examinations
- 8.1.1. Retina Examination
- 8.2. Market Analysis, Insights and Forecast - by End User
- 8.2.1. Eye Clinic
- 8.2.2. Hospital
- 8.2.3. Other End Users
- 8.1. Market Analysis, Insights and Forecast - by Type of Examination
- 9. Middle East and Africa Eye Testing Equipment Industry Analysis, Insights and Forecast, 2019-2031
- 9.1. Market Analysis, Insights and Forecast - by Type of Examination
- 9.1.1. Retina Examination
- 9.1.1.1. OCT Scanner
- 9.1.1.2. Fundus Camera
- 9.1.1.3. Visual Field Analyzer
- 9.1.1.4. Ophthalmoscope
- 9.1.1.5. Retinoscope
- 9.1.2. Cornea Examination
- 9.1.2.1. Wavefront Aberrometer
- 9.1.2.2. Specular Microscope
- 9.1.2.3. Other Cornea Examinations
- 9.1.3. General Examination
- 9.1.3.1. Autorefractor
- 9.1.3.2. Ophthalmic Ultrasound System
- 9.1.3.3. Tonometer
- 9.1.3.4. Phoropter
- 9.1.3.5. Keratometer
- 9.1.3.6. Lensometer
- 9.1.3.7. Other General Examinations
- 9.1.1. Retina Examination
- 9.2. Market Analysis, Insights and Forecast - by End User
- 9.2.1. Eye Clinic
- 9.2.2. Hospital
- 9.2.3. Other End Users
- 9.1. Market Analysis, Insights and Forecast - by Type of Examination
- 10. South America Eye Testing Equipment Industry Analysis, Insights and Forecast, 2019-2031
- 10.1. Market Analysis, Insights and Forecast - by Type of Examination
- 10.1.1. Retina Examination
- 10.1.1.1. OCT Scanner
- 10.1.1.2. Fundus Camera
- 10.1.1.3. Visual Field Analyzer
- 10.1.1.4. Ophthalmoscope
- 10.1.1.5. Retinoscope
- 10.1.2. Cornea Examination
- 10.1.2.1. Wavefront Aberrometer
- 10.1.2.2. Specular Microscope
- 10.1.2.3. Other Cornea Examinations
- 10.1.3. General Examination
- 10.1.3.1. Autorefractor
- 10.1.3.2. Ophthalmic Ultrasound System
- 10.1.3.3. Tonometer
- 10.1.3.4. Phoropter
- 10.1.3.5. Keratometer
- 10.1.3.6. Lensometer
- 10.1.3.7. Other General Examinations
- 10.1.1. Retina Examination
- 10.2. Market Analysis, Insights and Forecast - by End User
- 10.2.1. Eye Clinic
- 10.2.2. Hospital
- 10.2.3. Other End Users
- 10.1. Market Analysis, Insights and Forecast - by Type of Examination
- 11. North America Eye Testing Equipment Industry Analysis, Insights and Forecast, 2019-2031
- 11.1. Market Analysis, Insights and Forecast - By Country/Sub-region
- 11.1.1 United States
- 11.1.2 Canada
- 11.1.3 Mexico
- 12. Europe Eye Testing Equipment Industry Analysis, Insights and Forecast, 2019-2031
- 12.1. Market Analysis, Insights and Forecast - By Country/Sub-region
- 12.1.1 Germany
- 12.1.2 United Kingdom
- 12.1.3 France
- 12.1.4 Italy
- 12.1.5 Spain
- 12.1.6 Rest of Europe
- 13. Asia Pacific Eye Testing Equipment Industry Analysis, Insights and Forecast, 2019-2031
- 13.1. Market Analysis, Insights and Forecast - By Country/Sub-region
- 13.1.1 China
- 13.1.2 Japan
- 13.1.3 India
- 13.1.4 Australia
- 13.1.5 South Korea
- 13.1.6 Rest of Asia Pacific
- 14. Middle East and Africa Eye Testing Equipment Industry Analysis, Insights and Forecast, 2019-2031
- 14.1. Market Analysis, Insights and Forecast - By Country/Sub-region
- 14.1.1 GCC
- 14.1.2 South Africa
- 14.1.3 Rest of Middle East and Africa
- 15. South America Eye Testing Equipment Industry Analysis, Insights and Forecast, 2019-2031
- 15.1. Market Analysis, Insights and Forecast - By Country/Sub-region
- 15.1.1 Brazil
- 15.1.2 Argentina
- 15.1.3 Rest of South America
- 16. Competitive Analysis
- 16.1. Global Market Share Analysis 2024
- 16.2. Company Profiles
- 16.2.1 AMETEK PIP Holdings Inc (Reichert Technologies)
- 16.2.1.1. Overview
- 16.2.1.2. Products
- 16.2.1.3. SWOT Analysis
- 16.2.1.4. Recent Developments
- 16.2.1.5. Financials (Based on Availability)
- 16.2.2 Bausch Health Companies Inc (Bausch + Lomb)
- 16.2.2.1. Overview
- 16.2.2.2. Products
- 16.2.2.3. SWOT Analysis
- 16.2.2.4. Recent Developments
- 16.2.2.5. Financials (Based on Availability)
- 16.2.3 Halma plc (Keeler Ltd)
- 16.2.3.1. Overview
- 16.2.3.2. Products
- 16.2.3.3. SWOT Analysis
- 16.2.3.4. Recent Developments
- 16.2.3.5. Financials (Based on Availability)
- 16.2.4 Heidelberg Engineering GmbH (Heidelberg Engineering Inc )
- 16.2.4.1. Overview
- 16.2.4.2. Products
- 16.2.4.3. SWOT Analysis
- 16.2.4.4. Recent Developments
- 16.2.4.5. Financials (Based on Availability)
- 16.2.5 Canon Inc
- 16.2.5.1. Overview
- 16.2.5.2. Products
- 16.2.5.3. SWOT Analysis
- 16.2.5.4. Recent Developments
- 16.2.5.5. Financials (Based on Availability)
- 16.2.6 Carl Zeiss Meditec AG
- 16.2.6.1. Overview
- 16.2.6.2. Products
- 16.2.6.3. SWOT Analysis
- 16.2.6.4. Recent Developments
- 16.2.6.5. Financials (Based on Availability)
- 16.2.7 Revenio Group PLC (iCare Finland OY)
- 16.2.7.1. Overview
- 16.2.7.2. Products
- 16.2.7.3. SWOT Analysis
- 16.2.7.4. Recent Developments
- 16.2.7.5. Financials (Based on Availability)
- 16.2.8 Oculus Inc
- 16.2.8.1. Overview
- 16.2.8.2. Products
- 16.2.8.3. SWOT Analysis
- 16.2.8.4. Recent Developments
- 16.2.8.5. Financials (Based on Availability)
- 16.2.9 Nidek Co Ltd
- 16.2.9.1. Overview
- 16.2.9.2. Products
- 16.2.9.3. SWOT Analysis
- 16.2.9.4. Recent Developments
- 16.2.9.5. Financials (Based on Availability)
- 16.2.10 Johnson & Johnson
- 16.2.10.1. Overview
- 16.2.10.2. Products
- 16.2.10.3. SWOT Analysis
- 16.2.10.4. Recent Developments
- 16.2.10.5. Financials (Based on Availability)
- 16.2.11 Alcon
- 16.2.11.1. Overview
- 16.2.11.2. Products
- 16.2.11.3. SWOT Analysis
- 16.2.11.4. Recent Developments
- 16.2.11.5. Financials (Based on Availability)
- 16.2.12 Essilor Luxottica (Essilor International SA)
- 16.2.12.1. Overview
- 16.2.12.2. Products
- 16.2.12.3. SWOT Analysis
- 16.2.12.4. Recent Developments
- 16.2.12.5. Financials (Based on Availability)
- 16.2.13 HEINE Optotechnik
- 16.2.13.1. Overview
- 16.2.13.2. Products
- 16.2.13.3. SWOT Analysis
- 16.2.13.4. Recent Developments
- 16.2.13.5. Financials (Based on Availability)
- 16.2.1 AMETEK PIP Holdings Inc (Reichert Technologies)
List of Figures
- Figure 1: Global Eye Testing Equipment Industry Revenue Breakdown (Million, %) by Region 2024 & 2032
- Figure 2: Global Eye Testing Equipment Industry Volume Breakdown (K Unit, %) by Region 2024 & 2032
- Figure 3: North America Eye Testing Equipment Industry Revenue (Million), by Country 2024 & 2032
- Figure 4: North America Eye Testing Equipment Industry Volume (K Unit), by Country 2024 & 2032
- Figure 5: North America Eye Testing Equipment Industry Revenue Share (%), by Country 2024 & 2032
- Figure 6: North America Eye Testing Equipment Industry Volume Share (%), by Country 2024 & 2032
- Figure 7: Europe Eye Testing Equipment Industry Revenue (Million), by Country 2024 & 2032
- Figure 8: Europe Eye Testing Equipment Industry Volume (K Unit), by Country 2024 & 2032
- Figure 9: Europe Eye Testing Equipment Industry Revenue Share (%), by Country 2024 & 2032
- Figure 10: Europe Eye Testing Equipment Industry Volume Share (%), by Country 2024 & 2032
- Figure 11: Asia Pacific Eye Testing Equipment Industry Revenue (Million), by Country 2024 & 2032
- Figure 12: Asia Pacific Eye Testing Equipment Industry Volume (K Unit), by Country 2024 & 2032
- Figure 13: Asia Pacific Eye Testing Equipment Industry Revenue Share (%), by Country 2024 & 2032
- Figure 14: Asia Pacific Eye Testing Equipment Industry Volume Share (%), by Country 2024 & 2032
- Figure 15: Middle East and Africa Eye Testing Equipment Industry Revenue (Million), by Country 2024 & 2032
- Figure 16: Middle East and Africa Eye Testing Equipment Industry Volume (K Unit), by Country 2024 & 2032
- Figure 17: Middle East and Africa Eye Testing Equipment Industry Revenue Share (%), by Country 2024 & 2032
- Figure 18: Middle East and Africa Eye Testing Equipment Industry Volume Share (%), by Country 2024 & 2032
- Figure 19: South America Eye Testing Equipment Industry Revenue (Million), by Country 2024 & 2032
- Figure 20: South America Eye Testing Equipment Industry Volume (K Unit), by Country 2024 & 2032
- Figure 21: South America Eye Testing Equipment Industry Revenue Share (%), by Country 2024 & 2032
- Figure 22: South America Eye Testing Equipment Industry Volume Share (%), by Country 2024 & 2032
- Figure 23: North America Eye Testing Equipment Industry Revenue (Million), by Type of Examination 2024 & 2032
- Figure 24: North America Eye Testing Equipment Industry Volume (K Unit), by Type of Examination 2024 & 2032
- Figure 25: North America Eye Testing Equipment Industry Revenue Share (%), by Type of Examination 2024 & 2032
- Figure 26: North America Eye Testing Equipment Industry Volume Share (%), by Type of Examination 2024 & 2032
- Figure 27: North America Eye Testing Equipment Industry Revenue (Million), by End User 2024 & 2032
- Figure 28: North America Eye Testing Equipment Industry Volume (K Unit), by End User 2024 & 2032
- Figure 29: North America Eye Testing Equipment Industry Revenue Share (%), by End User 2024 & 2032
- Figure 30: North America Eye Testing Equipment Industry Volume Share (%), by End User 2024 & 2032
- Figure 31: North America Eye Testing Equipment Industry Revenue (Million), by Country 2024 & 2032
- Figure 32: North America Eye Testing Equipment Industry Volume (K Unit), by Country 2024 & 2032
- Figure 33: North America Eye Testing Equipment Industry Revenue Share (%), by Country 2024 & 2032
- Figure 34: North America Eye Testing Equipment Industry Volume Share (%), by Country 2024 & 2032
- Figure 35: Europe Eye Testing Equipment Industry Revenue (Million), by Type of Examination 2024 & 2032
- Figure 36: Europe Eye Testing Equipment Industry Volume (K Unit), by Type of Examination 2024 & 2032
- Figure 37: Europe Eye Testing Equipment Industry Revenue Share (%), by Type of Examination 2024 & 2032
- Figure 38: Europe Eye Testing Equipment Industry Volume Share (%), by Type of Examination 2024 & 2032
- Figure 39: Europe Eye Testing Equipment Industry Revenue (Million), by End User 2024 & 2032
- Figure 40: Europe Eye Testing Equipment Industry Volume (K Unit), by End User 2024 & 2032
- Figure 41: Europe Eye Testing Equipment Industry Revenue Share (%), by End User 2024 & 2032
- Figure 42: Europe Eye Testing Equipment Industry Volume Share (%), by End User 2024 & 2032
- Figure 43: Europe Eye Testing Equipment Industry Revenue (Million), by Country 2024 & 2032
- Figure 44: Europe Eye Testing Equipment Industry Volume (K Unit), by Country 2024 & 2032
- Figure 45: Europe Eye Testing Equipment Industry Revenue Share (%), by Country 2024 & 2032
- Figure 46: Europe Eye Testing Equipment Industry Volume Share (%), by Country 2024 & 2032
- Figure 47: Asia Pacific Eye Testing Equipment Industry Revenue (Million), by Type of Examination 2024 & 2032
- Figure 48: Asia Pacific Eye Testing Equipment Industry Volume (K Unit), by Type of Examination 2024 & 2032
- Figure 49: Asia Pacific Eye Testing Equipment Industry Revenue Share (%), by Type of Examination 2024 & 2032
- Figure 50: Asia Pacific Eye Testing Equipment Industry Volume Share (%), by Type of Examination 2024 & 2032
- Figure 51: Asia Pacific Eye Testing Equipment Industry Revenue (Million), by End User 2024 & 2032
- Figure 52: Asia Pacific Eye Testing Equipment Industry Volume (K Unit), by End User 2024 & 2032
- Figure 53: Asia Pacific Eye Testing Equipment Industry Revenue Share (%), by End User 2024 & 2032
- Figure 54: Asia Pacific Eye Testing Equipment Industry Volume Share (%), by End User 2024 & 2032
- Figure 55: Asia Pacific Eye Testing Equipment Industry Revenue (Million), by Country 2024 & 2032
- Figure 56: Asia Pacific Eye Testing Equipment Industry Volume (K Unit), by Country 2024 & 2032
- Figure 57: Asia Pacific Eye Testing Equipment Industry Revenue Share (%), by Country 2024 & 2032
- Figure 58: Asia Pacific Eye Testing Equipment Industry Volume Share (%), by Country 2024 & 2032
- Figure 59: Middle East and Africa Eye Testing Equipment Industry Revenue (Million), by Type of Examination 2024 & 2032
- Figure 60: Middle East and Africa Eye Testing Equipment Industry Volume (K Unit), by Type of Examination 2024 & 2032
- Figure 61: Middle East and Africa Eye Testing Equipment Industry Revenue Share (%), by Type of Examination 2024 & 2032
- Figure 62: Middle East and Africa Eye Testing Equipment Industry Volume Share (%), by Type of Examination 2024 & 2032
- Figure 63: Middle East and Africa Eye Testing Equipment Industry Revenue (Million), by End User 2024 & 2032
- Figure 64: Middle East and Africa Eye Testing Equipment Industry Volume (K Unit), by End User 2024 & 2032
- Figure 65: Middle East and Africa Eye Testing Equipment Industry Revenue Share (%), by End User 2024 & 2032
- Figure 66: Middle East and Africa Eye Testing Equipment Industry Volume Share (%), by End User 2024 & 2032
- Figure 67: Middle East and Africa Eye Testing Equipment Industry Revenue (Million), by Country 2024 & 2032
- Figure 68: Middle East and Africa Eye Testing Equipment Industry Volume (K Unit), by Country 2024 & 2032
- Figure 69: Middle East and Africa Eye Testing Equipment Industry Revenue Share (%), by Country 2024 & 2032
- Figure 70: Middle East and Africa Eye Testing Equipment Industry Volume Share (%), by Country 2024 & 2032
- Figure 71: South America Eye Testing Equipment Industry Revenue (Million), by Type of Examination 2024 & 2032
- Figure 72: South America Eye Testing Equipment Industry Volume (K Unit), by Type of Examination 2024 & 2032
- Figure 73: South America Eye Testing Equipment Industry Revenue Share (%), by Type of Examination 2024 & 2032
- Figure 74: South America Eye Testing Equipment Industry Volume Share (%), by Type of Examination 2024 & 2032
- Figure 75: South America Eye Testing Equipment Industry Revenue (Million), by End User 2024 & 2032
- Figure 76: South America Eye Testing Equipment Industry Volume (K Unit), by End User 2024 & 2032
- Figure 77: South America Eye Testing Equipment Industry Revenue Share (%), by End User 2024 & 2032
- Figure 78: South America Eye Testing Equipment Industry Volume Share (%), by End User 2024 & 2032
- Figure 79: South America Eye Testing Equipment Industry Revenue (Million), by Country 2024 & 2032
- Figure 80: South America Eye Testing Equipment Industry Volume (K Unit), by Country 2024 & 2032
- Figure 81: South America Eye Testing Equipment Industry Revenue Share (%), by Country 2024 & 2032
- Figure 82: South America Eye Testing Equipment Industry Volume Share (%), by Country 2024 & 2032
List of Tables
- Table 1: Global Eye Testing Equipment Industry Revenue Million Forecast, by Region 2019 & 2032
- Table 2: Global Eye Testing Equipment Industry Volume K Unit Forecast, by Region 2019 & 2032
- Table 3: Global Eye Testing Equipment Industry Revenue Million Forecast, by Type of Examination 2019 & 2032
- Table 4: Global Eye Testing Equipment Industry Volume K Unit Forecast, by Type of Examination 2019 & 2032
- Table 5: Global Eye Testing Equipment Industry Revenue Million Forecast, by End User 2019 & 2032
- Table 6: Global Eye Testing Equipment Industry Volume K Unit Forecast, by End User 2019 & 2032
- Table 7: Global Eye Testing Equipment Industry Revenue Million Forecast, by Region 2019 & 2032
- Table 8: Global Eye Testing Equipment Industry Volume K Unit Forecast, by Region 2019 & 2032
- Table 9: Global Eye Testing Equipment Industry Revenue Million Forecast, by Country 2019 & 2032
- Table 10: Global Eye Testing Equipment Industry Volume K Unit Forecast, by Country 2019 & 2032
- Table 11: United States Eye Testing Equipment Industry Revenue (Million) Forecast, by Application 2019 & 2032
- Table 12: United States Eye Testing Equipment Industry Volume (K Unit) Forecast, by Application 2019 & 2032
- Table 13: Canada Eye Testing Equipment Industry Revenue (Million) Forecast, by Application 2019 & 2032
- Table 14: Canada Eye Testing Equipment Industry Volume (K Unit) Forecast, by Application 2019 & 2032
- Table 15: Mexico Eye Testing Equipment Industry Revenue (Million) Forecast, by Application 2019 & 2032
- Table 16: Mexico Eye Testing Equipment Industry Volume (K Unit) Forecast, by Application 2019 & 2032
- Table 17: Global Eye Testing Equipment Industry Revenue Million Forecast, by Country 2019 & 2032
- Table 18: Global Eye Testing Equipment Industry Volume K Unit Forecast, by Country 2019 & 2032
- Table 19: Germany Eye Testing Equipment Industry Revenue (Million) Forecast, by Application 2019 & 2032
- Table 20: Germany Eye Testing Equipment Industry Volume (K Unit) Forecast, by Application 2019 & 2032
- Table 21: United Kingdom Eye Testing Equipment Industry Revenue (Million) Forecast, by Application 2019 & 2032
- Table 22: United Kingdom Eye Testing Equipment Industry Volume (K Unit) Forecast, by Application 2019 & 2032
- Table 23: France Eye Testing Equipment Industry Revenue (Million) Forecast, by Application 2019 & 2032
- Table 24: France Eye Testing Equipment Industry Volume (K Unit) Forecast, by Application 2019 & 2032
- Table 25: Italy Eye Testing Equipment Industry Revenue (Million) Forecast, by Application 2019 & 2032
- Table 26: Italy Eye Testing Equipment Industry Volume (K Unit) Forecast, by Application 2019 & 2032
- Table 27: Spain Eye Testing Equipment Industry Revenue (Million) Forecast, by Application 2019 & 2032
- Table 28: Spain Eye Testing Equipment Industry Volume (K Unit) Forecast, by Application 2019 & 2032
- Table 29: Rest of Europe Eye Testing Equipment Industry Revenue (Million) Forecast, by Application 2019 & 2032
- Table 30: Rest of Europe Eye Testing Equipment Industry Volume (K Unit) Forecast, by Application 2019 & 2032
- Table 31: Global Eye Testing Equipment Industry Revenue Million Forecast, by Country 2019 & 2032
- Table 32: Global Eye Testing Equipment Industry Volume K Unit Forecast, by Country 2019 & 2032
- Table 33: China Eye Testing Equipment Industry Revenue (Million) Forecast, by Application 2019 & 2032
- Table 34: China Eye Testing Equipment Industry Volume (K Unit) Forecast, by Application 2019 & 2032
- Table 35: Japan Eye Testing Equipment Industry Revenue (Million) Forecast, by Application 2019 & 2032
- Table 36: Japan Eye Testing Equipment Industry Volume (K Unit) Forecast, by Application 2019 & 2032
- Table 37: India Eye Testing Equipment Industry Revenue (Million) Forecast, by Application 2019 & 2032
- Table 38: India Eye Testing Equipment Industry Volume (K Unit) Forecast, by Application 2019 & 2032
- Table 39: Australia Eye Testing Equipment Industry Revenue (Million) Forecast, by Application 2019 & 2032
- Table 40: Australia Eye Testing Equipment Industry Volume (K Unit) Forecast, by Application 2019 & 2032
- Table 41: South Korea Eye Testing Equipment Industry Revenue (Million) Forecast, by Application 2019 & 2032
- Table 42: South Korea Eye Testing Equipment Industry Volume (K Unit) Forecast, by Application 2019 & 2032
- Table 43: Rest of Asia Pacific Eye Testing Equipment Industry Revenue (Million) Forecast, by Application 2019 & 2032
- Table 44: Rest of Asia Pacific Eye Testing Equipment Industry Volume (K Unit) Forecast, by Application 2019 & 2032
- Table 45: Global Eye Testing Equipment Industry Revenue Million Forecast, by Country 2019 & 2032
- Table 46: Global Eye Testing Equipment Industry Volume K Unit Forecast, by Country 2019 & 2032
- Table 47: GCC Eye Testing Equipment Industry Revenue (Million) Forecast, by Application 2019 & 2032
- Table 48: GCC Eye Testing Equipment Industry Volume (K Unit) Forecast, by Application 2019 & 2032
- Table 49: South Africa Eye Testing Equipment Industry Revenue (Million) Forecast, by Application 2019 & 2032
- Table 50: South Africa Eye Testing Equipment Industry Volume (K Unit) Forecast, by Application 2019 & 2032
- Table 51: Rest of Middle East and Africa Eye Testing Equipment Industry Revenue (Million) Forecast, by Application 2019 & 2032
- Table 52: Rest of Middle East and Africa Eye Testing Equipment Industry Volume (K Unit) Forecast, by Application 2019 & 2032
- Table 53: Global Eye Testing Equipment Industry Revenue Million Forecast, by Country 2019 & 2032
- Table 54: Global Eye Testing Equipment Industry Volume K Unit Forecast, by Country 2019 & 2032
- Table 55: Brazil Eye Testing Equipment Industry Revenue (Million) Forecast, by Application 2019 & 2032
- Table 56: Brazil Eye Testing Equipment Industry Volume (K Unit) Forecast, by Application 2019 & 2032
- Table 57: Argentina Eye Testing Equipment Industry Revenue (Million) Forecast, by Application 2019 & 2032
- Table 58: Argentina Eye Testing Equipment Industry Volume (K Unit) Forecast, by Application 2019 & 2032
- Table 59: Rest of South America Eye Testing Equipment Industry Revenue (Million) Forecast, by Application 2019 & 2032
- Table 60: Rest of South America Eye Testing Equipment Industry Volume (K Unit) Forecast, by Application 2019 & 2032
- Table 61: Global Eye Testing Equipment Industry Revenue Million Forecast, by Type of Examination 2019 & 2032
- Table 62: Global Eye Testing Equipment Industry Volume K Unit Forecast, by Type of Examination 2019 & 2032
- Table 63: Global Eye Testing Equipment Industry Revenue Million Forecast, by End User 2019 & 2032
- Table 64: Global Eye Testing Equipment Industry Volume K Unit Forecast, by End User 2019 & 2032
- Table 65: Global Eye Testing Equipment Industry Revenue Million Forecast, by Country 2019 & 2032
- Table 66: Global Eye Testing Equipment Industry Volume K Unit Forecast, by Country 2019 & 2032
- Table 67: United States Eye Testing Equipment Industry Revenue (Million) Forecast, by Application 2019 & 2032
- Table 68: United States Eye Testing Equipment Industry Volume (K Unit) Forecast, by Application 2019 & 2032
- Table 69: Canada Eye Testing Equipment Industry Revenue (Million) Forecast, by Application 2019 & 2032
- Table 70: Canada Eye Testing Equipment Industry Volume (K Unit) Forecast, by Application 2019 & 2032
- Table 71: Mexico Eye Testing Equipment Industry Revenue (Million) Forecast, by Application 2019 & 2032
- Table 72: Mexico Eye Testing Equipment Industry Volume (K Unit) Forecast, by Application 2019 & 2032
- Table 73: Global Eye Testing Equipment Industry Revenue Million Forecast, by Type of Examination 2019 & 2032
- Table 74: Global Eye Testing Equipment Industry Volume K Unit Forecast, by Type of Examination 2019 & 2032
- Table 75: Global Eye Testing Equipment Industry Revenue Million Forecast, by End User 2019 & 2032
- Table 76: Global Eye Testing Equipment Industry Volume K Unit Forecast, by End User 2019 & 2032
- Table 77: Global Eye Testing Equipment Industry Revenue Million Forecast, by Country 2019 & 2032
- Table 78: Global Eye Testing Equipment Industry Volume K Unit Forecast, by Country 2019 & 2032
- Table 79: Germany Eye Testing Equipment Industry Revenue (Million) Forecast, by Application 2019 & 2032
- Table 80: Germany Eye Testing Equipment Industry Volume (K Unit) Forecast, by Application 2019 & 2032
- Table 81: United Kingdom Eye Testing Equipment Industry Revenue (Million) Forecast, by Application 2019 & 2032
- Table 82: United Kingdom Eye Testing Equipment Industry Volume (K Unit) Forecast, by Application 2019 & 2032
- Table 83: France Eye Testing Equipment Industry Revenue (Million) Forecast, by Application 2019 & 2032
- Table 84: France Eye Testing Equipment Industry Volume (K Unit) Forecast, by Application 2019 & 2032
- Table 85: Italy Eye Testing Equipment Industry Revenue (Million) Forecast, by Application 2019 & 2032
- Table 86: Italy Eye Testing Equipment Industry Volume (K Unit) Forecast, by Application 2019 & 2032
- Table 87: Spain Eye Testing Equipment Industry Revenue (Million) Forecast, by Application 2019 & 2032
- Table 88: Spain Eye Testing Equipment Industry Volume (K Unit) Forecast, by Application 2019 & 2032
- Table 89: Rest of Europe Eye Testing Equipment Industry Revenue (Million) Forecast, by Application 2019 & 2032
- Table 90: Rest of Europe Eye Testing Equipment Industry Volume (K Unit) Forecast, by Application 2019 & 2032
- Table 91: Global Eye Testing Equipment Industry Revenue Million Forecast, by Type of Examination 2019 & 2032
- Table 92: Global Eye Testing Equipment Industry Volume K Unit Forecast, by Type of Examination 2019 & 2032
- Table 93: Global Eye Testing Equipment Industry Revenue Million Forecast, by End User 2019 & 2032
- Table 94: Global Eye Testing Equipment Industry Volume K Unit Forecast, by End User 2019 & 2032
- Table 95: Global Eye Testing Equipment Industry Revenue Million Forecast, by Country 2019 & 2032
- Table 96: Global Eye Testing Equipment Industry Volume K Unit Forecast, by Country 2019 & 2032
- Table 97: China Eye Testing Equipment Industry Revenue (Million) Forecast, by Application 2019 & 2032
- Table 98: China Eye Testing Equipment Industry Volume (K Unit) Forecast, by Application 2019 & 2032
- Table 99: Japan Eye Testing Equipment Industry Revenue (Million) Forecast, by Application 2019 & 2032
- Table 100: Japan Eye Testing Equipment Industry Volume (K Unit) Forecast, by Application 2019 & 2032
- Table 101: India Eye Testing Equipment Industry Revenue (Million) Forecast, by Application 2019 & 2032
- Table 102: India Eye Testing Equipment Industry Volume (K Unit) Forecast, by Application 2019 & 2032
- Table 103: Australia Eye Testing Equipment Industry Revenue (Million) Forecast, by Application 2019 & 2032
- Table 104: Australia Eye Testing Equipment Industry Volume (K Unit) Forecast, by Application 2019 & 2032
- Table 105: South Korea Eye Testing Equipment Industry Revenue (Million) Forecast, by Application 2019 & 2032
- Table 106: South Korea Eye Testing Equipment Industry Volume (K Unit) Forecast, by Application 2019 & 2032
- Table 107: Rest of Asia Pacific Eye Testing Equipment Industry Revenue (Million) Forecast, by Application 2019 & 2032
- Table 108: Rest of Asia Pacific Eye Testing Equipment Industry Volume (K Unit) Forecast, by Application 2019 & 2032
- Table 109: Global Eye Testing Equipment Industry Revenue Million Forecast, by Type of Examination 2019 & 2032
- Table 110: Global Eye Testing Equipment Industry Volume K Unit Forecast, by Type of Examination 2019 & 2032
- Table 111: Global Eye Testing Equipment Industry Revenue Million Forecast, by End User 2019 & 2032
- Table 112: Global Eye Testing Equipment Industry Volume K Unit Forecast, by End User 2019 & 2032
- Table 113: Global Eye Testing Equipment Industry Revenue Million Forecast, by Country 2019 & 2032
- Table 114: Global Eye Testing Equipment Industry Volume K Unit Forecast, by Country 2019 & 2032
- Table 115: GCC Eye Testing Equipment Industry Revenue (Million) Forecast, by Application 2019 & 2032
- Table 116: GCC Eye Testing Equipment Industry Volume (K Unit) Forecast, by Application 2019 & 2032
- Table 117: South Africa Eye Testing Equipment Industry Revenue (Million) Forecast, by Application 2019 & 2032
- Table 118: South Africa Eye Testing Equipment Industry Volume (K Unit) Forecast, by Application 2019 & 2032
- Table 119: Rest of Middle East and Africa Eye Testing Equipment Industry Revenue (Million) Forecast, by Application 2019 & 2032
- Table 120: Rest of Middle East and Africa Eye Testing Equipment Industry Volume (K Unit) Forecast, by Application 2019 & 2032
- Table 121: Global Eye Testing Equipment Industry Revenue Million Forecast, by Type of Examination 2019 & 2032
- Table 122: Global Eye Testing Equipment Industry Volume K Unit Forecast, by Type of Examination 2019 & 2032
- Table 123: Global Eye Testing Equipment Industry Revenue Million Forecast, by End User 2019 & 2032
- Table 124: Global Eye Testing Equipment Industry Volume K Unit Forecast, by End User 2019 & 2032
- Table 125: Global Eye Testing Equipment Industry Revenue Million Forecast, by Country 2019 & 2032
- Table 126: Global Eye Testing Equipment Industry Volume K Unit Forecast, by Country 2019 & 2032
- Table 127: Brazil Eye Testing Equipment Industry Revenue (Million) Forecast, by Application 2019 & 2032
- Table 128: Brazil Eye Testing Equipment Industry Volume (K Unit) Forecast, by Application 2019 & 2032
- Table 129: Argentina Eye Testing Equipment Industry Revenue (Million) Forecast, by Application 2019 & 2032
- Table 130: Argentina Eye Testing Equipment Industry Volume (K Unit) Forecast, by Application 2019 & 2032
- Table 131: Rest of South America Eye Testing Equipment Industry Revenue (Million) Forecast, by Application 2019 & 2032
- Table 132: Rest of South America Eye Testing Equipment Industry Volume (K Unit) Forecast, by Application 2019 & 2032
Frequently Asked Questions
1. What is the projected Compound Annual Growth Rate (CAGR) of the Eye Testing Equipment Industry?
The projected CAGR is approximately 6.35%.
2. Which companies are prominent players in the Eye Testing Equipment Industry?
Key companies in the market include AMETEK PIP Holdings Inc (Reichert Technologies), Bausch Health Companies Inc (Bausch + Lomb), Halma plc (Keeler Ltd), Heidelberg Engineering GmbH (Heidelberg Engineering Inc ), Canon Inc, Carl Zeiss Meditec AG, Revenio Group PLC (iCare Finland OY), Oculus Inc , Nidek Co Ltd, Johnson & Johnson, Alcon, Essilor Luxottica (Essilor International SA), HEINE Optotechnik.
3. What are the main segments of the Eye Testing Equipment Industry?
The market segments include Type of Examination, End User.
4. Can you provide details about the market size?
The market size is estimated to be USD 4.79 Million as of 2022.
5. What are some drivers contributing to market growth?
Rising Prevalence of Eye Diseases; Technological Advancements in Ophthalmic Devices; Increasing Government Initiatives to Control Visual Impairment.
6. What are the notable trends driving market growth?
OCT Scanner Segment is Expected to Hold Significant Market Share Over the Forecast Period.
7. Are there any restraints impacting market growth?
High Cost of Eye Examination Equipment; Lack of Awareness and Low Accessibility to Eye Care in Low-income Economies.
8. Can you provide examples of recent developments in the market?
In July 2022, a mobile van was launched by Sightsavers under its National Truckers Eye Health Programme with the support of Cholamandalam Investment and Finance Company Limited (Chola) in Delhi-NCR to provide eye care services to the truckers' community. The van is equipped with the necessary tools and supplies, specifically an ophthalmoscope, a retinoscope, trial lenses, trial frames, a lensometer, vision charts, an occluder, and a drum for vision testing.
9. What pricing options are available for accessing the report?
Pricing options include single-user, multi-user, and enterprise licenses priced at USD 4750, USD 5250, and USD 8750 respectively.
10. Is the market size provided in terms of value or volume?
The market size is provided in terms of value, measured in Million and volume, measured in K Unit.
11. Are there any specific market keywords associated with the report?
Yes, the market keyword associated with the report is "Eye Testing Equipment Industry," which aids in identifying and referencing the specific market segment covered.
12. How do I determine which pricing option suits my needs best?
The pricing options vary based on user requirements and access needs. Individual users may opt for single-user licenses, while businesses requiring broader access may choose multi-user or enterprise licenses for cost-effective access to the report.
13. Are there any additional resources or data provided in the Eye Testing Equipment Industry report?
While the report offers comprehensive insights, it's advisable to review the specific contents or supplementary materials provided to ascertain if additional resources or data are available.
14. How can I stay updated on further developments or reports in the Eye Testing Equipment Industry?
To stay informed about further developments, trends, and reports in the Eye Testing Equipment Industry, consider subscribing to industry newsletters, following relevant companies and organizations, or regularly checking reputable industry news sources and publications.
Methodology
Step 1 - Identification of Relevant Samples Size from Population Database


Step 2 - Approaches for Defining Global Market Size (Value, Volume* & Price*)

Note*: In applicable scenarios
Step 3 - Data Sources
Primary Research
- Web Analytics
- Survey Reports
- Research Institute
- Latest Research Reports
- Opinion Leaders
Secondary Research
- Annual Reports
- White Paper
- Latest Press Release
- Industry Association
- Paid Database
- Investor Presentations

Step 4 - Data Triangulation
Involves using different sources of information in order to increase the validity of a study
These sources are likely to be stakeholders in a program - participants, other researchers, program staff, other community members, and so on.
Then we put all data in single framework & apply various statistical tools to find out the dynamic on the market.
During the analysis stage, feedback from the stakeholder groups would be compared to determine areas of agreement as well as areas of divergence
