

Key Insights
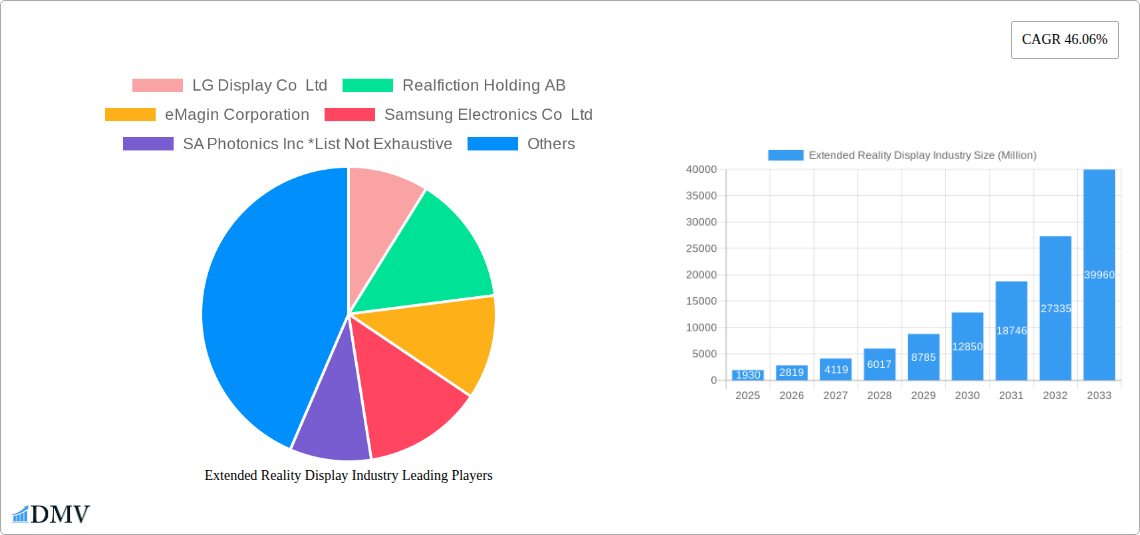
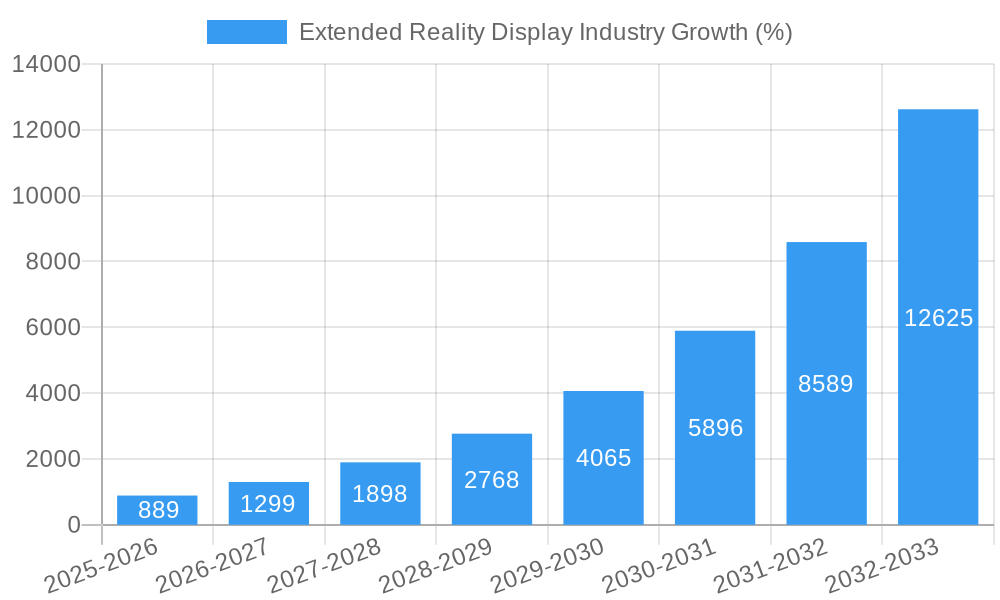
The Extended Reality (XR) display market is experiencing explosive growth, projected to reach \$1.93 billion in 2025 and exhibiting a remarkable Compound Annual Growth Rate (CAGR) of 46.06% from 2025 to 2033. This surge is driven by the increasing adoption of XR technologies across diverse sectors, including gaming and entertainment, healthcare (surgical simulations and training), education (immersive learning experiences), military and defense (simulation and training), automotive and manufacturing (design and prototyping), and retail (virtual try-ons and interactive displays). Key trends fueling this expansion include the development of higher-resolution, lighter, and more energy-efficient displays, advancements in micro-LED and OLED technologies offering superior image quality and improved performance, and the decreasing cost of XR hardware and software. The integration of XR displays into wearable devices further contributes to market growth. However, challenges remain, including the relatively high cost of premium XR displays, concerns regarding potential health effects from prolonged XR use, and the need for robust content development to fully leverage the potential of the technology. Continued innovation in display technology and a growing user base are expected to overcome these hurdles and drive sustained market expansion.
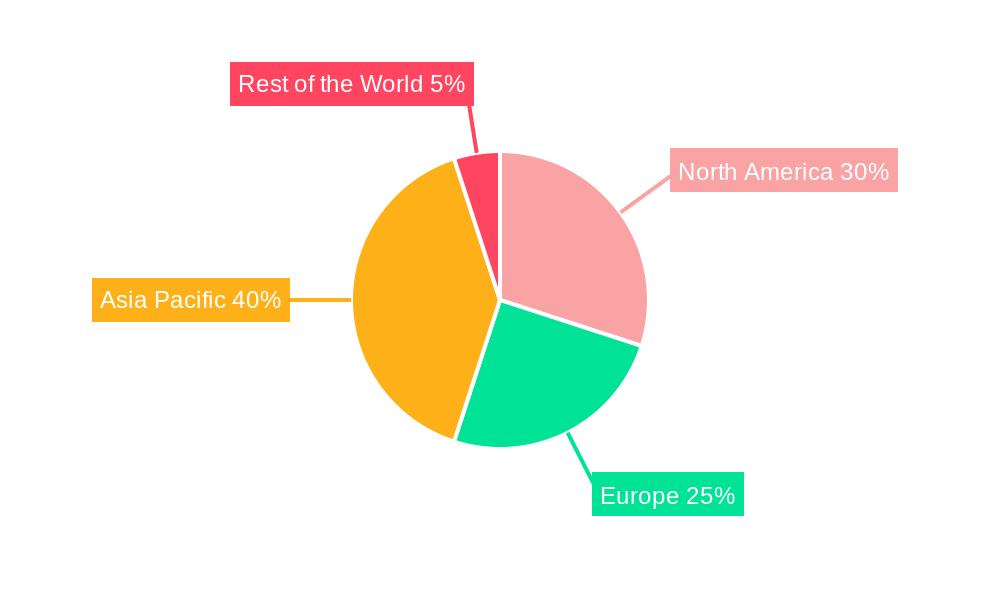
The competitive landscape is characterized by prominent players such as LG Display, Samsung Electronics, BOE Technology Group, and others, each vying for market share through technological advancements and strategic partnerships. The Asia-Pacific region is expected to dominate the market due to significant manufacturing hubs and a rapidly expanding XR technology user base. While North America and Europe hold considerable market value, they are likely to see a faster growth rate in later years of the forecast period as adoption increases. Segmentation by display type reveals a preference for LCDs in the near term due to their cost-effectiveness, while OLED and MicroLED displays are projected to gain significant traction over the forecast period owing to superior picture quality. The diversity of end-user industries suggests that the XR display market is poised for sustained and widespread growth across various sectors, driven by technological progress, decreasing production costs, and increasing demand for immersive experiences.
Extended Reality Display Industry Market Composition & Trends
This comprehensive report delves into the dynamic Extended Reality (XR) Display industry, providing a detailed analysis of its market composition and prevailing trends from 2019 to 2033. The study period covers the historical period (2019-2024), the base year (2025), and the forecast period (2025-2033). We evaluate market concentration, revealing the share distribution amongst key players like LG Display Co Ltd, Samsung Electronics Co Ltd, and BOE Technology Group Co Ltd, amongst others. The report also examines innovation catalysts such as advancements in OLED and MicroLED technologies, analyzing their impact on market growth. Furthermore, we assess the regulatory landscape, identifying key policies influencing XR display adoption across various sectors. The analysis includes an in-depth look at substitute products and their competitive impact, as well as an examination of evolving end-user profiles across diverse sectors such as gaming, healthcare, and automotive. Finally, we analyze M&A activities within the industry, quantifying deal values in Millions USD and exploring their effects on market consolidation and competitive dynamics. The report also features an estimated market size of xx Million in 2025 and projects future growth based on detailed market trends analysis.
- Market Share Distribution: Precise breakdown of market share among key players (LG Display, Samsung, BOE, etc.) in 2025.
- M&A Deal Values: Analysis of significant M&A transactions (in Millions USD) and their impact on market structure.
- Innovation Catalysts: Deep dive into technological breakthroughs driving market growth, including LCD, OLED, and MicroLED advancements.
- Regulatory Landscape: Assessment of relevant regulations and their influence on market expansion across different regions.
Extended Reality Display Industry Industry Evolution
This section provides a comprehensive analysis of the XR display industry’s evolution from 2019 to 2033. We meticulously track market growth trajectories, revealing compound annual growth rates (CAGRs) for various segments. The report meticulously documents the technological advancements shaping the industry, from the rise of high-resolution displays to the integration of innovative features like transparent displays. We also analyze the influence of shifting consumer demands, examining how preferences for enhanced visuals, portability, and immersive experiences are driving product development and market segmentation. Specific data points, including growth rates and adoption metrics for key display types (LCD, OLED, etc.) and end-user industries (gaming, healthcare, automotive, etc.), are incorporated to offer a clear understanding of market dynamics. The report also explores the impact of emerging technologies like MicroLED and their potential to disrupt the existing market landscape. Furthermore, consumer preferences for enhanced resolution, refresh rates, and power efficiency are thoroughly examined. We incorporate detailed analysis of the growth trends for each segment and factors driving growth within each segment.
Leading Regions, Countries, or Segments in Extended Reality Display Industry
This section identifies the leading regions, countries, and segments within the XR display market. A detailed analysis reveals the dominant players across different display types (LCD, OLED, Other) and end-user industries (Gaming & Entertainment, Healthcare, Education, Military & Defense, Automotive & Manufacturing, Retail, Other). This includes detailed insights into market size (in Millions USD), growth rates, and key drivers for each segment.
By Display Type:
- LCD: Market size, growth drivers (e.g., cost-effectiveness), challenges (e.g., limitations in resolution and power efficiency).
- OLED: Market size, growth drivers (e.g., superior image quality, thin design), challenges (e.g., higher production costs).
- Other Display Types: Market size, emerging technologies, growth potential.
By End-User Industry:
- Gaming & Entertainment: Market size, growth drivers (e.g., increasing demand for immersive gaming experiences), key trends.
- Healthcare: Market size, growth drivers (e.g., use in surgical simulations, medical training), key trends.
- Education: Market size, growth drivers (e.g., interactive learning experiences), key trends.
- Military & Defense: Market size, growth drivers (e.g., use in heads-up displays, simulation training), key trends.
- Automotive & Manufacturing: Market size, growth drivers (e.g., use in advanced driver-assistance systems (ADAS), industrial applications), key trends.
- Retail: Market size, growth drivers (e.g., interactive displays, virtual try-on), key trends.
- Other Applications: Market size, emerging applications, growth potential.
Extended Reality Display Industry Product Innovations
The XR display industry is characterized by continuous innovation, resulting in significant advancements in display technologies and product applications. Recent innovations include the development of ultra-bright, full-color AMLCDs with enhanced resolution and refresh rates, contributing to superior visual experiences. MicroOLED displays offer high pixel density and improved power efficiency, broadening application possibilities. Furthermore, the introduction of transparent displays with enhanced brightness opens avenues for innovative user interfaces and enhanced realism in XR applications. These innovations offer unique selling propositions (USPs) like improved image clarity, reduced power consumption, and enhanced user experiences, ultimately driving growth in the XR display market. These developments are reflected in improved performance metrics across various applications.
Propelling Factors for Extended Reality Display Industry Growth
Several factors contribute to the robust growth of the XR display market. Technological advancements, such as the development of higher-resolution displays, improved power efficiency, and innovative form factors, are key drivers. Economic factors, including rising disposable incomes and increased investment in XR technologies across various sectors, further stimulate market expansion. Favorable regulatory environments, supporting the adoption of XR technologies in different applications, also play a crucial role. For instance, government initiatives promoting the development and adoption of AR/VR technologies in education and healthcare are significantly boosting market growth.
Obstacles in the Extended Reality Display Industry Market
Despite its growth potential, the XR display market faces certain obstacles. Regulatory challenges, varying across different regions, can impede market expansion. Supply chain disruptions, particularly impacting the availability of critical components, can affect production and market stability. Furthermore, intense competitive pressures from numerous established and emerging players intensify the battle for market share. These factors, if not effectively addressed, could potentially restrict the overall market growth rate by approximately xx%.
Future Opportunities in Extended Reality Display Industry
The XR display industry holds substantial future potential. Emerging markets in developing economies present significant growth opportunities. Advancements in MicroLED and other display technologies promise superior visual quality and enhanced functionalities. Growing consumer demand for immersive experiences across diverse sectors, including gaming, entertainment, healthcare, and education, will further propel market growth. Exploration of new applications, such as interactive retail displays and advanced driver-assistance systems, will expand the market scope significantly.
Major Players in the Extended Reality Display Industry Ecosystem
- LG Display Co Ltd
- Realfiction Holding AB
- eMagin Corporation
- Samsung Electronics Co Ltd
- SA Photonics Inc
- Japan Display Inc
- Seiko Epson Corporation
- Plessey Company plc
- Lumus Ltd
- Kopin Corporation
- BOE Technology Group Co Ltd
- Sony Corporation
Key Developments in Extended Reality Display Industry Industry
- June 2022: JDI developed its revolutionary transparent Raelclear display technology and planned to mass manufacture a new 20.8-inch Raelclear display with 2X brightness in the fall of 2023. This significantly enhances display capabilities, potentially boosting market adoption.
- July 2022: Samsung Display announced the development of a MicroOLED panel for clients including Samsung Electronics, Apple, and Meta. This indicates strong industry interest and potential for increased MicroOLED market penetration.
- July 2022: Kopin received USD 3.8 Million in production orders for its ultra-bright, full-color Brillian AMLCD, showcasing the demand for advanced display solutions in specific applications like military aviation.
Strategic Extended Reality Display Industry Market Forecast
The XR display market is poised for significant growth, driven by technological advancements, increased investment, and expanding applications across various sectors. The forecast period (2025-2033) anticipates a robust expansion, particularly in segments like OLED and MicroLED displays, fueled by consumer demand for superior visual experiences and immersive technologies. Emerging applications in areas such as healthcare, automotive, and education are expected to contribute significantly to market growth. The overall market potential is substantial, promising a period of sustained expansion and innovation within the XR display industry. This sustained growth is projected to reach xx Million by 2033.
Extended Reality Display Industry Segmentation
-
1. Display Type
- 1.1. Liquid Crystal Displays (LCD)
- 1.2. Organic Light-Emitting Diode (OLED)
- 1.3. Other Display Type
-
2. End-User Industry
- 2.1. Gaming and Entertainment
- 2.2. Healthcare
- 2.3. Education
- 2.4. Military and Defense
- 2.5. Automotive and Manufacturing
- 2.6. Retail
- 2.7. Other Applications
Extended Reality Display Industry Segmentation By Geography
- 1. North America
- 2. Europe
- 3. Asia Pacific
- 4. Rest of the World
Extended Reality Display Industry REPORT HIGHLIGHTS
| Aspects | Details |
|---|---|
| Study Period | 2019-2033 |
| Base Year | 2024 |
| Estimated Year | 2025 |
| Forecast Period | 2025-2033 |
| Historical Period | 2019-2024 |
| Growth Rate | CAGR of 46.06% from 2019-2033 |
| Segmentation |
|
Table of Contents
- 1. Introduction
- 1.1. Research Scope
- 1.2. Market Segmentation
- 1.3. Research Methodology
- 1.4. Definitions and Assumptions
- 2. Executive Summary
- 2.1. Introduction
- 3. Market Dynamics
- 3.1. Introduction
- 3.2. Market Drivers
- 3.2.1. Rising Adoption of AR and VR Applications Across Multiple End-user Industries; Significant Technological Advancement Across Micros Displays Such as MicroLEDs
- 3.3. Market Restrains
- 3.3.1. Complex Manufacturing Process Involved for the Production of Displays; Limited Content Available for the Extended Reality Wearables
- 3.4. Market Trends
- 3.4.1. Rising Adoption of AR and VR Applications Across Multiple End-User Industries
- 4. Market Factor Analysis
- 4.1. Porters Five Forces
- 4.2. Supply/Value Chain
- 4.3. PESTEL analysis
- 4.4. Market Entropy
- 4.5. Patent/Trademark Analysis
- 5. Global Extended Reality Display Industry Analysis, Insights and Forecast, 2019-2031
- 5.1. Market Analysis, Insights and Forecast - by Display Type
- 5.1.1. Liquid Crystal Displays (LCD)
- 5.1.2. Organic Light-Emitting Diode (OLED)
- 5.1.3. Other Display Type
- 5.2. Market Analysis, Insights and Forecast - by End-User Industry
- 5.2.1. Gaming and Entertainment
- 5.2.2. Healthcare
- 5.2.3. Education
- 5.2.4. Military and Defense
- 5.2.5. Automotive and Manufacturing
- 5.2.6. Retail
- 5.2.7. Other Applications
- 5.3. Market Analysis, Insights and Forecast - by Region
- 5.3.1. North America
- 5.3.2. Europe
- 5.3.3. Asia Pacific
- 5.3.4. Rest of the World
- 5.1. Market Analysis, Insights and Forecast - by Display Type
- 6. North America Extended Reality Display Industry Analysis, Insights and Forecast, 2019-2031
- 6.1. Market Analysis, Insights and Forecast - by Display Type
- 6.1.1. Liquid Crystal Displays (LCD)
- 6.1.2. Organic Light-Emitting Diode (OLED)
- 6.1.3. Other Display Type
- 6.2. Market Analysis, Insights and Forecast - by End-User Industry
- 6.2.1. Gaming and Entertainment
- 6.2.2. Healthcare
- 6.2.3. Education
- 6.2.4. Military and Defense
- 6.2.5. Automotive and Manufacturing
- 6.2.6. Retail
- 6.2.7. Other Applications
- 6.1. Market Analysis, Insights and Forecast - by Display Type
- 7. Europe Extended Reality Display Industry Analysis, Insights and Forecast, 2019-2031
- 7.1. Market Analysis, Insights and Forecast - by Display Type
- 7.1.1. Liquid Crystal Displays (LCD)
- 7.1.2. Organic Light-Emitting Diode (OLED)
- 7.1.3. Other Display Type
- 7.2. Market Analysis, Insights and Forecast - by End-User Industry
- 7.2.1. Gaming and Entertainment
- 7.2.2. Healthcare
- 7.2.3. Education
- 7.2.4. Military and Defense
- 7.2.5. Automotive and Manufacturing
- 7.2.6. Retail
- 7.2.7. Other Applications
- 7.1. Market Analysis, Insights and Forecast - by Display Type
- 8. Asia Pacific Extended Reality Display Industry Analysis, Insights and Forecast, 2019-2031
- 8.1. Market Analysis, Insights and Forecast - by Display Type
- 8.1.1. Liquid Crystal Displays (LCD)
- 8.1.2. Organic Light-Emitting Diode (OLED)
- 8.1.3. Other Display Type
- 8.2. Market Analysis, Insights and Forecast - by End-User Industry
- 8.2.1. Gaming and Entertainment
- 8.2.2. Healthcare
- 8.2.3. Education
- 8.2.4. Military and Defense
- 8.2.5. Automotive and Manufacturing
- 8.2.6. Retail
- 8.2.7. Other Applications
- 8.1. Market Analysis, Insights and Forecast - by Display Type
- 9. Rest of the World Extended Reality Display Industry Analysis, Insights and Forecast, 2019-2031
- 9.1. Market Analysis, Insights and Forecast - by Display Type
- 9.1.1. Liquid Crystal Displays (LCD)
- 9.1.2. Organic Light-Emitting Diode (OLED)
- 9.1.3. Other Display Type
- 9.2. Market Analysis, Insights and Forecast - by End-User Industry
- 9.2.1. Gaming and Entertainment
- 9.2.2. Healthcare
- 9.2.3. Education
- 9.2.4. Military and Defense
- 9.2.5. Automotive and Manufacturing
- 9.2.6. Retail
- 9.2.7. Other Applications
- 9.1. Market Analysis, Insights and Forecast - by Display Type
- 10. North America Extended Reality Display Industry Analysis, Insights and Forecast, 2019-2031
- 10.1. Market Analysis, Insights and Forecast - By Country/Sub-region
- 10.1.1.
- 11. Europe Extended Reality Display Industry Analysis, Insights and Forecast, 2019-2031
- 11.1. Market Analysis, Insights and Forecast - By Country/Sub-region
- 11.1.1.
- 12. Asia Pacific Extended Reality Display Industry Analysis, Insights and Forecast, 2019-2031
- 12.1. Market Analysis, Insights and Forecast - By Country/Sub-region
- 12.1.1.
- 13. Rest of the World Extended Reality Display Industry Analysis, Insights and Forecast, 2019-2031
- 13.1. Market Analysis, Insights and Forecast - By Country/Sub-region
- 13.1.1.
- 14. Competitive Analysis
- 14.1. Global Market Share Analysis 2024
- 14.2. Company Profiles
- 14.2.1 LG Display Co Ltd
- 14.2.1.1. Overview
- 14.2.1.2. Products
- 14.2.1.3. SWOT Analysis
- 14.2.1.4. Recent Developments
- 14.2.1.5. Financials (Based on Availability)
- 14.2.2 Realfiction Holding AB
- 14.2.2.1. Overview
- 14.2.2.2. Products
- 14.2.2.3. SWOT Analysis
- 14.2.2.4. Recent Developments
- 14.2.2.5. Financials (Based on Availability)
- 14.2.3 eMagin Corporation
- 14.2.3.1. Overview
- 14.2.3.2. Products
- 14.2.3.3. SWOT Analysis
- 14.2.3.4. Recent Developments
- 14.2.3.5. Financials (Based on Availability)
- 14.2.4 Samsung Electronics Co Ltd
- 14.2.4.1. Overview
- 14.2.4.2. Products
- 14.2.4.3. SWOT Analysis
- 14.2.4.4. Recent Developments
- 14.2.4.5. Financials (Based on Availability)
- 14.2.5 SA Photonics Inc *List Not Exhaustive
- 14.2.5.1. Overview
- 14.2.5.2. Products
- 14.2.5.3. SWOT Analysis
- 14.2.5.4. Recent Developments
- 14.2.5.5. Financials (Based on Availability)
- 14.2.6 Japan Display Inc
- 14.2.6.1. Overview
- 14.2.6.2. Products
- 14.2.6.3. SWOT Analysis
- 14.2.6.4. Recent Developments
- 14.2.6.5. Financials (Based on Availability)
- 14.2.7 Seiko Epson Corporation
- 14.2.7.1. Overview
- 14.2.7.2. Products
- 14.2.7.3. SWOT Analysis
- 14.2.7.4. Recent Developments
- 14.2.7.5. Financials (Based on Availability)
- 14.2.8 Plessey Company plc
- 14.2.8.1. Overview
- 14.2.8.2. Products
- 14.2.8.3. SWOT Analysis
- 14.2.8.4. Recent Developments
- 14.2.8.5. Financials (Based on Availability)
- 14.2.9 Lumus Ltd
- 14.2.9.1. Overview
- 14.2.9.2. Products
- 14.2.9.3. SWOT Analysis
- 14.2.9.4. Recent Developments
- 14.2.9.5. Financials (Based on Availability)
- 14.2.10 Kopin Corporation
- 14.2.10.1. Overview
- 14.2.10.2. Products
- 14.2.10.3. SWOT Analysis
- 14.2.10.4. Recent Developments
- 14.2.10.5. Financials (Based on Availability)
- 14.2.11 BOE Technology Group Co Ltd
- 14.2.11.1. Overview
- 14.2.11.2. Products
- 14.2.11.3. SWOT Analysis
- 14.2.11.4. Recent Developments
- 14.2.11.5. Financials (Based on Availability)
- 14.2.12 Sony Corporation
- 14.2.12.1. Overview
- 14.2.12.2. Products
- 14.2.12.3. SWOT Analysis
- 14.2.12.4. Recent Developments
- 14.2.12.5. Financials (Based on Availability)
- 14.2.1 LG Display Co Ltd
List of Figures
- Figure 1: Global Extended Reality Display Industry Revenue Breakdown (Million, %) by Region 2024 & 2032
- Figure 2: North America Extended Reality Display Industry Revenue (Million), by Country 2024 & 2032
- Figure 3: North America Extended Reality Display Industry Revenue Share (%), by Country 2024 & 2032
- Figure 4: Europe Extended Reality Display Industry Revenue (Million), by Country 2024 & 2032
- Figure 5: Europe Extended Reality Display Industry Revenue Share (%), by Country 2024 & 2032
- Figure 6: Asia Pacific Extended Reality Display Industry Revenue (Million), by Country 2024 & 2032
- Figure 7: Asia Pacific Extended Reality Display Industry Revenue Share (%), by Country 2024 & 2032
- Figure 8: Rest of the World Extended Reality Display Industry Revenue (Million), by Country 2024 & 2032
- Figure 9: Rest of the World Extended Reality Display Industry Revenue Share (%), by Country 2024 & 2032
- Figure 10: North America Extended Reality Display Industry Revenue (Million), by Display Type 2024 & 2032
- Figure 11: North America Extended Reality Display Industry Revenue Share (%), by Display Type 2024 & 2032
- Figure 12: North America Extended Reality Display Industry Revenue (Million), by End-User Industry 2024 & 2032
- Figure 13: North America Extended Reality Display Industry Revenue Share (%), by End-User Industry 2024 & 2032
- Figure 14: North America Extended Reality Display Industry Revenue (Million), by Country 2024 & 2032
- Figure 15: North America Extended Reality Display Industry Revenue Share (%), by Country 2024 & 2032
- Figure 16: Europe Extended Reality Display Industry Revenue (Million), by Display Type 2024 & 2032
- Figure 17: Europe Extended Reality Display Industry Revenue Share (%), by Display Type 2024 & 2032
- Figure 18: Europe Extended Reality Display Industry Revenue (Million), by End-User Industry 2024 & 2032
- Figure 19: Europe Extended Reality Display Industry Revenue Share (%), by End-User Industry 2024 & 2032
- Figure 20: Europe Extended Reality Display Industry Revenue (Million), by Country 2024 & 2032
- Figure 21: Europe Extended Reality Display Industry Revenue Share (%), by Country 2024 & 2032
- Figure 22: Asia Pacific Extended Reality Display Industry Revenue (Million), by Display Type 2024 & 2032
- Figure 23: Asia Pacific Extended Reality Display Industry Revenue Share (%), by Display Type 2024 & 2032
- Figure 24: Asia Pacific Extended Reality Display Industry Revenue (Million), by End-User Industry 2024 & 2032
- Figure 25: Asia Pacific Extended Reality Display Industry Revenue Share (%), by End-User Industry 2024 & 2032
- Figure 26: Asia Pacific Extended Reality Display Industry Revenue (Million), by Country 2024 & 2032
- Figure 27: Asia Pacific Extended Reality Display Industry Revenue Share (%), by Country 2024 & 2032
- Figure 28: Rest of the World Extended Reality Display Industry Revenue (Million), by Display Type 2024 & 2032
- Figure 29: Rest of the World Extended Reality Display Industry Revenue Share (%), by Display Type 2024 & 2032
- Figure 30: Rest of the World Extended Reality Display Industry Revenue (Million), by End-User Industry 2024 & 2032
- Figure 31: Rest of the World Extended Reality Display Industry Revenue Share (%), by End-User Industry 2024 & 2032
- Figure 32: Rest of the World Extended Reality Display Industry Revenue (Million), by Country 2024 & 2032
- Figure 33: Rest of the World Extended Reality Display Industry Revenue Share (%), by Country 2024 & 2032
List of Tables
- Table 1: Global Extended Reality Display Industry Revenue Million Forecast, by Region 2019 & 2032
- Table 2: Global Extended Reality Display Industry Revenue Million Forecast, by Display Type 2019 & 2032
- Table 3: Global Extended Reality Display Industry Revenue Million Forecast, by End-User Industry 2019 & 2032
- Table 4: Global Extended Reality Display Industry Revenue Million Forecast, by Region 2019 & 2032
- Table 5: Global Extended Reality Display Industry Revenue Million Forecast, by Country 2019 & 2032
- Table 6: Extended Reality Display Industry Revenue (Million) Forecast, by Application 2019 & 2032
- Table 7: Global Extended Reality Display Industry Revenue Million Forecast, by Country 2019 & 2032
- Table 8: Extended Reality Display Industry Revenue (Million) Forecast, by Application 2019 & 2032
- Table 9: Global Extended Reality Display Industry Revenue Million Forecast, by Country 2019 & 2032
- Table 10: Extended Reality Display Industry Revenue (Million) Forecast, by Application 2019 & 2032
- Table 11: Global Extended Reality Display Industry Revenue Million Forecast, by Country 2019 & 2032
- Table 12: Extended Reality Display Industry Revenue (Million) Forecast, by Application 2019 & 2032
- Table 13: Global Extended Reality Display Industry Revenue Million Forecast, by Display Type 2019 & 2032
- Table 14: Global Extended Reality Display Industry Revenue Million Forecast, by End-User Industry 2019 & 2032
- Table 15: Global Extended Reality Display Industry Revenue Million Forecast, by Country 2019 & 2032
- Table 16: Global Extended Reality Display Industry Revenue Million Forecast, by Display Type 2019 & 2032
- Table 17: Global Extended Reality Display Industry Revenue Million Forecast, by End-User Industry 2019 & 2032
- Table 18: Global Extended Reality Display Industry Revenue Million Forecast, by Country 2019 & 2032
- Table 19: Global Extended Reality Display Industry Revenue Million Forecast, by Display Type 2019 & 2032
- Table 20: Global Extended Reality Display Industry Revenue Million Forecast, by End-User Industry 2019 & 2032
- Table 21: Global Extended Reality Display Industry Revenue Million Forecast, by Country 2019 & 2032
- Table 22: Global Extended Reality Display Industry Revenue Million Forecast, by Display Type 2019 & 2032
- Table 23: Global Extended Reality Display Industry Revenue Million Forecast, by End-User Industry 2019 & 2032
- Table 24: Global Extended Reality Display Industry Revenue Million Forecast, by Country 2019 & 2032
Frequently Asked Questions
1. What is the projected Compound Annual Growth Rate (CAGR) of the Extended Reality Display Industry?
The projected CAGR is approximately 46.06%.
2. Which companies are prominent players in the Extended Reality Display Industry?
Key companies in the market include LG Display Co Ltd, Realfiction Holding AB, eMagin Corporation, Samsung Electronics Co Ltd, SA Photonics Inc *List Not Exhaustive, Japan Display Inc, Seiko Epson Corporation, Plessey Company plc, Lumus Ltd, Kopin Corporation, BOE Technology Group Co Ltd, Sony Corporation.
3. What are the main segments of the Extended Reality Display Industry?
The market segments include Display Type, End-User Industry.
4. Can you provide details about the market size?
The market size is estimated to be USD 1.93 Million as of 2022.
5. What are some drivers contributing to market growth?
Rising Adoption of AR and VR Applications Across Multiple End-user Industries; Significant Technological Advancement Across Micros Displays Such as MicroLEDs.
6. What are the notable trends driving market growth?
Rising Adoption of AR and VR Applications Across Multiple End-User Industries.
7. Are there any restraints impacting market growth?
Complex Manufacturing Process Involved for the Production of Displays; Limited Content Available for the Extended Reality Wearables.
8. Can you provide examples of recent developments in the market?
July 2022 - Kopin received production orders totaling approximately USD 3.8 million for its new ultra-bright, full-color Brillian Active Matrix Liquid Crystal Display (AMLCD) used by helicopter pilots to display real-time flight and target information. The current orders have scheduled deliveries through the fourth quarter of 2023.
9. What pricing options are available for accessing the report?
Pricing options include single-user, multi-user, and enterprise licenses priced at USD 4750, USD 5250, and USD 8750 respectively.
10. Is the market size provided in terms of value or volume?
The market size is provided in terms of value, measured in Million.
11. Are there any specific market keywords associated with the report?
Yes, the market keyword associated with the report is "Extended Reality Display Industry," which aids in identifying and referencing the specific market segment covered.
12. How do I determine which pricing option suits my needs best?
The pricing options vary based on user requirements and access needs. Individual users may opt for single-user licenses, while businesses requiring broader access may choose multi-user or enterprise licenses for cost-effective access to the report.
13. Are there any additional resources or data provided in the Extended Reality Display Industry report?
While the report offers comprehensive insights, it's advisable to review the specific contents or supplementary materials provided to ascertain if additional resources or data are available.
14. How can I stay updated on further developments or reports in the Extended Reality Display Industry?
To stay informed about further developments, trends, and reports in the Extended Reality Display Industry, consider subscribing to industry newsletters, following relevant companies and organizations, or regularly checking reputable industry news sources and publications.
Methodology
Step 1 - Identification of Relevant Samples Size from Population Database


Step 2 - Approaches for Defining Global Market Size (Value, Volume* & Price*)

Note*: In applicable scenarios
Step 3 - Data Sources
Primary Research
- Web Analytics
- Survey Reports
- Research Institute
- Latest Research Reports
- Opinion Leaders
Secondary Research
- Annual Reports
- White Paper
- Latest Press Release
- Industry Association
- Paid Database
- Investor Presentations

Step 4 - Data Triangulation
Involves using different sources of information in order to increase the validity of a study
These sources are likely to be stakeholders in a program - participants, other researchers, program staff, other community members, and so on.
Then we put all data in single framework & apply various statistical tools to find out the dynamic on the market.
During the analysis stage, feedback from the stakeholder groups would be compared to determine areas of agreement as well as areas of divergence
