

Key Insights
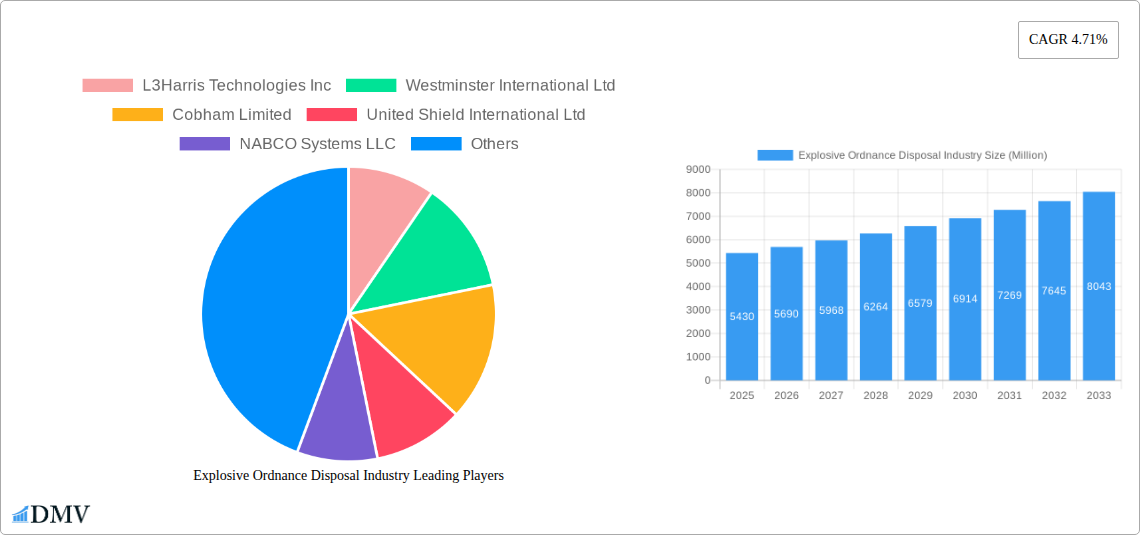
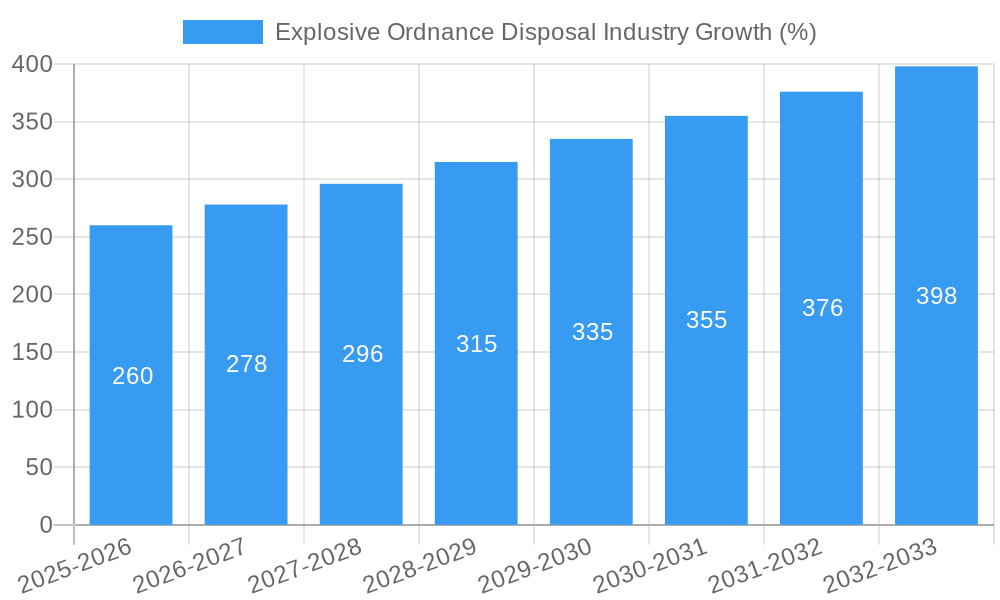
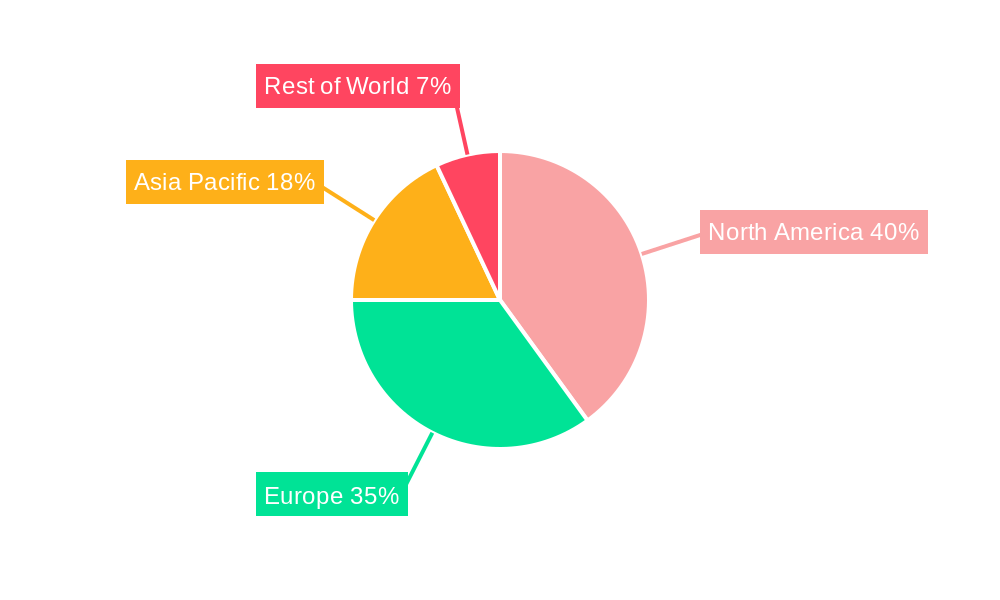
The Explosive Ordnance Disposal (EOD) industry, valued at $5.43 billion in 2025, is projected to experience robust growth, driven by escalating global conflicts, rising terrorism threats, and increasing demand for enhanced security measures. The Compound Annual Growth Rate (CAGR) of 4.71% from 2025 to 2033 signifies a substantial market expansion. Key growth drivers include technological advancements in EOD robots, explosive detectors, and protective suits, leading to improved efficiency and reduced risk to personnel. Furthermore, increasing government investments in defense and homeland security budgets across various regions are fueling the market's expansion. The market is segmented by end-user (military and law enforcement) and by type (EOD suits and blankets, EOD robots, explosive detectors, and other types), with EOD robots and advanced detection technologies witnessing particularly high demand. Geographic analysis reveals significant market presence in North America and Europe, driven by strong defense capabilities and advanced technological infrastructure in these regions; however, the Asia-Pacific region is poised for substantial growth due to increasing defense expenditure and modernization initiatives. While geopolitical instability and economic downturns pose potential restraints, the overall market outlook remains positive, with continued growth anticipated throughout the forecast period.
The competitive landscape comprises both established players and emerging companies. Major players like L3Harris Technologies Inc., Northrop Grumman Corporation, and Teledyne FLIR LLC are leveraging their technological expertise and extensive product portfolios to maintain their market leadership. Smaller companies are focusing on innovation and niche product development to carve out market share. The industry is characterized by continuous innovation, with ongoing research and development efforts aimed at enhancing the effectiveness and safety of EOD equipment. This focus on innovation, combined with the persistent need for effective EOD solutions, ensures that the market will continue its trajectory of expansion. The future success of companies in this sector hinges on their ability to adapt to evolving technological advancements, meet the stringent regulatory requirements, and effectively address the diverse needs of military and law enforcement agencies worldwide.
Explosive Ordnance Disposal (EOD) Industry Market Report: 2019-2033
This comprehensive report provides a detailed analysis of the Explosive Ordnance Disposal (EOD) industry, offering invaluable insights for stakeholders seeking to navigate this dynamic sector. The report covers the period from 2019 to 2033, with a base year of 2025 and a forecast period extending to 2033. The global EOD market, valued at $XX Million in 2025, is projected to reach $XX Million by 2033, exhibiting a robust Compound Annual Growth Rate (CAGR) of XX%. Key players such as L3Harris Technologies Inc, Northrop Grumman Corporation, and Teledyne FLIR LLC are shaping industry evolution, alongside numerous other significant contributors.
Explosive Ordnance Disposal Industry Market Composition & Trends
The EOD market is characterized by a moderately concentrated competitive landscape, with a few major players holding significant market share. L3Harris Technologies Inc and Northrop Grumman Corporation, for instance, likely command a combined share of XX%, while other companies like Cobham Limited and Teledyne FLIR LLC contribute to the remaining market share. Market concentration is influenced by factors like technological expertise, extensive R&D investments, and strong government contracts. Innovation is a key driver, with continuous advancements in EOD robots, explosive detectors, and protective suits shaping the market. Stringent regulatory frameworks governing the production, sale, and use of EOD equipment further influence market dynamics. The presence of substitute technologies, albeit limited, also plays a role. M&A activity has been relatively modest in recent years, with deal values totaling approximately $XX Million between 2019 and 2024, indicating strategic consolidation and expansion efforts within the industry.
- Market Share Distribution (2025): L3Harris Technologies Inc (XX%), Northrop Grumman Corporation (XX%), Others (XX%)
- M&A Deal Value (2019-2024): Approximately $XX Million
- Key Innovation Catalysts: AI-powered Explosive Detection, Advanced Robotics, Enhanced Protective Gear
- Regulatory Landscape: Stringent export controls and safety standards
Explosive Ordnance Disposal Industry Industry Evolution
The EOD industry has experienced consistent growth over the historical period (2019-2024), driven primarily by increased global conflicts, rising terrorist activities, and the need for enhanced security measures. This period saw a CAGR of approximately XX%. Technological advancements, particularly in robotics and AI-driven detection systems, have significantly improved the efficiency and safety of EOD operations. The market has witnessed a growing demand for sophisticated EOD robots capable of handling complex scenarios, as well as lighter, more comfortable EOD suits and blankets. Consumer demands are shifting towards greater precision, reduced collateral damage, and improved operator safety. Future growth will be propelled by the adoption of cutting-edge technologies, such as autonomous EOD robots and advanced spectral analysis for explosive detection, resulting in a projected CAGR of XX% from 2025 to 2033.
The increasing integration of AI and machine learning is further augmenting the capabilities of EOD systems, boosting their effectiveness and reducing the risks involved in operations. The development of smaller, more portable explosive detectors is also meeting the growing demands for rapid and effective screening of potential threats. Furthermore, advancements in materials science have led to the development of lighter and more durable EOD suits, enhancing operator protection.
Leading Regions, Countries, or Segments in Explosive Ordnance Disposal Industry
The North American region, particularly the United States, holds the largest share of the EOD market, driven by substantial military spending, a strong focus on homeland security, and a robust technological ecosystem. The military segment accounts for the largest portion of the market, due to significant government funding and the constant need for advanced EOD capabilities.
- Key Drivers in North America: High military expenditure, robust domestic security initiatives, advanced technological capabilities.
- Key Drivers in the Military Segment: High demand for sophisticated EOD robots and detectors, government contracts, modernization of military arsenals.
- Key Drivers in the EOD Robots segment: Growing demand for autonomous systems and improved operational capabilities.
Europe also holds a substantial market share due to ongoing conflicts and heightened security concerns in some areas. However, the dominance of North America is expected to continue through the forecast period, supported by consistent investment in EOD technologies and proactive security measures. The EOD suits and blankets segment witnesses relatively stable growth, while the explosive detectors segment benefits significantly from technological advancements and increased demand for more sensitive and portable devices.
Explosive Ordnance Disposal Industry Product Innovations
Recent years have seen significant innovations in EOD technology, including the development of highly maneuverable and remotely operated robots capable of neutralizing a wide range of explosive devices. Advanced explosive detectors utilize spectral analysis and AI algorithms to achieve superior sensitivity and accuracy, while EOD suits and blankets offer enhanced protection through lighter and more comfortable materials. These innovations contribute to improved operator safety, reduced collateral damage, and increased operational efficiency, thereby significantly impacting the market's growth trajectory.
Propelling Factors for Explosive Ordnance Disposal Industry Growth
Several key factors fuel the EOD industry's growth. Firstly, rising geopolitical instability and terrorist activities are driving demand for enhanced security measures and advanced EOD capabilities. Secondly, technological advancements, such as AI-powered explosive detection systems and sophisticated robotics, are improving the effectiveness and safety of EOD operations. Thirdly, increased government spending on defense and security budgets, especially in key regions, significantly contributes to market expansion. Finally, evolving regulatory frameworks that emphasize safety and operational efficiency further propel market growth.
Obstacles in the Explosive Ordnance Disposal Industry Market
The EOD market faces challenges such as stringent regulatory requirements for the development and deployment of new technologies. Supply chain disruptions, particularly concerning specialized components and materials, can impact production capacity and lead times. Furthermore, intense competition among established players and emerging entrants necessitates constant innovation and cost-optimization strategies for market success.
Future Opportunities in Explosive Ordnance Disposal Industry
Significant future opportunities exist in the EOD market. The increasing adoption of autonomous EOD robots offers scope for enhanced operational efficiency and reduced risk to human personnel. The development of more sophisticated explosive detection technologies that can identify a wider range of explosive materials, including improvised explosive devices (IEDs), is another key growth area. Furthermore, expansion into new markets, especially in developing countries with increased security concerns, offers substantial potential for industry players.
Major Players in the Explosive Ordnance Disposal Industry Ecosystem
- L3Harris Technologies Inc
- Westminster International Ltd
- Cobham Limited
- United Shield International Ltd
- NABCO Systems LLC
- Garrett Metal Detectors
- Reamda Ltd
- ABP
- Med-Eng Holdings ULC (Cadre Holdings Inc)
- Northrop Grumman Corporation
- Scanna MSC
- Teledyne FLIR LLC
Key Developments in Explosive Ordnance Disposal Industry Industry
- 2022 Q3: L3Harris Technologies Inc launches a new generation of EOD robots with enhanced AI capabilities.
- 2023 Q1: Northrop Grumman Corporation acquires a smaller EOD technology company, expanding its product portfolio.
- 2024 Q2: New regulations regarding the use of EOD robots in urban environments are implemented in several countries.
- 2025 Q1: Teledyne FLIR LLC introduces a new spectral analysis system for improved explosive detection.
Strategic Explosive Ordnance Disposal Industry Market Forecast
The EOD market is poised for significant growth in the coming years, driven by the sustained demand for improved security and defense technologies. Technological advancements, particularly in robotics, AI, and spectral analysis, will continue to drive innovation and market expansion. Governments worldwide are increasingly investing in advanced EOD capabilities, leading to a strong demand for high-quality, reliable equipment. The market will also see increasing integration of AI and machine learning, leading to more autonomous and effective EOD systems. Overall, the EOD market is well-positioned for sustained growth and substantial market potential.
Explosive Ordnance Disposal Industry Segmentation
-
1. Type
- 1.1. EOD Suits and Blankets
- 1.2. EOD Robots
- 1.3. Explosive Detectors
- 1.4. Other Types
-
2. End User
- 2.1. Military
- 2.2. Law Enforcement
Explosive Ordnance Disposal Industry Segmentation By Geography
-
1. North America
- 1.1. United States
- 1.2. Canada
-
2. Europe
- 2.1. Germany
- 2.2. United Kingdom
- 2.3. France
- 2.4. Russia
- 2.5. Rest of Europe
-
3. Asia Pacific
- 3.1. India
- 3.2. China
- 3.3. Japan
- 3.4. South Korea
- 3.5. Rest of Asia Pacific
- 4. Rest of the World
Explosive Ordnance Disposal Industry REPORT HIGHLIGHTS
| Aspects | Details |
|---|---|
| Study Period | 2019-2033 |
| Base Year | 2024 |
| Estimated Year | 2025 |
| Forecast Period | 2025-2033 |
| Historical Period | 2019-2024 |
| Growth Rate | CAGR of 4.71% from 2019-2033 |
| Segmentation |
|
Table of Contents
- 1. Introduction
- 1.1. Research Scope
- 1.2. Market Segmentation
- 1.3. Research Methodology
- 1.4. Definitions and Assumptions
- 2. Executive Summary
- 2.1. Introduction
- 3. Market Dynamics
- 3.1. Introduction
- 3.2. Market Drivers
- 3.2.1. Increase in Internet of Things (IoT) and Autonomous Systems; Rise in Demand for Military and Defense Satellite Communication Solutions
- 3.3. Market Restrains
- 3.3.1. Cybersecurity Threats to Satellite Communication; Interference in Transmission of Data
- 3.4. Market Trends
- 3.4.1. Military Segment will Showcase Significant Growth Due to Adoption of Unmanned Systems for EOD Operations
- 4. Market Factor Analysis
- 4.1. Porters Five Forces
- 4.2. Supply/Value Chain
- 4.3. PESTEL analysis
- 4.4. Market Entropy
- 4.5. Patent/Trademark Analysis
- 5. Global Explosive Ordnance Disposal Industry Analysis, Insights and Forecast, 2019-2031
- 5.1. Market Analysis, Insights and Forecast - by Type
- 5.1.1. EOD Suits and Blankets
- 5.1.2. EOD Robots
- 5.1.3. Explosive Detectors
- 5.1.4. Other Types
- 5.2. Market Analysis, Insights and Forecast - by End User
- 5.2.1. Military
- 5.2.2. Law Enforcement
- 5.3. Market Analysis, Insights and Forecast - by Region
- 5.3.1. North America
- 5.3.2. Europe
- 5.3.3. Asia Pacific
- 5.3.4. Rest of the World
- 5.1. Market Analysis, Insights and Forecast - by Type
- 6. North America Explosive Ordnance Disposal Industry Analysis, Insights and Forecast, 2019-2031
- 6.1. Market Analysis, Insights and Forecast - by Type
- 6.1.1. EOD Suits and Blankets
- 6.1.2. EOD Robots
- 6.1.3. Explosive Detectors
- 6.1.4. Other Types
- 6.2. Market Analysis, Insights and Forecast - by End User
- 6.2.1. Military
- 6.2.2. Law Enforcement
- 6.1. Market Analysis, Insights and Forecast - by Type
- 7. Europe Explosive Ordnance Disposal Industry Analysis, Insights and Forecast, 2019-2031
- 7.1. Market Analysis, Insights and Forecast - by Type
- 7.1.1. EOD Suits and Blankets
- 7.1.2. EOD Robots
- 7.1.3. Explosive Detectors
- 7.1.4. Other Types
- 7.2. Market Analysis, Insights and Forecast - by End User
- 7.2.1. Military
- 7.2.2. Law Enforcement
- 7.1. Market Analysis, Insights and Forecast - by Type
- 8. Asia Pacific Explosive Ordnance Disposal Industry Analysis, Insights and Forecast, 2019-2031
- 8.1. Market Analysis, Insights and Forecast - by Type
- 8.1.1. EOD Suits and Blankets
- 8.1.2. EOD Robots
- 8.1.3. Explosive Detectors
- 8.1.4. Other Types
- 8.2. Market Analysis, Insights and Forecast - by End User
- 8.2.1. Military
- 8.2.2. Law Enforcement
- 8.1. Market Analysis, Insights and Forecast - by Type
- 9. Rest of the World Explosive Ordnance Disposal Industry Analysis, Insights and Forecast, 2019-2031
- 9.1. Market Analysis, Insights and Forecast - by Type
- 9.1.1. EOD Suits and Blankets
- 9.1.2. EOD Robots
- 9.1.3. Explosive Detectors
- 9.1.4. Other Types
- 9.2. Market Analysis, Insights and Forecast - by End User
- 9.2.1. Military
- 9.2.2. Law Enforcement
- 9.1. Market Analysis, Insights and Forecast - by Type
- 10. North America Explosive Ordnance Disposal Industry Analysis, Insights and Forecast, 2019-2031
- 10.1. Market Analysis, Insights and Forecast - By Country/Sub-region
- 10.1.1 United States
- 10.1.2 Canada
- 11. Europe Explosive Ordnance Disposal Industry Analysis, Insights and Forecast, 2019-2031
- 11.1. Market Analysis, Insights and Forecast - By Country/Sub-region
- 11.1.1 Germany
- 11.1.2 United Kingdom
- 11.1.3 France
- 11.1.4 Russia
- 11.1.5 Rest of Europe
- 12. Asia Pacific Explosive Ordnance Disposal Industry Analysis, Insights and Forecast, 2019-2031
- 12.1. Market Analysis, Insights and Forecast - By Country/Sub-region
- 12.1.1 India
- 12.1.2 China
- 12.1.3 Japan
- 12.1.4 South Korea
- 12.1.5 Rest of Asia Pacific
- 13. Rest of the World Explosive Ordnance Disposal Industry Analysis, Insights and Forecast, 2019-2031
- 13.1. Market Analysis, Insights and Forecast - By Country/Sub-region
- 13.1.1.
- 14. Competitive Analysis
- 14.1. Global Market Share Analysis 2024
- 14.2. Company Profiles
- 14.2.1 L3Harris Technologies Inc
- 14.2.1.1. Overview
- 14.2.1.2. Products
- 14.2.1.3. SWOT Analysis
- 14.2.1.4. Recent Developments
- 14.2.1.5. Financials (Based on Availability)
- 14.2.2 Westminster International Ltd
- 14.2.2.1. Overview
- 14.2.2.2. Products
- 14.2.2.3. SWOT Analysis
- 14.2.2.4. Recent Developments
- 14.2.2.5. Financials (Based on Availability)
- 14.2.3 Cobham Limited
- 14.2.3.1. Overview
- 14.2.3.2. Products
- 14.2.3.3. SWOT Analysis
- 14.2.3.4. Recent Developments
- 14.2.3.5. Financials (Based on Availability)
- 14.2.4 United Shield International Ltd
- 14.2.4.1. Overview
- 14.2.4.2. Products
- 14.2.4.3. SWOT Analysis
- 14.2.4.4. Recent Developments
- 14.2.4.5. Financials (Based on Availability)
- 14.2.5 NABCO Systems LLC
- 14.2.5.1. Overview
- 14.2.5.2. Products
- 14.2.5.3. SWOT Analysis
- 14.2.5.4. Recent Developments
- 14.2.5.5. Financials (Based on Availability)
- 14.2.6 Garrett Metal Detectors
- 14.2.6.1. Overview
- 14.2.6.2. Products
- 14.2.6.3. SWOT Analysis
- 14.2.6.4. Recent Developments
- 14.2.6.5. Financials (Based on Availability)
- 14.2.7 Reamda Ltd
- 14.2.7.1. Overview
- 14.2.7.2. Products
- 14.2.7.3. SWOT Analysis
- 14.2.7.4. Recent Developments
- 14.2.7.5. Financials (Based on Availability)
- 14.2.8 ABP
- 14.2.8.1. Overview
- 14.2.8.2. Products
- 14.2.8.3. SWOT Analysis
- 14.2.8.4. Recent Developments
- 14.2.8.5. Financials (Based on Availability)
- 14.2.9 Med-Eng Holdings ULC (Cadre Holdings Inc )
- 14.2.9.1. Overview
- 14.2.9.2. Products
- 14.2.9.3. SWOT Analysis
- 14.2.9.4. Recent Developments
- 14.2.9.5. Financials (Based on Availability)
- 14.2.10 Northrop Grumman Corporation
- 14.2.10.1. Overview
- 14.2.10.2. Products
- 14.2.10.3. SWOT Analysis
- 14.2.10.4. Recent Developments
- 14.2.10.5. Financials (Based on Availability)
- 14.2.11 Scanna MSC
- 14.2.11.1. Overview
- 14.2.11.2. Products
- 14.2.11.3. SWOT Analysis
- 14.2.11.4. Recent Developments
- 14.2.11.5. Financials (Based on Availability)
- 14.2.12 Teledyne FLIR LLC
- 14.2.12.1. Overview
- 14.2.12.2. Products
- 14.2.12.3. SWOT Analysis
- 14.2.12.4. Recent Developments
- 14.2.12.5. Financials (Based on Availability)
- 14.2.1 L3Harris Technologies Inc
List of Figures
- Figure 1: Global Explosive Ordnance Disposal Industry Revenue Breakdown (Million, %) by Region 2024 & 2032
- Figure 2: North America Explosive Ordnance Disposal Industry Revenue (Million), by Country 2024 & 2032
- Figure 3: North America Explosive Ordnance Disposal Industry Revenue Share (%), by Country 2024 & 2032
- Figure 4: Europe Explosive Ordnance Disposal Industry Revenue (Million), by Country 2024 & 2032
- Figure 5: Europe Explosive Ordnance Disposal Industry Revenue Share (%), by Country 2024 & 2032
- Figure 6: Asia Pacific Explosive Ordnance Disposal Industry Revenue (Million), by Country 2024 & 2032
- Figure 7: Asia Pacific Explosive Ordnance Disposal Industry Revenue Share (%), by Country 2024 & 2032
- Figure 8: Rest of the World Explosive Ordnance Disposal Industry Revenue (Million), by Country 2024 & 2032
- Figure 9: Rest of the World Explosive Ordnance Disposal Industry Revenue Share (%), by Country 2024 & 2032
- Figure 10: North America Explosive Ordnance Disposal Industry Revenue (Million), by Type 2024 & 2032
- Figure 11: North America Explosive Ordnance Disposal Industry Revenue Share (%), by Type 2024 & 2032
- Figure 12: North America Explosive Ordnance Disposal Industry Revenue (Million), by End User 2024 & 2032
- Figure 13: North America Explosive Ordnance Disposal Industry Revenue Share (%), by End User 2024 & 2032
- Figure 14: North America Explosive Ordnance Disposal Industry Revenue (Million), by Country 2024 & 2032
- Figure 15: North America Explosive Ordnance Disposal Industry Revenue Share (%), by Country 2024 & 2032
- Figure 16: Europe Explosive Ordnance Disposal Industry Revenue (Million), by Type 2024 & 2032
- Figure 17: Europe Explosive Ordnance Disposal Industry Revenue Share (%), by Type 2024 & 2032
- Figure 18: Europe Explosive Ordnance Disposal Industry Revenue (Million), by End User 2024 & 2032
- Figure 19: Europe Explosive Ordnance Disposal Industry Revenue Share (%), by End User 2024 & 2032
- Figure 20: Europe Explosive Ordnance Disposal Industry Revenue (Million), by Country 2024 & 2032
- Figure 21: Europe Explosive Ordnance Disposal Industry Revenue Share (%), by Country 2024 & 2032
- Figure 22: Asia Pacific Explosive Ordnance Disposal Industry Revenue (Million), by Type 2024 & 2032
- Figure 23: Asia Pacific Explosive Ordnance Disposal Industry Revenue Share (%), by Type 2024 & 2032
- Figure 24: Asia Pacific Explosive Ordnance Disposal Industry Revenue (Million), by End User 2024 & 2032
- Figure 25: Asia Pacific Explosive Ordnance Disposal Industry Revenue Share (%), by End User 2024 & 2032
- Figure 26: Asia Pacific Explosive Ordnance Disposal Industry Revenue (Million), by Country 2024 & 2032
- Figure 27: Asia Pacific Explosive Ordnance Disposal Industry Revenue Share (%), by Country 2024 & 2032
- Figure 28: Rest of the World Explosive Ordnance Disposal Industry Revenue (Million), by Type 2024 & 2032
- Figure 29: Rest of the World Explosive Ordnance Disposal Industry Revenue Share (%), by Type 2024 & 2032
- Figure 30: Rest of the World Explosive Ordnance Disposal Industry Revenue (Million), by End User 2024 & 2032
- Figure 31: Rest of the World Explosive Ordnance Disposal Industry Revenue Share (%), by End User 2024 & 2032
- Figure 32: Rest of the World Explosive Ordnance Disposal Industry Revenue (Million), by Country 2024 & 2032
- Figure 33: Rest of the World Explosive Ordnance Disposal Industry Revenue Share (%), by Country 2024 & 2032
List of Tables
- Table 1: Global Explosive Ordnance Disposal Industry Revenue Million Forecast, by Region 2019 & 2032
- Table 2: Global Explosive Ordnance Disposal Industry Revenue Million Forecast, by Type 2019 & 2032
- Table 3: Global Explosive Ordnance Disposal Industry Revenue Million Forecast, by End User 2019 & 2032
- Table 4: Global Explosive Ordnance Disposal Industry Revenue Million Forecast, by Region 2019 & 2032
- Table 5: Global Explosive Ordnance Disposal Industry Revenue Million Forecast, by Country 2019 & 2032
- Table 6: United States Explosive Ordnance Disposal Industry Revenue (Million) Forecast, by Application 2019 & 2032
- Table 7: Canada Explosive Ordnance Disposal Industry Revenue (Million) Forecast, by Application 2019 & 2032
- Table 8: Global Explosive Ordnance Disposal Industry Revenue Million Forecast, by Country 2019 & 2032
- Table 9: Germany Explosive Ordnance Disposal Industry Revenue (Million) Forecast, by Application 2019 & 2032
- Table 10: United Kingdom Explosive Ordnance Disposal Industry Revenue (Million) Forecast, by Application 2019 & 2032
- Table 11: France Explosive Ordnance Disposal Industry Revenue (Million) Forecast, by Application 2019 & 2032
- Table 12: Russia Explosive Ordnance Disposal Industry Revenue (Million) Forecast, by Application 2019 & 2032
- Table 13: Rest of Europe Explosive Ordnance Disposal Industry Revenue (Million) Forecast, by Application 2019 & 2032
- Table 14: Global Explosive Ordnance Disposal Industry Revenue Million Forecast, by Country 2019 & 2032
- Table 15: India Explosive Ordnance Disposal Industry Revenue (Million) Forecast, by Application 2019 & 2032
- Table 16: China Explosive Ordnance Disposal Industry Revenue (Million) Forecast, by Application 2019 & 2032
- Table 17: Japan Explosive Ordnance Disposal Industry Revenue (Million) Forecast, by Application 2019 & 2032
- Table 18: South Korea Explosive Ordnance Disposal Industry Revenue (Million) Forecast, by Application 2019 & 2032
- Table 19: Rest of Asia Pacific Explosive Ordnance Disposal Industry Revenue (Million) Forecast, by Application 2019 & 2032
- Table 20: Global Explosive Ordnance Disposal Industry Revenue Million Forecast, by Country 2019 & 2032
- Table 21: Explosive Ordnance Disposal Industry Revenue (Million) Forecast, by Application 2019 & 2032
- Table 22: Global Explosive Ordnance Disposal Industry Revenue Million Forecast, by Type 2019 & 2032
- Table 23: Global Explosive Ordnance Disposal Industry Revenue Million Forecast, by End User 2019 & 2032
- Table 24: Global Explosive Ordnance Disposal Industry Revenue Million Forecast, by Country 2019 & 2032
- Table 25: United States Explosive Ordnance Disposal Industry Revenue (Million) Forecast, by Application 2019 & 2032
- Table 26: Canada Explosive Ordnance Disposal Industry Revenue (Million) Forecast, by Application 2019 & 2032
- Table 27: Global Explosive Ordnance Disposal Industry Revenue Million Forecast, by Type 2019 & 2032
- Table 28: Global Explosive Ordnance Disposal Industry Revenue Million Forecast, by End User 2019 & 2032
- Table 29: Global Explosive Ordnance Disposal Industry Revenue Million Forecast, by Country 2019 & 2032
- Table 30: Germany Explosive Ordnance Disposal Industry Revenue (Million) Forecast, by Application 2019 & 2032
- Table 31: United Kingdom Explosive Ordnance Disposal Industry Revenue (Million) Forecast, by Application 2019 & 2032
- Table 32: France Explosive Ordnance Disposal Industry Revenue (Million) Forecast, by Application 2019 & 2032
- Table 33: Russia Explosive Ordnance Disposal Industry Revenue (Million) Forecast, by Application 2019 & 2032
- Table 34: Rest of Europe Explosive Ordnance Disposal Industry Revenue (Million) Forecast, by Application 2019 & 2032
- Table 35: Global Explosive Ordnance Disposal Industry Revenue Million Forecast, by Type 2019 & 2032
- Table 36: Global Explosive Ordnance Disposal Industry Revenue Million Forecast, by End User 2019 & 2032
- Table 37: Global Explosive Ordnance Disposal Industry Revenue Million Forecast, by Country 2019 & 2032
- Table 38: India Explosive Ordnance Disposal Industry Revenue (Million) Forecast, by Application 2019 & 2032
- Table 39: China Explosive Ordnance Disposal Industry Revenue (Million) Forecast, by Application 2019 & 2032
- Table 40: Japan Explosive Ordnance Disposal Industry Revenue (Million) Forecast, by Application 2019 & 2032
- Table 41: South Korea Explosive Ordnance Disposal Industry Revenue (Million) Forecast, by Application 2019 & 2032
- Table 42: Rest of Asia Pacific Explosive Ordnance Disposal Industry Revenue (Million) Forecast, by Application 2019 & 2032
- Table 43: Global Explosive Ordnance Disposal Industry Revenue Million Forecast, by Type 2019 & 2032
- Table 44: Global Explosive Ordnance Disposal Industry Revenue Million Forecast, by End User 2019 & 2032
- Table 45: Global Explosive Ordnance Disposal Industry Revenue Million Forecast, by Country 2019 & 2032
Frequently Asked Questions
1. What is the projected Compound Annual Growth Rate (CAGR) of the Explosive Ordnance Disposal Industry?
The projected CAGR is approximately 4.71%.
2. Which companies are prominent players in the Explosive Ordnance Disposal Industry?
Key companies in the market include L3Harris Technologies Inc, Westminster International Ltd, Cobham Limited, United Shield International Ltd, NABCO Systems LLC, Garrett Metal Detectors, Reamda Ltd, ABP, Med-Eng Holdings ULC (Cadre Holdings Inc ), Northrop Grumman Corporation, Scanna MSC, Teledyne FLIR LLC.
3. What are the main segments of the Explosive Ordnance Disposal Industry?
The market segments include Type, End User.
4. Can you provide details about the market size?
The market size is estimated to be USD 5.43 Million as of 2022.
5. What are some drivers contributing to market growth?
Increase in Internet of Things (IoT) and Autonomous Systems; Rise in Demand for Military and Defense Satellite Communication Solutions.
6. What are the notable trends driving market growth?
Military Segment will Showcase Significant Growth Due to Adoption of Unmanned Systems for EOD Operations.
7. Are there any restraints impacting market growth?
Cybersecurity Threats to Satellite Communication; Interference in Transmission of Data.
8. Can you provide examples of recent developments in the market?
N/A
9. What pricing options are available for accessing the report?
Pricing options include single-user, multi-user, and enterprise licenses priced at USD 4750, USD 5250, and USD 8750 respectively.
10. Is the market size provided in terms of value or volume?
The market size is provided in terms of value, measured in Million.
11. Are there any specific market keywords associated with the report?
Yes, the market keyword associated with the report is "Explosive Ordnance Disposal Industry," which aids in identifying and referencing the specific market segment covered.
12. How do I determine which pricing option suits my needs best?
The pricing options vary based on user requirements and access needs. Individual users may opt for single-user licenses, while businesses requiring broader access may choose multi-user or enterprise licenses for cost-effective access to the report.
13. Are there any additional resources or data provided in the Explosive Ordnance Disposal Industry report?
While the report offers comprehensive insights, it's advisable to review the specific contents or supplementary materials provided to ascertain if additional resources or data are available.
14. How can I stay updated on further developments or reports in the Explosive Ordnance Disposal Industry?
To stay informed about further developments, trends, and reports in the Explosive Ordnance Disposal Industry, consider subscribing to industry newsletters, following relevant companies and organizations, or regularly checking reputable industry news sources and publications.
Methodology
Step 1 - Identification of Relevant Samples Size from Population Database


Step 2 - Approaches for Defining Global Market Size (Value, Volume* & Price*)

Note*: In applicable scenarios
Step 3 - Data Sources
Primary Research
- Web Analytics
- Survey Reports
- Research Institute
- Latest Research Reports
- Opinion Leaders
Secondary Research
- Annual Reports
- White Paper
- Latest Press Release
- Industry Association
- Paid Database
- Investor Presentations

Step 4 - Data Triangulation
Involves using different sources of information in order to increase the validity of a study
These sources are likely to be stakeholders in a program - participants, other researchers, program staff, other community members, and so on.
Then we put all data in single framework & apply various statistical tools to find out the dynamic on the market.
During the analysis stage, feedback from the stakeholder groups would be compared to determine areas of agreement as well as areas of divergence
