

Key Insights
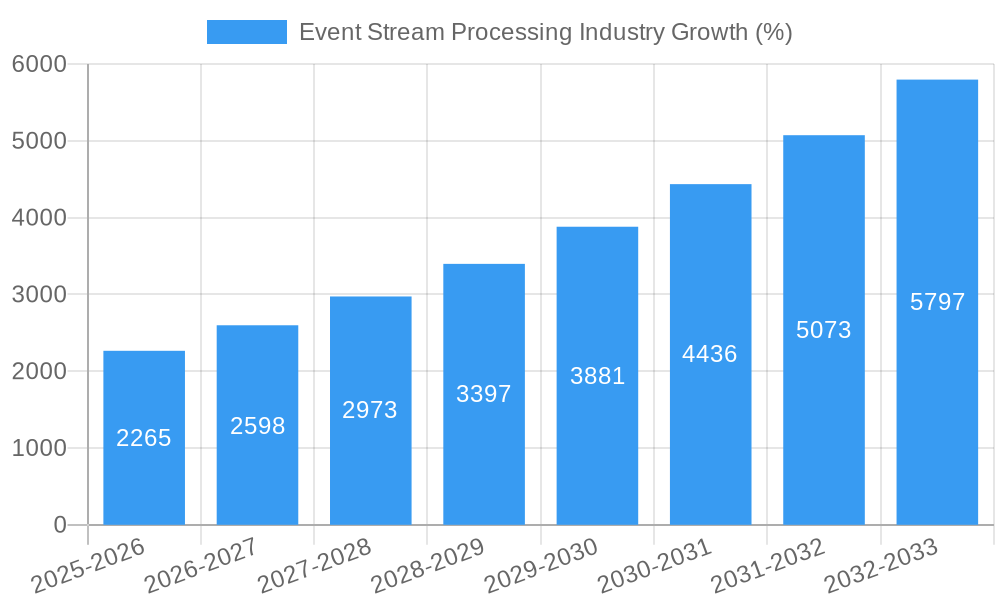
The Event Stream Processing (ESP) market is experiencing robust growth, driven by the increasing need for real-time data analytics across diverse sectors. The market's Compound Annual Growth Rate (CAGR) of 15.70% from 2019 to 2024 indicates a significant expansion, projected to continue in the forecast period (2025-2033). Key drivers include the proliferation of IoT devices generating massive data streams, the rise of cloud computing enabling scalable ESP solutions, and the growing demand for real-time decision-making across industries like BFSI (Banking, Financial Services, and Insurance), retail, and manufacturing. The software and platform segment within ESP solutions dominates the market due to its flexibility and scalability, complemented by the strong demand for services such as implementation, integration, and maintenance. Applications such as fraud detection, algorithmic trading, and predictive maintenance are experiencing particularly high growth, fueled by the need for proactive risk management and operational efficiency. While cloud deployment enjoys the lion's share of market preference due to its cost-effectiveness and accessibility, on-premise deployments remain relevant for organizations with stringent data security and compliance requirements. Geographic distribution sees North America and Europe as leading regions, but the Asia-Pacific region is projected to demonstrate substantial growth due to increasing digitalization and technological advancements.
The competitive landscape is highly dynamic, featuring established players like IBM, Microsoft, and Oracle alongside emerging innovative companies. This competitive environment fosters innovation and drives down costs, benefiting end-users. Restraints to market growth include the complexity of implementing and managing ESP systems, the need for specialized skills, and concerns related to data security and privacy. However, the overall market outlook remains positive, with ongoing technological advancements and increased adoption across various industries ensuring continued expansion of the ESP market. The strategic focus of key vendors on offering comprehensive solutions, including software, platforms, and services, tailored to specific industry needs will play a crucial role in shaping market growth in the coming years. This ensures a robust and expanding market poised for further expansion.
Event Stream Processing Industry Market Report: 2019-2033
This comprehensive report provides a detailed analysis of the Event Stream Processing (ESP) industry, projecting a market value of $XX Million by 2033. The study covers the historical period (2019-2024), the base year (2025), and the forecast period (2025-2033), offering invaluable insights for stakeholders seeking to navigate this rapidly evolving landscape. We delve into market segmentation, competitive dynamics, technological advancements, and future growth opportunities, providing actionable intelligence for informed decision-making.
Event Stream Processing Industry Market Composition & Trends
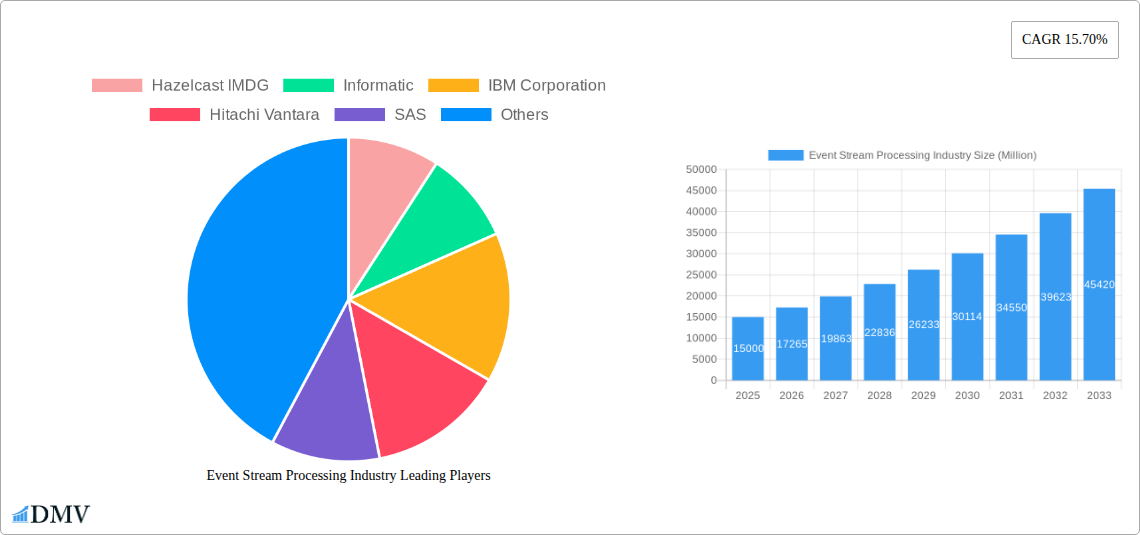
The Event Stream Processing market is experiencing significant growth, driven by the increasing need for real-time data analytics across diverse industries. Market concentration is moderate, with several major players holding substantial market share, while numerous smaller companies contribute to innovation. The global market size reached $XX Million in 2024 and is projected to reach $XX Million by 2025, exhibiting a CAGR of XX%.
- Market Share Distribution: While precise figures are proprietary, leading players like Microsoft, Amazon Web Services, and Google collectively hold a significant portion (estimated at XX%), followed by established players such as IBM, Oracle, and SAP. Smaller companies specializing in niche solutions and open-source technologies contribute the remaining share.
- Innovation Catalysts: The rapid advancements in cloud computing, big data technologies (like Apache Kafka and Apache Pulsar), and machine learning are key innovation drivers. The development of no-code/low-code platforms is further lowering the barrier to entry for ESP adoption.
- Regulatory Landscape: Data privacy regulations (GDPR, CCPA) are influencing ESP market development by shaping data security and compliance requirements. This, in turn, fuels demand for robust and compliant ESP solutions.
- Substitute Products: Traditional batch processing systems represent a partial substitute, however, the demand for real-time insights increasingly outweighs the limitations of batch processing.
- End-User Profiles: The report categorizes end-users across various sectors, including IT & Telecommunications, BFSI, Manufacturing, Retail & E-commerce, Energy & Utilities, and others, each exhibiting unique ESP adoption patterns.
- M&A Activities: The ESP landscape has witnessed several significant M&A activities in recent years, with deal values exceeding $XX Million in aggregate. These mergers and acquisitions are driven by the desire to expand market reach, enhance technological capabilities, and secure access to talent. Strategic partnerships and collaborations further enhance innovation and market penetration.
Event Stream Processing Industry Industry Evolution
The Event Stream Processing market has evolved from niche applications to a mainstream technology, driven by the exponential growth of data volume and velocity. Early adoption focused on specific sectors like finance (algorithmic trading, fraud detection). However, the expanding applications across various industries, coupled with technological advancements, have broadened its reach. The market witnessed a period of robust growth during the historical period (2019-2024), experiencing a CAGR of XX%. This growth trajectory is projected to continue during the forecast period (2025-2033), with a slightly moderated CAGR of XX% due to market maturity and increased competition.
Technological advancements such as serverless computing, edge computing, and the evolution of stream processing engines (e.g., Apache Flink, Apache Kafka Streams) have further accelerated market growth. The increasing adoption of cloud-based ESP solutions has also significantly impacted market dynamics, allowing businesses to scale resources efficiently and reduce operational costs. Consumer demand is shifting towards more robust, scalable, and easily integrated ESP solutions. This shift is driving the development of no-code and low-code platforms, simplifying deployment and facilitating wider adoption across smaller businesses. The adoption rate of ESP solutions shows a strong positive correlation with increased digital transformation initiatives across industries. Specific sectors such as BFSI and Retail & E-commerce are showing particularly rapid adoption rates, driven by the need for real-time customer personalization and fraud prevention.
Leading Regions, Countries, or Segments in Event Stream Processing Industry
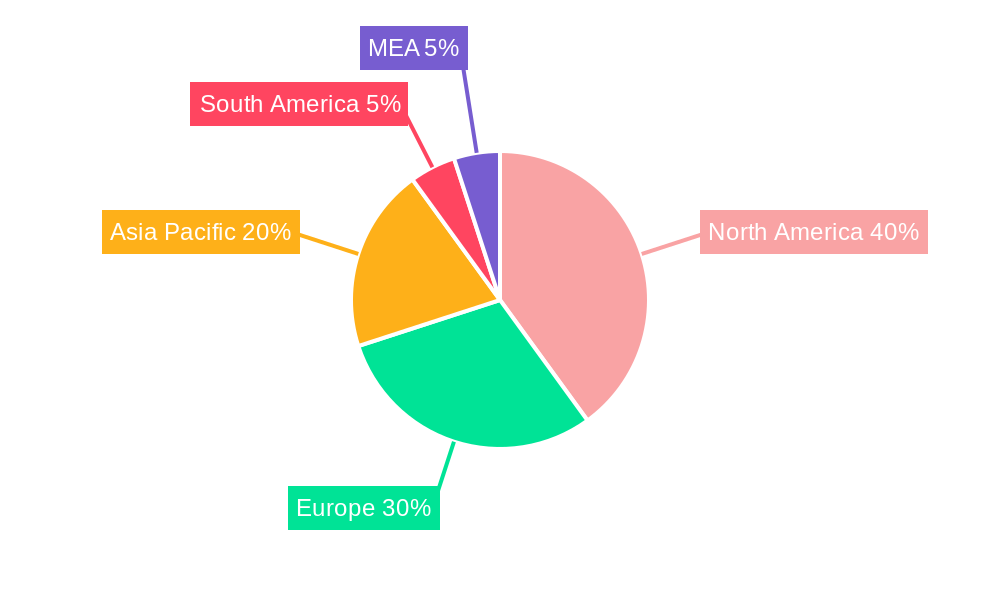
North America currently holds the leading position in the Event Stream Processing market, driven by high technological adoption, strong digital infrastructure, and a considerable number of early adopters. However, Asia-Pacific is projected to experience the fastest growth rate during the forecast period.
Key Drivers (North America):
- High levels of IT spending and digital transformation initiatives.
- Presence of major technology companies driving innovation.
- Strong regulatory environment fostering data security and compliance.
Key Drivers (Asia-Pacific):
- Rapidly expanding digital economy and e-commerce growth.
- Growing demand for real-time data analytics in various sectors.
- Increasing government investments in digital infrastructure.
Dominant Segments:
- Component: Solutions (Software & Platforms) currently holds the largest market share, driven by increasing demand for advanced analytics capabilities. Services are projected to witness strong growth due to the increasing complexity of ESP deployments.
- Application: Fraud detection and algorithmic trading remain key application segments. However, predictive maintenance and sales & marketing are rapidly gaining traction, showcasing the versatility of ESP.
- End-user Vertical: IT & Telecommunications, BFSI, and Manufacturing sectors show the highest adoption rates for ESP solutions, primarily driven by their need for real-time insights and process optimization.
- Deployment Type: Cloud-based deployments are increasingly dominant due to scalability, cost-effectiveness, and ease of management.
Event Stream Processing Industry Product Innovations
Recent innovations in ESP include the rise of serverless stream processing, enabling real-time data processing without managing infrastructure. Advances in machine learning integration allow for more sophisticated real-time insights. The development of no-code/low-code platforms simplifies development and deployment, widening access across various skill sets. Key performance metrics focus on latency, throughput, and scalability, reflecting the critical need for real-time responsiveness and processing large data volumes efficiently. Unique selling propositions often include ease of integration with existing data pipelines, advanced analytics capabilities, and robust security features.
Propelling Factors for Event Stream Processing Industry Growth
Several factors are propelling the growth of the Event Stream Processing industry. Firstly, the exponential growth of data generated by connected devices and digital platforms fuels the demand for real-time analytics. Secondly, advancements in cloud computing and big data technologies have lowered the barrier to entry for ESP adoption. Finally, government regulations promoting data security and compliance stimulate the need for robust and secure ESP solutions.
Obstacles in the Event Stream Processing Industry Market
The market faces several challenges. Data security concerns and compliance complexities represent major obstacles. The need for skilled professionals capable of managing complex ESP systems presents a talent gap. Integration complexities with legacy systems can hinder adoption, especially in enterprises with extensive IT infrastructures. Competitive pressures are also significant, with established players and emerging startups vying for market share. The overall impact of these obstacles is estimated to slightly moderate the market's projected growth rate during the forecast period.
Future Opportunities in Event Stream Processing Industry
Emerging opportunities lie in the integration of ESP with edge computing, enabling real-time analytics at the source of data generation. Expansion into new industries, particularly those with limited real-time analytics adoption, presents significant market potential. The continued development of more sophisticated AI and ML algorithms for stream processing will unlock new insights and applications, pushing the boundaries of real-time analytics.
Major Players in the Event Stream Processing Industry Ecosystem
- Hazelcast IMDG
- Informatica
- IBM Corporation
- Hitachi Vantara
- SAS
- Microsoft Corporation
- Confluent Inc
- Redhat
- Amazon Web Services Inc
- Oracle Corporation
- Salesforce
- TIBCO
- Google Inc
- SAP SE
Key Developments in Event Stream Processing Industry Industry
- October 2022: Microsoft launched the Azure Stream Analytics no-code editor, significantly simplifying stream processing job creation. This development lowers the barrier to entry for users without coding expertise, driving wider adoption.
- August 2022: The partnership between DataStax and Decodable streamlined real-time application development using Apache Cassandra, Apache Pulsar, and Apache Flink. This collaboration fostered innovation and enhanced the efficiency of building real-time data services.
Strategic Event Stream Processing Industry Market Forecast
The Event Stream Processing market is poised for continued growth, driven by technological advancements, expanding applications, and increasing demand for real-time insights across diverse industries. The market's future success will hinge on addressing challenges related to data security, talent acquisition, and integration complexities. However, innovative solutions and strategic partnerships will be crucial to unlock the full potential of the ESP market, leading to robust growth and significant market expansion throughout the forecast period.
Event Stream Processing Industry Segmentation
-
1. Deployment Type
- 1.1. Cloud
- 1.2. On-premise
-
2. Component
- 2.1. Solutions (Software & Platforms)
- 2.2. Services
-
3. Application**
- 3.1. Fraud Detection
- 3.2. Algorithmic Trading
- 3.3. Process Monitoring
- 3.4. Predictive Maintenance
- 3.5. Sales and Marketing
-
4. End-user Vertical
- 4.1. IT & Telecommunications
- 4.2. BFSI
- 4.3. Manufacturing
- 4.4. Retail & E-commerce
- 4.5. Energy & Utilities
- 4.6. Other End-user Verticals
Event Stream Processing Industry Segmentation By Geography
- 1. North America
- 2. Europe
- 3. Asia Pacific
- 4. Latin America
- 5. Middle East and Africa
Event Stream Processing Industry REPORT HIGHLIGHTS
| Aspects | Details |
|---|---|
| Study Period | 2019-2033 |
| Base Year | 2024 |
| Estimated Year | 2025 |
| Forecast Period | 2025-2033 |
| Historical Period | 2019-2024 |
| Growth Rate | CAGR of 15.70% from 2019-2033 |
| Segmentation |
|
Table of Contents
- 1. Introduction
- 1.1. Research Scope
- 1.2. Market Segmentation
- 1.3. Research Methodology
- 1.4. Definitions and Assumptions
- 2. Executive Summary
- 2.1. Introduction
- 3. Market Dynamics
- 3.1. Introduction
- 3.2. Market Drivers
- 3.2.1. Increasing Adoption of the Internet of Things (IoT) and Smart Devices; Increasing Need to Analyze Large Volumes of Data From Diverse Sources
- 3.3. Market Restrains
- 3.3.1. Concerns Associated with Data Security and Privacy
- 3.4. Market Trends
- 3.4.1. Increasing Adoption of the Internet of Things (IoT) and Smart Devices
- 4. Market Factor Analysis
- 4.1. Porters Five Forces
- 4.2. Supply/Value Chain
- 4.3. PESTEL analysis
- 4.4. Market Entropy
- 4.5. Patent/Trademark Analysis
- 5. Global Event Stream Processing Industry Analysis, Insights and Forecast, 2019-2031
- 5.1. Market Analysis, Insights and Forecast - by Deployment Type
- 5.1.1. Cloud
- 5.1.2. On-premise
- 5.2. Market Analysis, Insights and Forecast - by Component
- 5.2.1. Solutions (Software & Platforms)
- 5.2.2. Services
- 5.3. Market Analysis, Insights and Forecast - by Application**
- 5.3.1. Fraud Detection
- 5.3.2. Algorithmic Trading
- 5.3.3. Process Monitoring
- 5.3.4. Predictive Maintenance
- 5.3.5. Sales and Marketing
- 5.4. Market Analysis, Insights and Forecast - by End-user Vertical
- 5.4.1. IT & Telecommunications
- 5.4.2. BFSI
- 5.4.3. Manufacturing
- 5.4.4. Retail & E-commerce
- 5.4.5. Energy & Utilities
- 5.4.6. Other End-user Verticals
- 5.5. Market Analysis, Insights and Forecast - by Region
- 5.5.1. North America
- 5.5.2. Europe
- 5.5.3. Asia Pacific
- 5.5.4. Latin America
- 5.5.5. Middle East and Africa
- 5.1. Market Analysis, Insights and Forecast - by Deployment Type
- 6. North America Event Stream Processing Industry Analysis, Insights and Forecast, 2019-2031
- 6.1. Market Analysis, Insights and Forecast - by Deployment Type
- 6.1.1. Cloud
- 6.1.2. On-premise
- 6.2. Market Analysis, Insights and Forecast - by Component
- 6.2.1. Solutions (Software & Platforms)
- 6.2.2. Services
- 6.3. Market Analysis, Insights and Forecast - by Application**
- 6.3.1. Fraud Detection
- 6.3.2. Algorithmic Trading
- 6.3.3. Process Monitoring
- 6.3.4. Predictive Maintenance
- 6.3.5. Sales and Marketing
- 6.4. Market Analysis, Insights and Forecast - by End-user Vertical
- 6.4.1. IT & Telecommunications
- 6.4.2. BFSI
- 6.4.3. Manufacturing
- 6.4.4. Retail & E-commerce
- 6.4.5. Energy & Utilities
- 6.4.6. Other End-user Verticals
- 6.1. Market Analysis, Insights and Forecast - by Deployment Type
- 7. Europe Event Stream Processing Industry Analysis, Insights and Forecast, 2019-2031
- 7.1. Market Analysis, Insights and Forecast - by Deployment Type
- 7.1.1. Cloud
- 7.1.2. On-premise
- 7.2. Market Analysis, Insights and Forecast - by Component
- 7.2.1. Solutions (Software & Platforms)
- 7.2.2. Services
- 7.3. Market Analysis, Insights and Forecast - by Application**
- 7.3.1. Fraud Detection
- 7.3.2. Algorithmic Trading
- 7.3.3. Process Monitoring
- 7.3.4. Predictive Maintenance
- 7.3.5. Sales and Marketing
- 7.4. Market Analysis, Insights and Forecast - by End-user Vertical
- 7.4.1. IT & Telecommunications
- 7.4.2. BFSI
- 7.4.3. Manufacturing
- 7.4.4. Retail & E-commerce
- 7.4.5. Energy & Utilities
- 7.4.6. Other End-user Verticals
- 7.1. Market Analysis, Insights and Forecast - by Deployment Type
- 8. Asia Pacific Event Stream Processing Industry Analysis, Insights and Forecast, 2019-2031
- 8.1. Market Analysis, Insights and Forecast - by Deployment Type
- 8.1.1. Cloud
- 8.1.2. On-premise
- 8.2. Market Analysis, Insights and Forecast - by Component
- 8.2.1. Solutions (Software & Platforms)
- 8.2.2. Services
- 8.3. Market Analysis, Insights and Forecast - by Application**
- 8.3.1. Fraud Detection
- 8.3.2. Algorithmic Trading
- 8.3.3. Process Monitoring
- 8.3.4. Predictive Maintenance
- 8.3.5. Sales and Marketing
- 8.4. Market Analysis, Insights and Forecast - by End-user Vertical
- 8.4.1. IT & Telecommunications
- 8.4.2. BFSI
- 8.4.3. Manufacturing
- 8.4.4. Retail & E-commerce
- 8.4.5. Energy & Utilities
- 8.4.6. Other End-user Verticals
- 8.1. Market Analysis, Insights and Forecast - by Deployment Type
- 9. Latin America Event Stream Processing Industry Analysis, Insights and Forecast, 2019-2031
- 9.1. Market Analysis, Insights and Forecast - by Deployment Type
- 9.1.1. Cloud
- 9.1.2. On-premise
- 9.2. Market Analysis, Insights and Forecast - by Component
- 9.2.1. Solutions (Software & Platforms)
- 9.2.2. Services
- 9.3. Market Analysis, Insights and Forecast - by Application**
- 9.3.1. Fraud Detection
- 9.3.2. Algorithmic Trading
- 9.3.3. Process Monitoring
- 9.3.4. Predictive Maintenance
- 9.3.5. Sales and Marketing
- 9.4. Market Analysis, Insights and Forecast - by End-user Vertical
- 9.4.1. IT & Telecommunications
- 9.4.2. BFSI
- 9.4.3. Manufacturing
- 9.4.4. Retail & E-commerce
- 9.4.5. Energy & Utilities
- 9.4.6. Other End-user Verticals
- 9.1. Market Analysis, Insights and Forecast - by Deployment Type
- 10. Middle East and Africa Event Stream Processing Industry Analysis, Insights and Forecast, 2019-2031
- 10.1. Market Analysis, Insights and Forecast - by Deployment Type
- 10.1.1. Cloud
- 10.1.2. On-premise
- 10.2. Market Analysis, Insights and Forecast - by Component
- 10.2.1. Solutions (Software & Platforms)
- 10.2.2. Services
- 10.3. Market Analysis, Insights and Forecast - by Application**
- 10.3.1. Fraud Detection
- 10.3.2. Algorithmic Trading
- 10.3.3. Process Monitoring
- 10.3.4. Predictive Maintenance
- 10.3.5. Sales and Marketing
- 10.4. Market Analysis, Insights and Forecast - by End-user Vertical
- 10.4.1. IT & Telecommunications
- 10.4.2. BFSI
- 10.4.3. Manufacturing
- 10.4.4. Retail & E-commerce
- 10.4.5. Energy & Utilities
- 10.4.6. Other End-user Verticals
- 10.1. Market Analysis, Insights and Forecast - by Deployment Type
- 11. North America Event Stream Processing Industry Analysis, Insights and Forecast, 2019-2031
- 11.1. Market Analysis, Insights and Forecast - By Country/Sub-region
- 11.1.1 United States
- 11.1.2 Canada
- 11.1.3 Mexico
- 12. Europe Event Stream Processing Industry Analysis, Insights and Forecast, 2019-2031
- 12.1. Market Analysis, Insights and Forecast - By Country/Sub-region
- 12.1.1 Germany
- 12.1.2 United Kingdom
- 12.1.3 France
- 12.1.4 Spain
- 12.1.5 Italy
- 12.1.6 Spain
- 12.1.7 Belgium
- 12.1.8 Netherland
- 12.1.9 Nordics
- 12.1.10 Rest of Europe
- 13. Asia Pacific Event Stream Processing Industry Analysis, Insights and Forecast, 2019-2031
- 13.1. Market Analysis, Insights and Forecast - By Country/Sub-region
- 13.1.1 China
- 13.1.2 Japan
- 13.1.3 India
- 13.1.4 South Korea
- 13.1.5 Southeast Asia
- 13.1.6 Australia
- 13.1.7 Indonesia
- 13.1.8 Phillipes
- 13.1.9 Singapore
- 13.1.10 Thailandc
- 13.1.11 Rest of Asia Pacific
- 14. South America Event Stream Processing Industry Analysis, Insights and Forecast, 2019-2031
- 14.1. Market Analysis, Insights and Forecast - By Country/Sub-region
- 14.1.1 Brazil
- 14.1.2 Argentina
- 14.1.3 Peru
- 14.1.4 Chile
- 14.1.5 Colombia
- 14.1.6 Ecuador
- 14.1.7 Venezuela
- 14.1.8 Rest of South America
- 15. North America Event Stream Processing Industry Analysis, Insights and Forecast, 2019-2031
- 15.1. Market Analysis, Insights and Forecast - By Country/Sub-region
- 15.1.1 United States
- 15.1.2 Canada
- 15.1.3 Mexico
- 16. MEA Event Stream Processing Industry Analysis, Insights and Forecast, 2019-2031
- 16.1. Market Analysis, Insights and Forecast - By Country/Sub-region
- 16.1.1 United Arab Emirates
- 16.1.2 Saudi Arabia
- 16.1.3 South Africa
- 16.1.4 Rest of Middle East and Africa
- 17. Competitive Analysis
- 17.1. Global Market Share Analysis 2024
- 17.2. Company Profiles
- 17.2.1 Hazelcast IMDG
- 17.2.1.1. Overview
- 17.2.1.2. Products
- 17.2.1.3. SWOT Analysis
- 17.2.1.4. Recent Developments
- 17.2.1.5. Financials (Based on Availability)
- 17.2.2 Informatic
- 17.2.2.1. Overview
- 17.2.2.2. Products
- 17.2.2.3. SWOT Analysis
- 17.2.2.4. Recent Developments
- 17.2.2.5. Financials (Based on Availability)
- 17.2.3 IBM Corporation
- 17.2.3.1. Overview
- 17.2.3.2. Products
- 17.2.3.3. SWOT Analysis
- 17.2.3.4. Recent Developments
- 17.2.3.5. Financials (Based on Availability)
- 17.2.4 Hitachi Vantara
- 17.2.4.1. Overview
- 17.2.4.2. Products
- 17.2.4.3. SWOT Analysis
- 17.2.4.4. Recent Developments
- 17.2.4.5. Financials (Based on Availability)
- 17.2.5 SAS
- 17.2.5.1. Overview
- 17.2.5.2. Products
- 17.2.5.3. SWOT Analysis
- 17.2.5.4. Recent Developments
- 17.2.5.5. Financials (Based on Availability)
- 17.2.6 Microsoft Corporation
- 17.2.6.1. Overview
- 17.2.6.2. Products
- 17.2.6.3. SWOT Analysis
- 17.2.6.4. Recent Developments
- 17.2.6.5. Financials (Based on Availability)
- 17.2.7 Confluent Inc
- 17.2.7.1. Overview
- 17.2.7.2. Products
- 17.2.7.3. SWOT Analysis
- 17.2.7.4. Recent Developments
- 17.2.7.5. Financials (Based on Availability)
- 17.2.8 Redhat
- 17.2.8.1. Overview
- 17.2.8.2. Products
- 17.2.8.3. SWOT Analysis
- 17.2.8.4. Recent Developments
- 17.2.8.5. Financials (Based on Availability)
- 17.2.9 Amazon Web Services Inc
- 17.2.9.1. Overview
- 17.2.9.2. Products
- 17.2.9.3. SWOT Analysis
- 17.2.9.4. Recent Developments
- 17.2.9.5. Financials (Based on Availability)
- 17.2.10 Oracle Corporation
- 17.2.10.1. Overview
- 17.2.10.2. Products
- 17.2.10.3. SWOT Analysis
- 17.2.10.4. Recent Developments
- 17.2.10.5. Financials (Based on Availability)
- 17.2.11 Salesforce
- 17.2.11.1. Overview
- 17.2.11.2. Products
- 17.2.11.3. SWOT Analysis
- 17.2.11.4. Recent Developments
- 17.2.11.5. Financials (Based on Availability)
- 17.2.12 TIBCO
- 17.2.12.1. Overview
- 17.2.12.2. Products
- 17.2.12.3. SWOT Analysis
- 17.2.12.4. Recent Developments
- 17.2.12.5. Financials (Based on Availability)
- 17.2.13 Google Inc
- 17.2.13.1. Overview
- 17.2.13.2. Products
- 17.2.13.3. SWOT Analysis
- 17.2.13.4. Recent Developments
- 17.2.13.5. Financials (Based on Availability)
- 17.2.14 SAP SE
- 17.2.14.1. Overview
- 17.2.14.2. Products
- 17.2.14.3. SWOT Analysis
- 17.2.14.4. Recent Developments
- 17.2.14.5. Financials (Based on Availability)
- 17.2.1 Hazelcast IMDG
List of Figures
- Figure 1: Global Event Stream Processing Industry Revenue Breakdown (Million, %) by Region 2024 & 2032
- Figure 2: North America Event Stream Processing Industry Revenue (Million), by Country 2024 & 2032
- Figure 3: North America Event Stream Processing Industry Revenue Share (%), by Country 2024 & 2032
- Figure 4: Europe Event Stream Processing Industry Revenue (Million), by Country 2024 & 2032
- Figure 5: Europe Event Stream Processing Industry Revenue Share (%), by Country 2024 & 2032
- Figure 6: Asia Pacific Event Stream Processing Industry Revenue (Million), by Country 2024 & 2032
- Figure 7: Asia Pacific Event Stream Processing Industry Revenue Share (%), by Country 2024 & 2032
- Figure 8: South America Event Stream Processing Industry Revenue (Million), by Country 2024 & 2032
- Figure 9: South America Event Stream Processing Industry Revenue Share (%), by Country 2024 & 2032
- Figure 10: North America Event Stream Processing Industry Revenue (Million), by Country 2024 & 2032
- Figure 11: North America Event Stream Processing Industry Revenue Share (%), by Country 2024 & 2032
- Figure 12: MEA Event Stream Processing Industry Revenue (Million), by Country 2024 & 2032
- Figure 13: MEA Event Stream Processing Industry Revenue Share (%), by Country 2024 & 2032
- Figure 14: North America Event Stream Processing Industry Revenue (Million), by Deployment Type 2024 & 2032
- Figure 15: North America Event Stream Processing Industry Revenue Share (%), by Deployment Type 2024 & 2032
- Figure 16: North America Event Stream Processing Industry Revenue (Million), by Component 2024 & 2032
- Figure 17: North America Event Stream Processing Industry Revenue Share (%), by Component 2024 & 2032
- Figure 18: North America Event Stream Processing Industry Revenue (Million), by Application** 2024 & 2032
- Figure 19: North America Event Stream Processing Industry Revenue Share (%), by Application** 2024 & 2032
- Figure 20: North America Event Stream Processing Industry Revenue (Million), by End-user Vertical 2024 & 2032
- Figure 21: North America Event Stream Processing Industry Revenue Share (%), by End-user Vertical 2024 & 2032
- Figure 22: North America Event Stream Processing Industry Revenue (Million), by Country 2024 & 2032
- Figure 23: North America Event Stream Processing Industry Revenue Share (%), by Country 2024 & 2032
- Figure 24: Europe Event Stream Processing Industry Revenue (Million), by Deployment Type 2024 & 2032
- Figure 25: Europe Event Stream Processing Industry Revenue Share (%), by Deployment Type 2024 & 2032
- Figure 26: Europe Event Stream Processing Industry Revenue (Million), by Component 2024 & 2032
- Figure 27: Europe Event Stream Processing Industry Revenue Share (%), by Component 2024 & 2032
- Figure 28: Europe Event Stream Processing Industry Revenue (Million), by Application** 2024 & 2032
- Figure 29: Europe Event Stream Processing Industry Revenue Share (%), by Application** 2024 & 2032
- Figure 30: Europe Event Stream Processing Industry Revenue (Million), by End-user Vertical 2024 & 2032
- Figure 31: Europe Event Stream Processing Industry Revenue Share (%), by End-user Vertical 2024 & 2032
- Figure 32: Europe Event Stream Processing Industry Revenue (Million), by Country 2024 & 2032
- Figure 33: Europe Event Stream Processing Industry Revenue Share (%), by Country 2024 & 2032
- Figure 34: Asia Pacific Event Stream Processing Industry Revenue (Million), by Deployment Type 2024 & 2032
- Figure 35: Asia Pacific Event Stream Processing Industry Revenue Share (%), by Deployment Type 2024 & 2032
- Figure 36: Asia Pacific Event Stream Processing Industry Revenue (Million), by Component 2024 & 2032
- Figure 37: Asia Pacific Event Stream Processing Industry Revenue Share (%), by Component 2024 & 2032
- Figure 38: Asia Pacific Event Stream Processing Industry Revenue (Million), by Application** 2024 & 2032
- Figure 39: Asia Pacific Event Stream Processing Industry Revenue Share (%), by Application** 2024 & 2032
- Figure 40: Asia Pacific Event Stream Processing Industry Revenue (Million), by End-user Vertical 2024 & 2032
- Figure 41: Asia Pacific Event Stream Processing Industry Revenue Share (%), by End-user Vertical 2024 & 2032
- Figure 42: Asia Pacific Event Stream Processing Industry Revenue (Million), by Country 2024 & 2032
- Figure 43: Asia Pacific Event Stream Processing Industry Revenue Share (%), by Country 2024 & 2032
- Figure 44: Latin America Event Stream Processing Industry Revenue (Million), by Deployment Type 2024 & 2032
- Figure 45: Latin America Event Stream Processing Industry Revenue Share (%), by Deployment Type 2024 & 2032
- Figure 46: Latin America Event Stream Processing Industry Revenue (Million), by Component 2024 & 2032
- Figure 47: Latin America Event Stream Processing Industry Revenue Share (%), by Component 2024 & 2032
- Figure 48: Latin America Event Stream Processing Industry Revenue (Million), by Application** 2024 & 2032
- Figure 49: Latin America Event Stream Processing Industry Revenue Share (%), by Application** 2024 & 2032
- Figure 50: Latin America Event Stream Processing Industry Revenue (Million), by End-user Vertical 2024 & 2032
- Figure 51: Latin America Event Stream Processing Industry Revenue Share (%), by End-user Vertical 2024 & 2032
- Figure 52: Latin America Event Stream Processing Industry Revenue (Million), by Country 2024 & 2032
- Figure 53: Latin America Event Stream Processing Industry Revenue Share (%), by Country 2024 & 2032
- Figure 54: Middle East and Africa Event Stream Processing Industry Revenue (Million), by Deployment Type 2024 & 2032
- Figure 55: Middle East and Africa Event Stream Processing Industry Revenue Share (%), by Deployment Type 2024 & 2032
- Figure 56: Middle East and Africa Event Stream Processing Industry Revenue (Million), by Component 2024 & 2032
- Figure 57: Middle East and Africa Event Stream Processing Industry Revenue Share (%), by Component 2024 & 2032
- Figure 58: Middle East and Africa Event Stream Processing Industry Revenue (Million), by Application** 2024 & 2032
- Figure 59: Middle East and Africa Event Stream Processing Industry Revenue Share (%), by Application** 2024 & 2032
- Figure 60: Middle East and Africa Event Stream Processing Industry Revenue (Million), by End-user Vertical 2024 & 2032
- Figure 61: Middle East and Africa Event Stream Processing Industry Revenue Share (%), by End-user Vertical 2024 & 2032
- Figure 62: Middle East and Africa Event Stream Processing Industry Revenue (Million), by Country 2024 & 2032
- Figure 63: Middle East and Africa Event Stream Processing Industry Revenue Share (%), by Country 2024 & 2032
List of Tables
- Table 1: Global Event Stream Processing Industry Revenue Million Forecast, by Region 2019 & 2032
- Table 2: Global Event Stream Processing Industry Revenue Million Forecast, by Deployment Type 2019 & 2032
- Table 3: Global Event Stream Processing Industry Revenue Million Forecast, by Component 2019 & 2032
- Table 4: Global Event Stream Processing Industry Revenue Million Forecast, by Application** 2019 & 2032
- Table 5: Global Event Stream Processing Industry Revenue Million Forecast, by End-user Vertical 2019 & 2032
- Table 6: Global Event Stream Processing Industry Revenue Million Forecast, by Region 2019 & 2032
- Table 7: Global Event Stream Processing Industry Revenue Million Forecast, by Country 2019 & 2032
- Table 8: United States Event Stream Processing Industry Revenue (Million) Forecast, by Application 2019 & 2032
- Table 9: Canada Event Stream Processing Industry Revenue (Million) Forecast, by Application 2019 & 2032
- Table 10: Mexico Event Stream Processing Industry Revenue (Million) Forecast, by Application 2019 & 2032
- Table 11: Global Event Stream Processing Industry Revenue Million Forecast, by Country 2019 & 2032
- Table 12: Germany Event Stream Processing Industry Revenue (Million) Forecast, by Application 2019 & 2032
- Table 13: United Kingdom Event Stream Processing Industry Revenue (Million) Forecast, by Application 2019 & 2032
- Table 14: France Event Stream Processing Industry Revenue (Million) Forecast, by Application 2019 & 2032
- Table 15: Spain Event Stream Processing Industry Revenue (Million) Forecast, by Application 2019 & 2032
- Table 16: Italy Event Stream Processing Industry Revenue (Million) Forecast, by Application 2019 & 2032
- Table 17: Spain Event Stream Processing Industry Revenue (Million) Forecast, by Application 2019 & 2032
- Table 18: Belgium Event Stream Processing Industry Revenue (Million) Forecast, by Application 2019 & 2032
- Table 19: Netherland Event Stream Processing Industry Revenue (Million) Forecast, by Application 2019 & 2032
- Table 20: Nordics Event Stream Processing Industry Revenue (Million) Forecast, by Application 2019 & 2032
- Table 21: Rest of Europe Event Stream Processing Industry Revenue (Million) Forecast, by Application 2019 & 2032
- Table 22: Global Event Stream Processing Industry Revenue Million Forecast, by Country 2019 & 2032
- Table 23: China Event Stream Processing Industry Revenue (Million) Forecast, by Application 2019 & 2032
- Table 24: Japan Event Stream Processing Industry Revenue (Million) Forecast, by Application 2019 & 2032
- Table 25: India Event Stream Processing Industry Revenue (Million) Forecast, by Application 2019 & 2032
- Table 26: South Korea Event Stream Processing Industry Revenue (Million) Forecast, by Application 2019 & 2032
- Table 27: Southeast Asia Event Stream Processing Industry Revenue (Million) Forecast, by Application 2019 & 2032
- Table 28: Australia Event Stream Processing Industry Revenue (Million) Forecast, by Application 2019 & 2032
- Table 29: Indonesia Event Stream Processing Industry Revenue (Million) Forecast, by Application 2019 & 2032
- Table 30: Phillipes Event Stream Processing Industry Revenue (Million) Forecast, by Application 2019 & 2032
- Table 31: Singapore Event Stream Processing Industry Revenue (Million) Forecast, by Application 2019 & 2032
- Table 32: Thailandc Event Stream Processing Industry Revenue (Million) Forecast, by Application 2019 & 2032
- Table 33: Rest of Asia Pacific Event Stream Processing Industry Revenue (Million) Forecast, by Application 2019 & 2032
- Table 34: Global Event Stream Processing Industry Revenue Million Forecast, by Country 2019 & 2032
- Table 35: Brazil Event Stream Processing Industry Revenue (Million) Forecast, by Application 2019 & 2032
- Table 36: Argentina Event Stream Processing Industry Revenue (Million) Forecast, by Application 2019 & 2032
- Table 37: Peru Event Stream Processing Industry Revenue (Million) Forecast, by Application 2019 & 2032
- Table 38: Chile Event Stream Processing Industry Revenue (Million) Forecast, by Application 2019 & 2032
- Table 39: Colombia Event Stream Processing Industry Revenue (Million) Forecast, by Application 2019 & 2032
- Table 40: Ecuador Event Stream Processing Industry Revenue (Million) Forecast, by Application 2019 & 2032
- Table 41: Venezuela Event Stream Processing Industry Revenue (Million) Forecast, by Application 2019 & 2032
- Table 42: Rest of South America Event Stream Processing Industry Revenue (Million) Forecast, by Application 2019 & 2032
- Table 43: Global Event Stream Processing Industry Revenue Million Forecast, by Country 2019 & 2032
- Table 44: United States Event Stream Processing Industry Revenue (Million) Forecast, by Application 2019 & 2032
- Table 45: Canada Event Stream Processing Industry Revenue (Million) Forecast, by Application 2019 & 2032
- Table 46: Mexico Event Stream Processing Industry Revenue (Million) Forecast, by Application 2019 & 2032
- Table 47: Global Event Stream Processing Industry Revenue Million Forecast, by Country 2019 & 2032
- Table 48: United Arab Emirates Event Stream Processing Industry Revenue (Million) Forecast, by Application 2019 & 2032
- Table 49: Saudi Arabia Event Stream Processing Industry Revenue (Million) Forecast, by Application 2019 & 2032
- Table 50: South Africa Event Stream Processing Industry Revenue (Million) Forecast, by Application 2019 & 2032
- Table 51: Rest of Middle East and Africa Event Stream Processing Industry Revenue (Million) Forecast, by Application 2019 & 2032
- Table 52: Global Event Stream Processing Industry Revenue Million Forecast, by Deployment Type 2019 & 2032
- Table 53: Global Event Stream Processing Industry Revenue Million Forecast, by Component 2019 & 2032
- Table 54: Global Event Stream Processing Industry Revenue Million Forecast, by Application** 2019 & 2032
- Table 55: Global Event Stream Processing Industry Revenue Million Forecast, by End-user Vertical 2019 & 2032
- Table 56: Global Event Stream Processing Industry Revenue Million Forecast, by Country 2019 & 2032
- Table 57: Global Event Stream Processing Industry Revenue Million Forecast, by Deployment Type 2019 & 2032
- Table 58: Global Event Stream Processing Industry Revenue Million Forecast, by Component 2019 & 2032
- Table 59: Global Event Stream Processing Industry Revenue Million Forecast, by Application** 2019 & 2032
- Table 60: Global Event Stream Processing Industry Revenue Million Forecast, by End-user Vertical 2019 & 2032
- Table 61: Global Event Stream Processing Industry Revenue Million Forecast, by Country 2019 & 2032
- Table 62: Global Event Stream Processing Industry Revenue Million Forecast, by Deployment Type 2019 & 2032
- Table 63: Global Event Stream Processing Industry Revenue Million Forecast, by Component 2019 & 2032
- Table 64: Global Event Stream Processing Industry Revenue Million Forecast, by Application** 2019 & 2032
- Table 65: Global Event Stream Processing Industry Revenue Million Forecast, by End-user Vertical 2019 & 2032
- Table 66: Global Event Stream Processing Industry Revenue Million Forecast, by Country 2019 & 2032
- Table 67: Global Event Stream Processing Industry Revenue Million Forecast, by Deployment Type 2019 & 2032
- Table 68: Global Event Stream Processing Industry Revenue Million Forecast, by Component 2019 & 2032
- Table 69: Global Event Stream Processing Industry Revenue Million Forecast, by Application** 2019 & 2032
- Table 70: Global Event Stream Processing Industry Revenue Million Forecast, by End-user Vertical 2019 & 2032
- Table 71: Global Event Stream Processing Industry Revenue Million Forecast, by Country 2019 & 2032
- Table 72: Global Event Stream Processing Industry Revenue Million Forecast, by Deployment Type 2019 & 2032
- Table 73: Global Event Stream Processing Industry Revenue Million Forecast, by Component 2019 & 2032
- Table 74: Global Event Stream Processing Industry Revenue Million Forecast, by Application** 2019 & 2032
- Table 75: Global Event Stream Processing Industry Revenue Million Forecast, by End-user Vertical 2019 & 2032
- Table 76: Global Event Stream Processing Industry Revenue Million Forecast, by Country 2019 & 2032
Frequently Asked Questions
1. What is the projected Compound Annual Growth Rate (CAGR) of the Event Stream Processing Industry?
The projected CAGR is approximately 15.70%.
2. Which companies are prominent players in the Event Stream Processing Industry?
Key companies in the market include Hazelcast IMDG, Informatic, IBM Corporation, Hitachi Vantara, SAS, Microsoft Corporation, Confluent Inc, Redhat, Amazon Web Services Inc, Oracle Corporation, Salesforce, TIBCO, Google Inc, SAP SE.
3. What are the main segments of the Event Stream Processing Industry?
The market segments include Deployment Type, Component, Application**, End-user Vertical.
4. Can you provide details about the market size?
The market size is estimated to be USD XX Million as of 2022.
5. What are some drivers contributing to market growth?
Increasing Adoption of the Internet of Things (IoT) and Smart Devices; Increasing Need to Analyze Large Volumes of Data From Diverse Sources.
6. What are the notable trends driving market growth?
Increasing Adoption of the Internet of Things (IoT) and Smart Devices.
7. Are there any restraints impacting market growth?
Concerns Associated with Data Security and Privacy.
8. Can you provide examples of recent developments in the market?
October 2022: Microsoft has released the Azure Stream Analytics no-code editor, a drag-and-drop canvas for designing jobs for stream processing scenarios such as streaming ETL, ingestion, and data materialization, to general availability. The no-code editor is hosted by Azure Event Hubs, the company's big-data streaming platform and event ingestion service. Azure Stream Analytics is a service for managed real-time analytics. Its no-code editor allows users to develop a Stream Analytics job without writing a single line of code.
9. What pricing options are available for accessing the report?
Pricing options include single-user, multi-user, and enterprise licenses priced at USD 4750, USD 5250, and USD 8750 respectively.
10. Is the market size provided in terms of value or volume?
The market size is provided in terms of value, measured in Million.
11. Are there any specific market keywords associated with the report?
Yes, the market keyword associated with the report is "Event Stream Processing Industry," which aids in identifying and referencing the specific market segment covered.
12. How do I determine which pricing option suits my needs best?
The pricing options vary based on user requirements and access needs. Individual users may opt for single-user licenses, while businesses requiring broader access may choose multi-user or enterprise licenses for cost-effective access to the report.
13. Are there any additional resources or data provided in the Event Stream Processing Industry report?
While the report offers comprehensive insights, it's advisable to review the specific contents or supplementary materials provided to ascertain if additional resources or data are available.
14. How can I stay updated on further developments or reports in the Event Stream Processing Industry?
To stay informed about further developments, trends, and reports in the Event Stream Processing Industry, consider subscribing to industry newsletters, following relevant companies and organizations, or regularly checking reputable industry news sources and publications.
Methodology
Step 1 - Identification of Relevant Samples Size from Population Database


Step 2 - Approaches for Defining Global Market Size (Value, Volume* & Price*)

Note*: In applicable scenarios
Step 3 - Data Sources
Primary Research
- Web Analytics
- Survey Reports
- Research Institute
- Latest Research Reports
- Opinion Leaders
Secondary Research
- Annual Reports
- White Paper
- Latest Press Release
- Industry Association
- Paid Database
- Investor Presentations

Step 4 - Data Triangulation
Involves using different sources of information in order to increase the validity of a study
These sources are likely to be stakeholders in a program - participants, other researchers, program staff, other community members, and so on.
Then we put all data in single framework & apply various statistical tools to find out the dynamic on the market.
During the analysis stage, feedback from the stakeholder groups would be compared to determine areas of agreement as well as areas of divergence
