

Key Insights
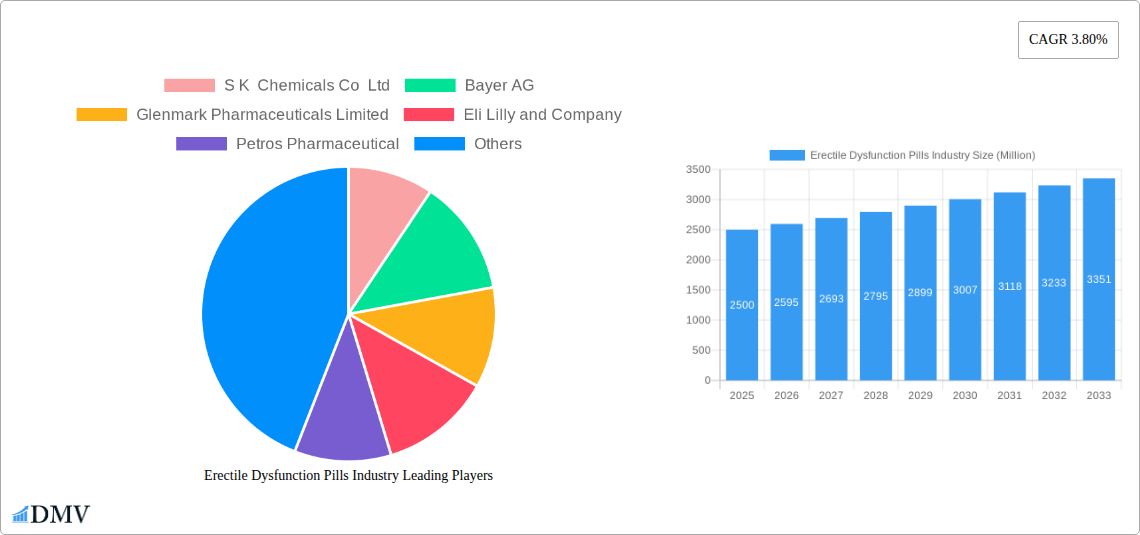
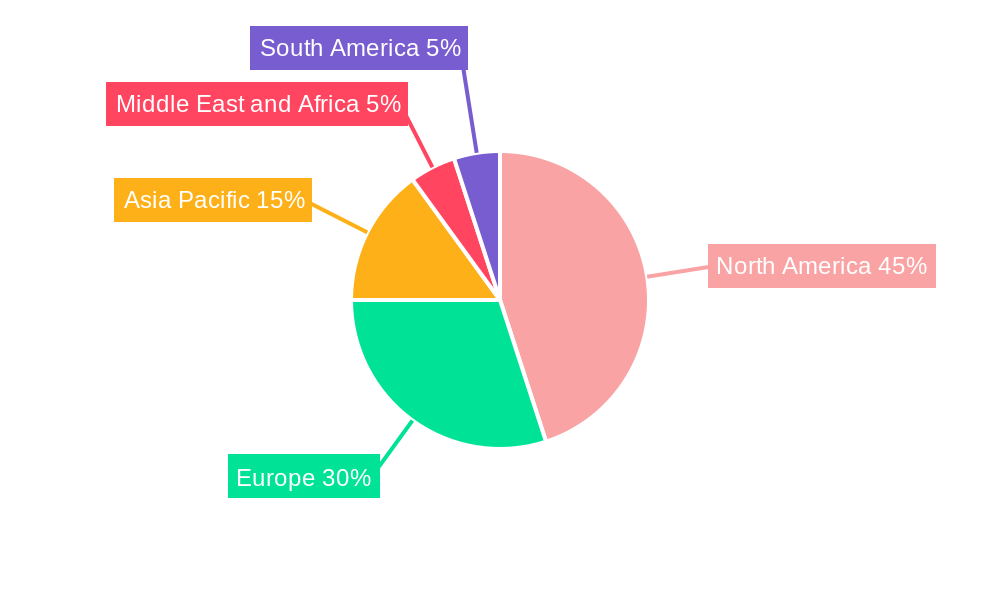
The Erectile Dysfunction (ED) pills market, valued at approximately $XX million in 2025, is projected to experience steady growth, exhibiting a Compound Annual Growth Rate (CAGR) of 3.80% from 2025 to 2033. This growth is driven by several factors, including the rising prevalence of ED among men globally, increased awareness and reduced stigma surrounding the condition, and the availability of diverse treatment options ranging from brand-name drugs like Viagra, Cialis, and Levitra to generics and newer entrants. Furthermore, the increasing adoption of telehealth and online pharmacies is facilitating easier access to ED medications, contributing to market expansion. However, potential restraints include the high cost of certain branded medications, concerns about side effects, and the emergence of alternative treatment approaches like lifestyle modifications and herbal remedies. The market is segmented by product type (Viagra, Cialis, Levitra, Stendra, and others) and distribution channel (hospital pharmacies, retail pharmacies, and online pharmacies). The North American market currently holds a significant share, driven by higher healthcare spending and greater awareness, followed by Europe and Asia Pacific. The competitive landscape comprises both established pharmaceutical giants like Pfizer and Eli Lilly and emerging players focusing on generic formulations and novel therapies. The market’s future will be shaped by the development of innovative ED treatments, increased competition, and evolving regulatory landscapes.
The forecast period from 2025 to 2033 presents numerous opportunities for growth within the ED pills market. The continued increase in the aging male population globally, a key demographic affected by ED, will drive demand. The ongoing research and development efforts focused on improving existing medications and developing new, safer, and more effective treatments will significantly influence market trajectory. Strategic partnerships between pharmaceutical companies and telehealth providers are expected to further enhance market penetration and access. Furthermore, marketing campaigns focused on educating men about ED and dispelling myths surrounding treatment will play a critical role in expanding the market. However, the market will continue to face challenges in navigating pricing pressures, ensuring patient safety and managing potential side effects, and adapting to evolving regulatory approvals. Successful market players will be those who can effectively balance innovation, affordability, and responsible marketing strategies.
Erectile Dysfunction Pills Industry: A Comprehensive Market Report (2019-2033)
This insightful report provides a detailed analysis of the Erectile Dysfunction Pills market, encompassing historical data (2019-2024), current estimations (2025), and future projections (2025-2033). It offers a deep dive into market dynamics, competitive landscapes, and future growth prospects, equipping stakeholders with actionable insights for strategic decision-making. The market is projected to reach xx Million by 2033, presenting significant opportunities for growth and investment.
Erectile Dysfunction Pills Industry Market Composition & Trends
This section evaluates the market concentration, innovation drivers, regulatory frameworks, substitute products, end-user profiles, and merger & acquisition (M&A) activities within the Erectile Dysfunction Pills industry. The market is characterized by a moderately concentrated landscape, with key players like Pfizer Inc. and Eli Lilly and Company holding significant market share. However, the emergence of new players and innovative products is gradually increasing competition.
- Market Share Distribution (2025): Pfizer Inc. (xx%), Eli Lilly and Company (xx%), Bayer AG (xx%), Others (xx%). Note: These percentages are estimations based on available data, and final values might vary slightly.
- Innovation Catalysts: Focus on novel drug delivery systems (e.g., sublingual wafers), personalized medicine approaches, and combination therapies.
- Regulatory Landscape: Stringent regulatory approvals and post-market surveillance requirements significantly impact market entry and product lifecycle management.
- Substitute Products: Alternative treatment options, such as vacuum erection devices and penile implants, exert competitive pressure.
- End-User Profiles: Primarily adult males experiencing erectile dysfunction, categorized by age, health conditions, and treatment preferences.
- M&A Activities (2019-2024): A total of xx M&A deals were recorded, with an estimated aggregate value of xx Million. These deals primarily involved smaller companies acquiring niche technologies or expanding geographical reach.
Erectile Dysfunction Pills Industry Industry Evolution
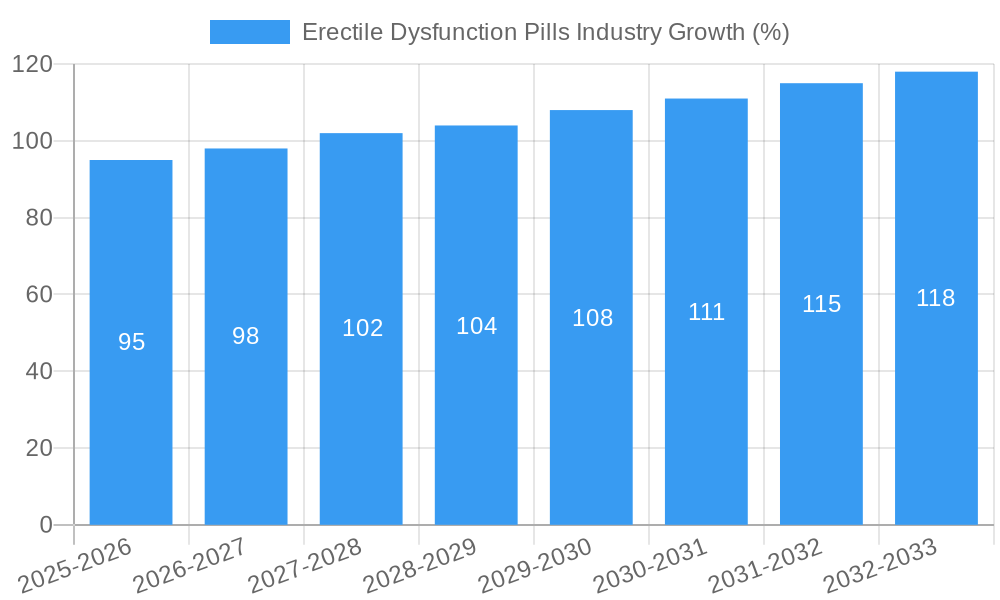
This section analyzes the historical and projected growth trajectories of the Erectile Dysfunction Pills industry, highlighting technological advancements and evolving consumer preferences. The market experienced a Compound Annual Growth Rate (CAGR) of xx% during 2019-2024, driven by increasing awareness, improved diagnostics, and the introduction of newer, more effective medications. The forecast period (2025-2033) anticipates continued growth, fueled by factors such as expanding target populations (due to aging demographics), increased healthcare expenditure, and technological innovations. The adoption rate of novel erectile dysfunction treatments is also projected to increase significantly. We project a CAGR of xx% from 2025 to 2033, with the market exceeding xx Million by the end of the forecast period. This growth reflects increased healthcare spending, coupled with a rising awareness and willingness to seek treatment for this condition.
Leading Regions, Countries, or Segments in Erectile Dysfunction Pills Industry
This section identifies the dominant regions, countries, and segments within the Erectile Dysfunction Pills market. The North American market currently holds the largest share, followed by Europe and Asia-Pacific.
Key Drivers:
- High Healthcare Expenditure: Developed regions like North America and Europe demonstrate higher healthcare spending, driving market growth.
- Favorable Regulatory Environments: Supportive regulatory frameworks and streamlined approval processes facilitate market entry.
- Stronger Awareness Campaigns: Increased public awareness campaigns regarding erectile dysfunction and its treatment options stimulate market demand.
- High Prevalence of Erectile Dysfunction: The growing prevalence of erectile dysfunction among older populations fuels market growth.
Dominance Factors: Factors contributing to regional dominance include high healthcare expenditure, favorable regulatory landscapes, and greater prevalence rates of erectile dysfunction. The strong presence of major pharmaceutical companies in certain regions also plays a significant role. Furthermore, the rising adoption of online pharmacies and direct-to-consumer marketing strategies is positively impacting market growth in certain regions. Product-wise, Viagra (sildenafil citrate) maintains a dominant market share due to its established brand recognition and widespread availability.
Erectile Dysfunction Pills Industry Product Innovations
Recent advancements in erectile dysfunction treatment include novel drug delivery systems, such as sublingual wafers and improved formulations that enhance efficacy and reduce side effects. The development of personalized medicine approaches tailored to specific patient needs also represents a significant area of innovation. This sector is witnessing the advent of combination therapies, which combine existing ED treatments with other medications to improve therapeutic efficacy. These innovations are driving market expansion and providing patients with enhanced treatment options.
Propelling Factors for Erectile Dysfunction Pills Industry Growth
Several factors contribute to the growth of the Erectile Dysfunction Pills market. Technological advancements, such as improved drug delivery systems and personalized medicine, are creating more effective and convenient treatment options. The rising prevalence of erectile dysfunction due to aging populations and lifestyle factors fuels market demand. Favorable regulatory environments and increasing healthcare spending in many countries also contribute to growth.
Obstacles in the Erectile Dysfunction Pills Industry Market
Despite significant growth potential, the Erectile Dysfunction Pills market faces several challenges. Stringent regulatory requirements for drug approval can delay product launches and increase development costs. Supply chain disruptions due to geopolitical factors and manufacturing limitations can affect product availability and prices. Intense competition among existing and emerging players puts pressure on pricing and market share. Furthermore, the potential for counterfeit drugs and the need for patient education regarding safe and appropriate usage remain significant concerns.
Future Opportunities in Erectile Dysfunction Pills Industry
Emerging markets in developing countries present significant growth opportunities. Advancements in telehealth and online pharmacies offer convenient access to treatment. The development of new drugs with improved efficacy and fewer side effects, and personalized medicine, presents further expansion opportunities. Also, increased focus on patient education and awareness campaigns will support market growth.
Major Players in the Erectile Dysfunction Pills Industry Ecosystem
- S K Chemicals Co Ltd
- Bayer AG
- Glenmark Pharmaceuticals Limited
- Eli Lilly and Company
- Petros Pharmaceutical
- Teva Pharmaceutical Industries Ltd
- Apricus Biosciences Inc
- Cipla Ltd
- Lupin Limited
- VIVUS Inc
- GlaxoSmithKline PLC
- Pfizer Inc
Key Developments in Erectile Dysfunction Pills Industry Industry
- September 2021: iX Biopharma licensed, supplied, and distributed Wafesil (sublingual sildenafil wafer) in China.
- September 2021: Almus launched Almus Erectile Dysfunction Relief 50mg tablets in the UK.
Strategic Erectile Dysfunction Pills Industry Market Forecast
The Erectile Dysfunction Pills market is poised for continued growth, driven by technological innovations, increasing prevalence of erectile dysfunction, and rising healthcare spending. Future opportunities lie in expanding into emerging markets, developing personalized treatments, and leveraging telehealth platforms. The market is expected to witness substantial growth over the forecast period, presenting lucrative investment opportunities for various stakeholders.
Erectile Dysfunction Pills Industry Segmentation
-
1. Product
- 1.1. Viagra (sildenafil citrate)
- 1.2. Cialis (Tadalafil)
- 1.3. Levitra/Staxyn (vardenafil)
- 1.4. Stendra/Spedra (avanafil)
- 1.5. Zydena (udenafil)
- 1.6. Vitaros (Alprostadil Cream)
- 1.7. Other Products
-
2. Distribution Channel
- 2.1. Hospital Pharmacies
- 2.2. Retail Pharmacies
- 2.3. Online Pharmacies
Erectile Dysfunction Pills Industry Segmentation By Geography
-
1. North America
- 1.1. United States
- 1.2. Canada
- 1.3. Mexico
-
2. Europe
- 2.1. Germany
- 2.2. United Kingdom
- 2.3. France
- 2.4. Italy
- 2.5. Spain
- 2.6. Rest of Europe
-
3. Asia Pacific
- 3.1. China
- 3.2. Japan
- 3.3. India
- 3.4. Australia
- 3.5. South Korea
- 3.6. Rest of Asia Pacific
-
4. Middle East and Africa
- 4.1. GCC
- 4.2. South Africa
- 4.3. Rest of Middle East and Africa
-
5. South America
- 5.1. Brazil
- 5.2. Argentina
- 5.3. Rest of South America
Erectile Dysfunction Pills Industry REPORT HIGHLIGHTS
| Aspects | Details |
|---|---|
| Study Period | 2019-2033 |
| Base Year | 2024 |
| Estimated Year | 2025 |
| Forecast Period | 2025-2033 |
| Historical Period | 2019-2024 |
| Growth Rate | CAGR of 3.80% from 2019-2033 |
| Segmentation |
|
Table of Contents
- 1. Introduction
- 1.1. Research Scope
- 1.2. Market Segmentation
- 1.3. Research Methodology
- 1.4. Definitions and Assumptions
- 2. Executive Summary
- 2.1. Introduction
- 3. Market Dynamics
- 3.1. Introduction
- 3.2. Market Drivers
- 3.2.1. Rising Adoption of a Sedentary Lifestyle Along with the Associated Stress; Rising Geriatric Population; Comorbidity between Erectile Dysfunction and Heart Diseases and Diabetes
- 3.3. Market Restrains
- 3.3.1. Reluctance of Patients to Seek Treatment; Poor Patient Adherence to ED Drugs
- 3.4. Market Trends
- 3.4.1. The Viagra (sildenafil citrate) Segment is Expected to Dominate the Market
- 4. Market Factor Analysis
- 4.1. Porters Five Forces
- 4.2. Supply/Value Chain
- 4.3. PESTEL analysis
- 4.4. Market Entropy
- 4.5. Patent/Trademark Analysis
- 5. Global Erectile Dysfunction Pills Industry Analysis, Insights and Forecast, 2019-2031
- 5.1. Market Analysis, Insights and Forecast - by Product
- 5.1.1. Viagra (sildenafil citrate)
- 5.1.2. Cialis (Tadalafil)
- 5.1.3. Levitra/Staxyn (vardenafil)
- 5.1.4. Stendra/Spedra (avanafil)
- 5.1.5. Zydena (udenafil)
- 5.1.6. Vitaros (Alprostadil Cream)
- 5.1.7. Other Products
- 5.2. Market Analysis, Insights and Forecast - by Distribution Channel
- 5.2.1. Hospital Pharmacies
- 5.2.2. Retail Pharmacies
- 5.2.3. Online Pharmacies
- 5.3. Market Analysis, Insights and Forecast - by Region
- 5.3.1. North America
- 5.3.2. Europe
- 5.3.3. Asia Pacific
- 5.3.4. Middle East and Africa
- 5.3.5. South America
- 5.1. Market Analysis, Insights and Forecast - by Product
- 6. North America Erectile Dysfunction Pills Industry Analysis, Insights and Forecast, 2019-2031
- 6.1. Market Analysis, Insights and Forecast - by Product
- 6.1.1. Viagra (sildenafil citrate)
- 6.1.2. Cialis (Tadalafil)
- 6.1.3. Levitra/Staxyn (vardenafil)
- 6.1.4. Stendra/Spedra (avanafil)
- 6.1.5. Zydena (udenafil)
- 6.1.6. Vitaros (Alprostadil Cream)
- 6.1.7. Other Products
- 6.2. Market Analysis, Insights and Forecast - by Distribution Channel
- 6.2.1. Hospital Pharmacies
- 6.2.2. Retail Pharmacies
- 6.2.3. Online Pharmacies
- 6.1. Market Analysis, Insights and Forecast - by Product
- 7. Europe Erectile Dysfunction Pills Industry Analysis, Insights and Forecast, 2019-2031
- 7.1. Market Analysis, Insights and Forecast - by Product
- 7.1.1. Viagra (sildenafil citrate)
- 7.1.2. Cialis (Tadalafil)
- 7.1.3. Levitra/Staxyn (vardenafil)
- 7.1.4. Stendra/Spedra (avanafil)
- 7.1.5. Zydena (udenafil)
- 7.1.6. Vitaros (Alprostadil Cream)
- 7.1.7. Other Products
- 7.2. Market Analysis, Insights and Forecast - by Distribution Channel
- 7.2.1. Hospital Pharmacies
- 7.2.2. Retail Pharmacies
- 7.2.3. Online Pharmacies
- 7.1. Market Analysis, Insights and Forecast - by Product
- 8. Asia Pacific Erectile Dysfunction Pills Industry Analysis, Insights and Forecast, 2019-2031
- 8.1. Market Analysis, Insights and Forecast - by Product
- 8.1.1. Viagra (sildenafil citrate)
- 8.1.2. Cialis (Tadalafil)
- 8.1.3. Levitra/Staxyn (vardenafil)
- 8.1.4. Stendra/Spedra (avanafil)
- 8.1.5. Zydena (udenafil)
- 8.1.6. Vitaros (Alprostadil Cream)
- 8.1.7. Other Products
- 8.2. Market Analysis, Insights and Forecast - by Distribution Channel
- 8.2.1. Hospital Pharmacies
- 8.2.2. Retail Pharmacies
- 8.2.3. Online Pharmacies
- 8.1. Market Analysis, Insights and Forecast - by Product
- 9. Middle East and Africa Erectile Dysfunction Pills Industry Analysis, Insights and Forecast, 2019-2031
- 9.1. Market Analysis, Insights and Forecast - by Product
- 9.1.1. Viagra (sildenafil citrate)
- 9.1.2. Cialis (Tadalafil)
- 9.1.3. Levitra/Staxyn (vardenafil)
- 9.1.4. Stendra/Spedra (avanafil)
- 9.1.5. Zydena (udenafil)
- 9.1.6. Vitaros (Alprostadil Cream)
- 9.1.7. Other Products
- 9.2. Market Analysis, Insights and Forecast - by Distribution Channel
- 9.2.1. Hospital Pharmacies
- 9.2.2. Retail Pharmacies
- 9.2.3. Online Pharmacies
- 9.1. Market Analysis, Insights and Forecast - by Product
- 10. South America Erectile Dysfunction Pills Industry Analysis, Insights and Forecast, 2019-2031
- 10.1. Market Analysis, Insights and Forecast - by Product
- 10.1.1. Viagra (sildenafil citrate)
- 10.1.2. Cialis (Tadalafil)
- 10.1.3. Levitra/Staxyn (vardenafil)
- 10.1.4. Stendra/Spedra (avanafil)
- 10.1.5. Zydena (udenafil)
- 10.1.6. Vitaros (Alprostadil Cream)
- 10.1.7. Other Products
- 10.2. Market Analysis, Insights and Forecast - by Distribution Channel
- 10.2.1. Hospital Pharmacies
- 10.2.2. Retail Pharmacies
- 10.2.3. Online Pharmacies
- 10.1. Market Analysis, Insights and Forecast - by Product
- 11. North America Erectile Dysfunction Pills Industry Analysis, Insights and Forecast, 2019-2031
- 11.1. Market Analysis, Insights and Forecast - By Country/Sub-region
- 11.1.1 United States
- 11.1.2 Canada
- 11.1.3 Mexico
- 12. Europe Erectile Dysfunction Pills Industry Analysis, Insights and Forecast, 2019-2031
- 12.1. Market Analysis, Insights and Forecast - By Country/Sub-region
- 12.1.1 Germany
- 12.1.2 United Kingdom
- 12.1.3 France
- 12.1.4 Italy
- 12.1.5 Spain
- 12.1.6 Rest of Europe
- 13. Asia Pacific Erectile Dysfunction Pills Industry Analysis, Insights and Forecast, 2019-2031
- 13.1. Market Analysis, Insights and Forecast - By Country/Sub-region
- 13.1.1 China
- 13.1.2 Japan
- 13.1.3 India
- 13.1.4 Australia
- 13.1.5 South Korea
- 13.1.6 Rest of Asia Pacific
- 14. Middle East and Africa Erectile Dysfunction Pills Industry Analysis, Insights and Forecast, 2019-2031
- 14.1. Market Analysis, Insights and Forecast - By Country/Sub-region
- 14.1.1 GCC
- 14.1.2 South Africa
- 14.1.3 Rest of Middle East and Africa
- 15. South America Erectile Dysfunction Pills Industry Analysis, Insights and Forecast, 2019-2031
- 15.1. Market Analysis, Insights and Forecast - By Country/Sub-region
- 15.1.1 Brazil
- 15.1.2 Argentina
- 15.1.3 Rest of South America
- 16. Competitive Analysis
- 16.1. Global Market Share Analysis 2024
- 16.2. Company Profiles
- 16.2.1 S K Chemicals Co Ltd
- 16.2.1.1. Overview
- 16.2.1.2. Products
- 16.2.1.3. SWOT Analysis
- 16.2.1.4. Recent Developments
- 16.2.1.5. Financials (Based on Availability)
- 16.2.2 Bayer AG
- 16.2.2.1. Overview
- 16.2.2.2. Products
- 16.2.2.3. SWOT Analysis
- 16.2.2.4. Recent Developments
- 16.2.2.5. Financials (Based on Availability)
- 16.2.3 Glenmark Pharmaceuticals Limited
- 16.2.3.1. Overview
- 16.2.3.2. Products
- 16.2.3.3. SWOT Analysis
- 16.2.3.4. Recent Developments
- 16.2.3.5. Financials (Based on Availability)
- 16.2.4 Eli Lilly and Company
- 16.2.4.1. Overview
- 16.2.4.2. Products
- 16.2.4.3. SWOT Analysis
- 16.2.4.4. Recent Developments
- 16.2.4.5. Financials (Based on Availability)
- 16.2.5 Petros Pharmaceutical
- 16.2.5.1. Overview
- 16.2.5.2. Products
- 16.2.5.3. SWOT Analysis
- 16.2.5.4. Recent Developments
- 16.2.5.5. Financials (Based on Availability)
- 16.2.6 Teva Pharmaceutical Industries Ltd
- 16.2.6.1. Overview
- 16.2.6.2. Products
- 16.2.6.3. SWOT Analysis
- 16.2.6.4. Recent Developments
- 16.2.6.5. Financials (Based on Availability)
- 16.2.7 Apricus Biosciences Inc
- 16.2.7.1. Overview
- 16.2.7.2. Products
- 16.2.7.3. SWOT Analysis
- 16.2.7.4. Recent Developments
- 16.2.7.5. Financials (Based on Availability)
- 16.2.8 Cipla Ltd
- 16.2.8.1. Overview
- 16.2.8.2. Products
- 16.2.8.3. SWOT Analysis
- 16.2.8.4. Recent Developments
- 16.2.8.5. Financials (Based on Availability)
- 16.2.9 Lupin Limited
- 16.2.9.1. Overview
- 16.2.9.2. Products
- 16.2.9.3. SWOT Analysis
- 16.2.9.4. Recent Developments
- 16.2.9.5. Financials (Based on Availability)
- 16.2.10 VIVUS Inc
- 16.2.10.1. Overview
- 16.2.10.2. Products
- 16.2.10.3. SWOT Analysis
- 16.2.10.4. Recent Developments
- 16.2.10.5. Financials (Based on Availability)
- 16.2.11 GlaxoSmithKline PLC
- 16.2.11.1. Overview
- 16.2.11.2. Products
- 16.2.11.3. SWOT Analysis
- 16.2.11.4. Recent Developments
- 16.2.11.5. Financials (Based on Availability)
- 16.2.12 Pfizer Inc
- 16.2.12.1. Overview
- 16.2.12.2. Products
- 16.2.12.3. SWOT Analysis
- 16.2.12.4. Recent Developments
- 16.2.12.5. Financials (Based on Availability)
- 16.2.1 S K Chemicals Co Ltd
List of Figures
- Figure 1: Global Erectile Dysfunction Pills Industry Revenue Breakdown (Million, %) by Region 2024 & 2032
- Figure 2: Global Erectile Dysfunction Pills Industry Volume Breakdown (K Unit, %) by Region 2024 & 2032
- Figure 3: North America Erectile Dysfunction Pills Industry Revenue (Million), by Country 2024 & 2032
- Figure 4: North America Erectile Dysfunction Pills Industry Volume (K Unit), by Country 2024 & 2032
- Figure 5: North America Erectile Dysfunction Pills Industry Revenue Share (%), by Country 2024 & 2032
- Figure 6: North America Erectile Dysfunction Pills Industry Volume Share (%), by Country 2024 & 2032
- Figure 7: Europe Erectile Dysfunction Pills Industry Revenue (Million), by Country 2024 & 2032
- Figure 8: Europe Erectile Dysfunction Pills Industry Volume (K Unit), by Country 2024 & 2032
- Figure 9: Europe Erectile Dysfunction Pills Industry Revenue Share (%), by Country 2024 & 2032
- Figure 10: Europe Erectile Dysfunction Pills Industry Volume Share (%), by Country 2024 & 2032
- Figure 11: Asia Pacific Erectile Dysfunction Pills Industry Revenue (Million), by Country 2024 & 2032
- Figure 12: Asia Pacific Erectile Dysfunction Pills Industry Volume (K Unit), by Country 2024 & 2032
- Figure 13: Asia Pacific Erectile Dysfunction Pills Industry Revenue Share (%), by Country 2024 & 2032
- Figure 14: Asia Pacific Erectile Dysfunction Pills Industry Volume Share (%), by Country 2024 & 2032
- Figure 15: Middle East and Africa Erectile Dysfunction Pills Industry Revenue (Million), by Country 2024 & 2032
- Figure 16: Middle East and Africa Erectile Dysfunction Pills Industry Volume (K Unit), by Country 2024 & 2032
- Figure 17: Middle East and Africa Erectile Dysfunction Pills Industry Revenue Share (%), by Country 2024 & 2032
- Figure 18: Middle East and Africa Erectile Dysfunction Pills Industry Volume Share (%), by Country 2024 & 2032
- Figure 19: South America Erectile Dysfunction Pills Industry Revenue (Million), by Country 2024 & 2032
- Figure 20: South America Erectile Dysfunction Pills Industry Volume (K Unit), by Country 2024 & 2032
- Figure 21: South America Erectile Dysfunction Pills Industry Revenue Share (%), by Country 2024 & 2032
- Figure 22: South America Erectile Dysfunction Pills Industry Volume Share (%), by Country 2024 & 2032
- Figure 23: North America Erectile Dysfunction Pills Industry Revenue (Million), by Product 2024 & 2032
- Figure 24: North America Erectile Dysfunction Pills Industry Volume (K Unit), by Product 2024 & 2032
- Figure 25: North America Erectile Dysfunction Pills Industry Revenue Share (%), by Product 2024 & 2032
- Figure 26: North America Erectile Dysfunction Pills Industry Volume Share (%), by Product 2024 & 2032
- Figure 27: North America Erectile Dysfunction Pills Industry Revenue (Million), by Distribution Channel 2024 & 2032
- Figure 28: North America Erectile Dysfunction Pills Industry Volume (K Unit), by Distribution Channel 2024 & 2032
- Figure 29: North America Erectile Dysfunction Pills Industry Revenue Share (%), by Distribution Channel 2024 & 2032
- Figure 30: North America Erectile Dysfunction Pills Industry Volume Share (%), by Distribution Channel 2024 & 2032
- Figure 31: North America Erectile Dysfunction Pills Industry Revenue (Million), by Country 2024 & 2032
- Figure 32: North America Erectile Dysfunction Pills Industry Volume (K Unit), by Country 2024 & 2032
- Figure 33: North America Erectile Dysfunction Pills Industry Revenue Share (%), by Country 2024 & 2032
- Figure 34: North America Erectile Dysfunction Pills Industry Volume Share (%), by Country 2024 & 2032
- Figure 35: Europe Erectile Dysfunction Pills Industry Revenue (Million), by Product 2024 & 2032
- Figure 36: Europe Erectile Dysfunction Pills Industry Volume (K Unit), by Product 2024 & 2032
- Figure 37: Europe Erectile Dysfunction Pills Industry Revenue Share (%), by Product 2024 & 2032
- Figure 38: Europe Erectile Dysfunction Pills Industry Volume Share (%), by Product 2024 & 2032
- Figure 39: Europe Erectile Dysfunction Pills Industry Revenue (Million), by Distribution Channel 2024 & 2032
- Figure 40: Europe Erectile Dysfunction Pills Industry Volume (K Unit), by Distribution Channel 2024 & 2032
- Figure 41: Europe Erectile Dysfunction Pills Industry Revenue Share (%), by Distribution Channel 2024 & 2032
- Figure 42: Europe Erectile Dysfunction Pills Industry Volume Share (%), by Distribution Channel 2024 & 2032
- Figure 43: Europe Erectile Dysfunction Pills Industry Revenue (Million), by Country 2024 & 2032
- Figure 44: Europe Erectile Dysfunction Pills Industry Volume (K Unit), by Country 2024 & 2032
- Figure 45: Europe Erectile Dysfunction Pills Industry Revenue Share (%), by Country 2024 & 2032
- Figure 46: Europe Erectile Dysfunction Pills Industry Volume Share (%), by Country 2024 & 2032
- Figure 47: Asia Pacific Erectile Dysfunction Pills Industry Revenue (Million), by Product 2024 & 2032
- Figure 48: Asia Pacific Erectile Dysfunction Pills Industry Volume (K Unit), by Product 2024 & 2032
- Figure 49: Asia Pacific Erectile Dysfunction Pills Industry Revenue Share (%), by Product 2024 & 2032
- Figure 50: Asia Pacific Erectile Dysfunction Pills Industry Volume Share (%), by Product 2024 & 2032
- Figure 51: Asia Pacific Erectile Dysfunction Pills Industry Revenue (Million), by Distribution Channel 2024 & 2032
- Figure 52: Asia Pacific Erectile Dysfunction Pills Industry Volume (K Unit), by Distribution Channel 2024 & 2032
- Figure 53: Asia Pacific Erectile Dysfunction Pills Industry Revenue Share (%), by Distribution Channel 2024 & 2032
- Figure 54: Asia Pacific Erectile Dysfunction Pills Industry Volume Share (%), by Distribution Channel 2024 & 2032
- Figure 55: Asia Pacific Erectile Dysfunction Pills Industry Revenue (Million), by Country 2024 & 2032
- Figure 56: Asia Pacific Erectile Dysfunction Pills Industry Volume (K Unit), by Country 2024 & 2032
- Figure 57: Asia Pacific Erectile Dysfunction Pills Industry Revenue Share (%), by Country 2024 & 2032
- Figure 58: Asia Pacific Erectile Dysfunction Pills Industry Volume Share (%), by Country 2024 & 2032
- Figure 59: Middle East and Africa Erectile Dysfunction Pills Industry Revenue (Million), by Product 2024 & 2032
- Figure 60: Middle East and Africa Erectile Dysfunction Pills Industry Volume (K Unit), by Product 2024 & 2032
- Figure 61: Middle East and Africa Erectile Dysfunction Pills Industry Revenue Share (%), by Product 2024 & 2032
- Figure 62: Middle East and Africa Erectile Dysfunction Pills Industry Volume Share (%), by Product 2024 & 2032
- Figure 63: Middle East and Africa Erectile Dysfunction Pills Industry Revenue (Million), by Distribution Channel 2024 & 2032
- Figure 64: Middle East and Africa Erectile Dysfunction Pills Industry Volume (K Unit), by Distribution Channel 2024 & 2032
- Figure 65: Middle East and Africa Erectile Dysfunction Pills Industry Revenue Share (%), by Distribution Channel 2024 & 2032
- Figure 66: Middle East and Africa Erectile Dysfunction Pills Industry Volume Share (%), by Distribution Channel 2024 & 2032
- Figure 67: Middle East and Africa Erectile Dysfunction Pills Industry Revenue (Million), by Country 2024 & 2032
- Figure 68: Middle East and Africa Erectile Dysfunction Pills Industry Volume (K Unit), by Country 2024 & 2032
- Figure 69: Middle East and Africa Erectile Dysfunction Pills Industry Revenue Share (%), by Country 2024 & 2032
- Figure 70: Middle East and Africa Erectile Dysfunction Pills Industry Volume Share (%), by Country 2024 & 2032
- Figure 71: South America Erectile Dysfunction Pills Industry Revenue (Million), by Product 2024 & 2032
- Figure 72: South America Erectile Dysfunction Pills Industry Volume (K Unit), by Product 2024 & 2032
- Figure 73: South America Erectile Dysfunction Pills Industry Revenue Share (%), by Product 2024 & 2032
- Figure 74: South America Erectile Dysfunction Pills Industry Volume Share (%), by Product 2024 & 2032
- Figure 75: South America Erectile Dysfunction Pills Industry Revenue (Million), by Distribution Channel 2024 & 2032
- Figure 76: South America Erectile Dysfunction Pills Industry Volume (K Unit), by Distribution Channel 2024 & 2032
- Figure 77: South America Erectile Dysfunction Pills Industry Revenue Share (%), by Distribution Channel 2024 & 2032
- Figure 78: South America Erectile Dysfunction Pills Industry Volume Share (%), by Distribution Channel 2024 & 2032
- Figure 79: South America Erectile Dysfunction Pills Industry Revenue (Million), by Country 2024 & 2032
- Figure 80: South America Erectile Dysfunction Pills Industry Volume (K Unit), by Country 2024 & 2032
- Figure 81: South America Erectile Dysfunction Pills Industry Revenue Share (%), by Country 2024 & 2032
- Figure 82: South America Erectile Dysfunction Pills Industry Volume Share (%), by Country 2024 & 2032
List of Tables
- Table 1: Global Erectile Dysfunction Pills Industry Revenue Million Forecast, by Region 2019 & 2032
- Table 2: Global Erectile Dysfunction Pills Industry Volume K Unit Forecast, by Region 2019 & 2032
- Table 3: Global Erectile Dysfunction Pills Industry Revenue Million Forecast, by Product 2019 & 2032
- Table 4: Global Erectile Dysfunction Pills Industry Volume K Unit Forecast, by Product 2019 & 2032
- Table 5: Global Erectile Dysfunction Pills Industry Revenue Million Forecast, by Distribution Channel 2019 & 2032
- Table 6: Global Erectile Dysfunction Pills Industry Volume K Unit Forecast, by Distribution Channel 2019 & 2032
- Table 7: Global Erectile Dysfunction Pills Industry Revenue Million Forecast, by Region 2019 & 2032
- Table 8: Global Erectile Dysfunction Pills Industry Volume K Unit Forecast, by Region 2019 & 2032
- Table 9: Global Erectile Dysfunction Pills Industry Revenue Million Forecast, by Country 2019 & 2032
- Table 10: Global Erectile Dysfunction Pills Industry Volume K Unit Forecast, by Country 2019 & 2032
- Table 11: United States Erectile Dysfunction Pills Industry Revenue (Million) Forecast, by Application 2019 & 2032
- Table 12: United States Erectile Dysfunction Pills Industry Volume (K Unit) Forecast, by Application 2019 & 2032
- Table 13: Canada Erectile Dysfunction Pills Industry Revenue (Million) Forecast, by Application 2019 & 2032
- Table 14: Canada Erectile Dysfunction Pills Industry Volume (K Unit) Forecast, by Application 2019 & 2032
- Table 15: Mexico Erectile Dysfunction Pills Industry Revenue (Million) Forecast, by Application 2019 & 2032
- Table 16: Mexico Erectile Dysfunction Pills Industry Volume (K Unit) Forecast, by Application 2019 & 2032
- Table 17: Global Erectile Dysfunction Pills Industry Revenue Million Forecast, by Country 2019 & 2032
- Table 18: Global Erectile Dysfunction Pills Industry Volume K Unit Forecast, by Country 2019 & 2032
- Table 19: Germany Erectile Dysfunction Pills Industry Revenue (Million) Forecast, by Application 2019 & 2032
- Table 20: Germany Erectile Dysfunction Pills Industry Volume (K Unit) Forecast, by Application 2019 & 2032
- Table 21: United Kingdom Erectile Dysfunction Pills Industry Revenue (Million) Forecast, by Application 2019 & 2032
- Table 22: United Kingdom Erectile Dysfunction Pills Industry Volume (K Unit) Forecast, by Application 2019 & 2032
- Table 23: France Erectile Dysfunction Pills Industry Revenue (Million) Forecast, by Application 2019 & 2032
- Table 24: France Erectile Dysfunction Pills Industry Volume (K Unit) Forecast, by Application 2019 & 2032
- Table 25: Italy Erectile Dysfunction Pills Industry Revenue (Million) Forecast, by Application 2019 & 2032
- Table 26: Italy Erectile Dysfunction Pills Industry Volume (K Unit) Forecast, by Application 2019 & 2032
- Table 27: Spain Erectile Dysfunction Pills Industry Revenue (Million) Forecast, by Application 2019 & 2032
- Table 28: Spain Erectile Dysfunction Pills Industry Volume (K Unit) Forecast, by Application 2019 & 2032
- Table 29: Rest of Europe Erectile Dysfunction Pills Industry Revenue (Million) Forecast, by Application 2019 & 2032
- Table 30: Rest of Europe Erectile Dysfunction Pills Industry Volume (K Unit) Forecast, by Application 2019 & 2032
- Table 31: Global Erectile Dysfunction Pills Industry Revenue Million Forecast, by Country 2019 & 2032
- Table 32: Global Erectile Dysfunction Pills Industry Volume K Unit Forecast, by Country 2019 & 2032
- Table 33: China Erectile Dysfunction Pills Industry Revenue (Million) Forecast, by Application 2019 & 2032
- Table 34: China Erectile Dysfunction Pills Industry Volume (K Unit) Forecast, by Application 2019 & 2032
- Table 35: Japan Erectile Dysfunction Pills Industry Revenue (Million) Forecast, by Application 2019 & 2032
- Table 36: Japan Erectile Dysfunction Pills Industry Volume (K Unit) Forecast, by Application 2019 & 2032
- Table 37: India Erectile Dysfunction Pills Industry Revenue (Million) Forecast, by Application 2019 & 2032
- Table 38: India Erectile Dysfunction Pills Industry Volume (K Unit) Forecast, by Application 2019 & 2032
- Table 39: Australia Erectile Dysfunction Pills Industry Revenue (Million) Forecast, by Application 2019 & 2032
- Table 40: Australia Erectile Dysfunction Pills Industry Volume (K Unit) Forecast, by Application 2019 & 2032
- Table 41: South Korea Erectile Dysfunction Pills Industry Revenue (Million) Forecast, by Application 2019 & 2032
- Table 42: South Korea Erectile Dysfunction Pills Industry Volume (K Unit) Forecast, by Application 2019 & 2032
- Table 43: Rest of Asia Pacific Erectile Dysfunction Pills Industry Revenue (Million) Forecast, by Application 2019 & 2032
- Table 44: Rest of Asia Pacific Erectile Dysfunction Pills Industry Volume (K Unit) Forecast, by Application 2019 & 2032
- Table 45: Global Erectile Dysfunction Pills Industry Revenue Million Forecast, by Country 2019 & 2032
- Table 46: Global Erectile Dysfunction Pills Industry Volume K Unit Forecast, by Country 2019 & 2032
- Table 47: GCC Erectile Dysfunction Pills Industry Revenue (Million) Forecast, by Application 2019 & 2032
- Table 48: GCC Erectile Dysfunction Pills Industry Volume (K Unit) Forecast, by Application 2019 & 2032
- Table 49: South Africa Erectile Dysfunction Pills Industry Revenue (Million) Forecast, by Application 2019 & 2032
- Table 50: South Africa Erectile Dysfunction Pills Industry Volume (K Unit) Forecast, by Application 2019 & 2032
- Table 51: Rest of Middle East and Africa Erectile Dysfunction Pills Industry Revenue (Million) Forecast, by Application 2019 & 2032
- Table 52: Rest of Middle East and Africa Erectile Dysfunction Pills Industry Volume (K Unit) Forecast, by Application 2019 & 2032
- Table 53: Global Erectile Dysfunction Pills Industry Revenue Million Forecast, by Country 2019 & 2032
- Table 54: Global Erectile Dysfunction Pills Industry Volume K Unit Forecast, by Country 2019 & 2032
- Table 55: Brazil Erectile Dysfunction Pills Industry Revenue (Million) Forecast, by Application 2019 & 2032
- Table 56: Brazil Erectile Dysfunction Pills Industry Volume (K Unit) Forecast, by Application 2019 & 2032
- Table 57: Argentina Erectile Dysfunction Pills Industry Revenue (Million) Forecast, by Application 2019 & 2032
- Table 58: Argentina Erectile Dysfunction Pills Industry Volume (K Unit) Forecast, by Application 2019 & 2032
- Table 59: Rest of South America Erectile Dysfunction Pills Industry Revenue (Million) Forecast, by Application 2019 & 2032
- Table 60: Rest of South America Erectile Dysfunction Pills Industry Volume (K Unit) Forecast, by Application 2019 & 2032
- Table 61: Global Erectile Dysfunction Pills Industry Revenue Million Forecast, by Product 2019 & 2032
- Table 62: Global Erectile Dysfunction Pills Industry Volume K Unit Forecast, by Product 2019 & 2032
- Table 63: Global Erectile Dysfunction Pills Industry Revenue Million Forecast, by Distribution Channel 2019 & 2032
- Table 64: Global Erectile Dysfunction Pills Industry Volume K Unit Forecast, by Distribution Channel 2019 & 2032
- Table 65: Global Erectile Dysfunction Pills Industry Revenue Million Forecast, by Country 2019 & 2032
- Table 66: Global Erectile Dysfunction Pills Industry Volume K Unit Forecast, by Country 2019 & 2032
- Table 67: United States Erectile Dysfunction Pills Industry Revenue (Million) Forecast, by Application 2019 & 2032
- Table 68: United States Erectile Dysfunction Pills Industry Volume (K Unit) Forecast, by Application 2019 & 2032
- Table 69: Canada Erectile Dysfunction Pills Industry Revenue (Million) Forecast, by Application 2019 & 2032
- Table 70: Canada Erectile Dysfunction Pills Industry Volume (K Unit) Forecast, by Application 2019 & 2032
- Table 71: Mexico Erectile Dysfunction Pills Industry Revenue (Million) Forecast, by Application 2019 & 2032
- Table 72: Mexico Erectile Dysfunction Pills Industry Volume (K Unit) Forecast, by Application 2019 & 2032
- Table 73: Global Erectile Dysfunction Pills Industry Revenue Million Forecast, by Product 2019 & 2032
- Table 74: Global Erectile Dysfunction Pills Industry Volume K Unit Forecast, by Product 2019 & 2032
- Table 75: Global Erectile Dysfunction Pills Industry Revenue Million Forecast, by Distribution Channel 2019 & 2032
- Table 76: Global Erectile Dysfunction Pills Industry Volume K Unit Forecast, by Distribution Channel 2019 & 2032
- Table 77: Global Erectile Dysfunction Pills Industry Revenue Million Forecast, by Country 2019 & 2032
- Table 78: Global Erectile Dysfunction Pills Industry Volume K Unit Forecast, by Country 2019 & 2032
- Table 79: Germany Erectile Dysfunction Pills Industry Revenue (Million) Forecast, by Application 2019 & 2032
- Table 80: Germany Erectile Dysfunction Pills Industry Volume (K Unit) Forecast, by Application 2019 & 2032
- Table 81: United Kingdom Erectile Dysfunction Pills Industry Revenue (Million) Forecast, by Application 2019 & 2032
- Table 82: United Kingdom Erectile Dysfunction Pills Industry Volume (K Unit) Forecast, by Application 2019 & 2032
- Table 83: France Erectile Dysfunction Pills Industry Revenue (Million) Forecast, by Application 2019 & 2032
- Table 84: France Erectile Dysfunction Pills Industry Volume (K Unit) Forecast, by Application 2019 & 2032
- Table 85: Italy Erectile Dysfunction Pills Industry Revenue (Million) Forecast, by Application 2019 & 2032
- Table 86: Italy Erectile Dysfunction Pills Industry Volume (K Unit) Forecast, by Application 2019 & 2032
- Table 87: Spain Erectile Dysfunction Pills Industry Revenue (Million) Forecast, by Application 2019 & 2032
- Table 88: Spain Erectile Dysfunction Pills Industry Volume (K Unit) Forecast, by Application 2019 & 2032
- Table 89: Rest of Europe Erectile Dysfunction Pills Industry Revenue (Million) Forecast, by Application 2019 & 2032
- Table 90: Rest of Europe Erectile Dysfunction Pills Industry Volume (K Unit) Forecast, by Application 2019 & 2032
- Table 91: Global Erectile Dysfunction Pills Industry Revenue Million Forecast, by Product 2019 & 2032
- Table 92: Global Erectile Dysfunction Pills Industry Volume K Unit Forecast, by Product 2019 & 2032
- Table 93: Global Erectile Dysfunction Pills Industry Revenue Million Forecast, by Distribution Channel 2019 & 2032
- Table 94: Global Erectile Dysfunction Pills Industry Volume K Unit Forecast, by Distribution Channel 2019 & 2032
- Table 95: Global Erectile Dysfunction Pills Industry Revenue Million Forecast, by Country 2019 & 2032
- Table 96: Global Erectile Dysfunction Pills Industry Volume K Unit Forecast, by Country 2019 & 2032
- Table 97: China Erectile Dysfunction Pills Industry Revenue (Million) Forecast, by Application 2019 & 2032
- Table 98: China Erectile Dysfunction Pills Industry Volume (K Unit) Forecast, by Application 2019 & 2032
- Table 99: Japan Erectile Dysfunction Pills Industry Revenue (Million) Forecast, by Application 2019 & 2032
- Table 100: Japan Erectile Dysfunction Pills Industry Volume (K Unit) Forecast, by Application 2019 & 2032
- Table 101: India Erectile Dysfunction Pills Industry Revenue (Million) Forecast, by Application 2019 & 2032
- Table 102: India Erectile Dysfunction Pills Industry Volume (K Unit) Forecast, by Application 2019 & 2032
- Table 103: Australia Erectile Dysfunction Pills Industry Revenue (Million) Forecast, by Application 2019 & 2032
- Table 104: Australia Erectile Dysfunction Pills Industry Volume (K Unit) Forecast, by Application 2019 & 2032
- Table 105: South Korea Erectile Dysfunction Pills Industry Revenue (Million) Forecast, by Application 2019 & 2032
- Table 106: South Korea Erectile Dysfunction Pills Industry Volume (K Unit) Forecast, by Application 2019 & 2032
- Table 107: Rest of Asia Pacific Erectile Dysfunction Pills Industry Revenue (Million) Forecast, by Application 2019 & 2032
- Table 108: Rest of Asia Pacific Erectile Dysfunction Pills Industry Volume (K Unit) Forecast, by Application 2019 & 2032
- Table 109: Global Erectile Dysfunction Pills Industry Revenue Million Forecast, by Product 2019 & 2032
- Table 110: Global Erectile Dysfunction Pills Industry Volume K Unit Forecast, by Product 2019 & 2032
- Table 111: Global Erectile Dysfunction Pills Industry Revenue Million Forecast, by Distribution Channel 2019 & 2032
- Table 112: Global Erectile Dysfunction Pills Industry Volume K Unit Forecast, by Distribution Channel 2019 & 2032
- Table 113: Global Erectile Dysfunction Pills Industry Revenue Million Forecast, by Country 2019 & 2032
- Table 114: Global Erectile Dysfunction Pills Industry Volume K Unit Forecast, by Country 2019 & 2032
- Table 115: GCC Erectile Dysfunction Pills Industry Revenue (Million) Forecast, by Application 2019 & 2032
- Table 116: GCC Erectile Dysfunction Pills Industry Volume (K Unit) Forecast, by Application 2019 & 2032
- Table 117: South Africa Erectile Dysfunction Pills Industry Revenue (Million) Forecast, by Application 2019 & 2032
- Table 118: South Africa Erectile Dysfunction Pills Industry Volume (K Unit) Forecast, by Application 2019 & 2032
- Table 119: Rest of Middle East and Africa Erectile Dysfunction Pills Industry Revenue (Million) Forecast, by Application 2019 & 2032
- Table 120: Rest of Middle East and Africa Erectile Dysfunction Pills Industry Volume (K Unit) Forecast, by Application 2019 & 2032
- Table 121: Global Erectile Dysfunction Pills Industry Revenue Million Forecast, by Product 2019 & 2032
- Table 122: Global Erectile Dysfunction Pills Industry Volume K Unit Forecast, by Product 2019 & 2032
- Table 123: Global Erectile Dysfunction Pills Industry Revenue Million Forecast, by Distribution Channel 2019 & 2032
- Table 124: Global Erectile Dysfunction Pills Industry Volume K Unit Forecast, by Distribution Channel 2019 & 2032
- Table 125: Global Erectile Dysfunction Pills Industry Revenue Million Forecast, by Country 2019 & 2032
- Table 126: Global Erectile Dysfunction Pills Industry Volume K Unit Forecast, by Country 2019 & 2032
- Table 127: Brazil Erectile Dysfunction Pills Industry Revenue (Million) Forecast, by Application 2019 & 2032
- Table 128: Brazil Erectile Dysfunction Pills Industry Volume (K Unit) Forecast, by Application 2019 & 2032
- Table 129: Argentina Erectile Dysfunction Pills Industry Revenue (Million) Forecast, by Application 2019 & 2032
- Table 130: Argentina Erectile Dysfunction Pills Industry Volume (K Unit) Forecast, by Application 2019 & 2032
- Table 131: Rest of South America Erectile Dysfunction Pills Industry Revenue (Million) Forecast, by Application 2019 & 2032
- Table 132: Rest of South America Erectile Dysfunction Pills Industry Volume (K Unit) Forecast, by Application 2019 & 2032
Frequently Asked Questions
1. What is the projected Compound Annual Growth Rate (CAGR) of the Erectile Dysfunction Pills Industry?
The projected CAGR is approximately 3.80%.
2. Which companies are prominent players in the Erectile Dysfunction Pills Industry?
Key companies in the market include S K Chemicals Co Ltd, Bayer AG, Glenmark Pharmaceuticals Limited, Eli Lilly and Company, Petros Pharmaceutical, Teva Pharmaceutical Industries Ltd, Apricus Biosciences Inc, Cipla Ltd, Lupin Limited, VIVUS Inc, GlaxoSmithKline PLC, Pfizer Inc.
3. What are the main segments of the Erectile Dysfunction Pills Industry?
The market segments include Product, Distribution Channel.
4. Can you provide details about the market size?
The market size is estimated to be USD XX Million as of 2022.
5. What are some drivers contributing to market growth?
Rising Adoption of a Sedentary Lifestyle Along with the Associated Stress; Rising Geriatric Population; Comorbidity between Erectile Dysfunction and Heart Diseases and Diabetes.
6. What are the notable trends driving market growth?
The Viagra (sildenafil citrate) Segment is Expected to Dominate the Market.
7. Are there any restraints impacting market growth?
Reluctance of Patients to Seek Treatment; Poor Patient Adherence to ED Drugs.
8. Can you provide examples of recent developments in the market?
In September 2021, iX Biopharma, through its wholly-owned subsidiary, signed an agreement with CRPCG for the licensing, supply, and distribution of Wafesil, a sublingual sildenafil wafer for the treatment of male erectile dysfunction, in China.
9. What pricing options are available for accessing the report?
Pricing options include single-user, multi-user, and enterprise licenses priced at USD 4750, USD 5250, and USD 8750 respectively.
10. Is the market size provided in terms of value or volume?
The market size is provided in terms of value, measured in Million and volume, measured in K Unit.
11. Are there any specific market keywords associated with the report?
Yes, the market keyword associated with the report is "Erectile Dysfunction Pills Industry," which aids in identifying and referencing the specific market segment covered.
12. How do I determine which pricing option suits my needs best?
The pricing options vary based on user requirements and access needs. Individual users may opt for single-user licenses, while businesses requiring broader access may choose multi-user or enterprise licenses for cost-effective access to the report.
13. Are there any additional resources or data provided in the Erectile Dysfunction Pills Industry report?
While the report offers comprehensive insights, it's advisable to review the specific contents or supplementary materials provided to ascertain if additional resources or data are available.
14. How can I stay updated on further developments or reports in the Erectile Dysfunction Pills Industry?
To stay informed about further developments, trends, and reports in the Erectile Dysfunction Pills Industry, consider subscribing to industry newsletters, following relevant companies and organizations, or regularly checking reputable industry news sources and publications.
Methodology
Step 1 - Identification of Relevant Samples Size from Population Database


Step 2 - Approaches for Defining Global Market Size (Value, Volume* & Price*)

Note*: In applicable scenarios
Step 3 - Data Sources
Primary Research
- Web Analytics
- Survey Reports
- Research Institute
- Latest Research Reports
- Opinion Leaders
Secondary Research
- Annual Reports
- White Paper
- Latest Press Release
- Industry Association
- Paid Database
- Investor Presentations

Step 4 - Data Triangulation
Involves using different sources of information in order to increase the validity of a study
These sources are likely to be stakeholders in a program - participants, other researchers, program staff, other community members, and so on.
Then we put all data in single framework & apply various statistical tools to find out the dynamic on the market.
During the analysis stage, feedback from the stakeholder groups would be compared to determine areas of agreement as well as areas of divergence
